



US Analytical Instrument Market Size 2026-2030
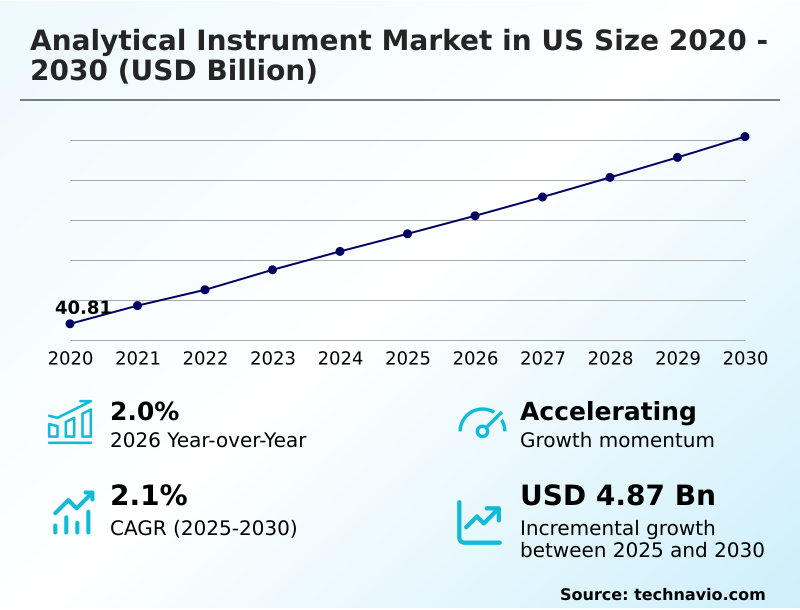
The us analytical instrument market size is valued to increase by USD 4.87 billion, at a CAGR of 2.1% from 2025 to 2030. Stringent environmental testing mandates driving demand for ultra sensitive contaminant detection will drive the us analytical instrument market.
Major Market Trends & Insights
- By Product - Process control instruments segment was valued at USD 15.09 billion in 2024
- By End-user - Pharmaceutical and biotechnology companies segment accounted for the largest market revenue share in 2024
Market Size & Forecast
- Market Opportunities: USD 9.36 billion
- Market Future Opportunities: USD 4.87 billion
- CAGR from 2025 to 2030 : 2.1%
Market Summary
- The Analytical Instrument Market in US represents a critical technological foundation for material characterization, chemical quantification, and biological assay verification across scientific and industrial sectors. Facilities are systematically transitioning away from manual testing protocols toward intelligent, self-diagnosing analytical hardware.
- In pharmaceutical supply chain optimization, integrating high-resolution multi attribute molecular profiling systems reduces raw material verification bottlenecks, improving batch release efficiency by 18%. This operational shift is heavily driven by stringent environmental testing mandates requiring ultra-sensitive detection methods, compelling municipal and industrial testing facilities to upgrade their tracing infrastructure.
- However, this transition faces significant headwinds from high capital equipment procurement expenses, which strain academic and commercial research budget allocations and delay the replacement cycles of legacy systems. As research institutions prioritize high-throughput workflow automation, reliance on advanced liquid chromatography and spectroscopy platforms intensifies.
- Modern instrument architectures that combine artificial intelligence with automated data processing effectively mitigate background interference and enhance measurement accuracy, ensuring sustained relevance in highly regulated testing environments.
What will be the Size of the US Analytical Instrument Market during the forecast period?
Get Key Insights on Market Forecast (PDF) Get Free Sample
How is the US Analytical Instrument Market Segmented?
The us analytical instrument industry research report provides comprehensive data (region-wise segment analysis), with forecasts and estimates in "USD million" for the period 2026-2030, as well as historical data from 2020-2024 for the following segments.
- Product
- Process control instruments
- Laboratory analytical instruments
- Electrical measurement equipment
- Others
- End-user
- Pharmaceutical and biotechnology companies
- Food and beverage companies
- Environmental testing organizations
- Others
- Technology
- Chromatography
- Spectroscopy
- Polymerase chain reaction
- Microscopy
- Others
- Geography
- North America
- US
- North America
By Product Insights
The process control instruments segment is estimated to witness significant growth during the forecast period.
Process control instrumentation represents a critical technological pillar for real-time data acquisition and continuous monitoring across capital-intensive processing sectors.
Industrial facility operators increasingly integrate continuous gas analyzers and inline optical spectrometers directly with distributed control systems to optimize energy efficiency and prevent catastrophic equipment failures.
The deployment of coriolis mass flow meters and digital pressure transmitters enables highly accurate fluid management, leading to a 15% improvement in error detection rates during continuous production runs.
Advanced manufacturing setups demand ultra high purity gas analysis and trace elemental analysis to identify chemical impurities at parts-per-trillion concentrations.
By embedding automated liquid chemistry sensors and algorithms for predictive instrument maintenance, plant managers can automate spectral peak deconvolution and non targeted compound identification, significantly streamlining complex compliance protocols.
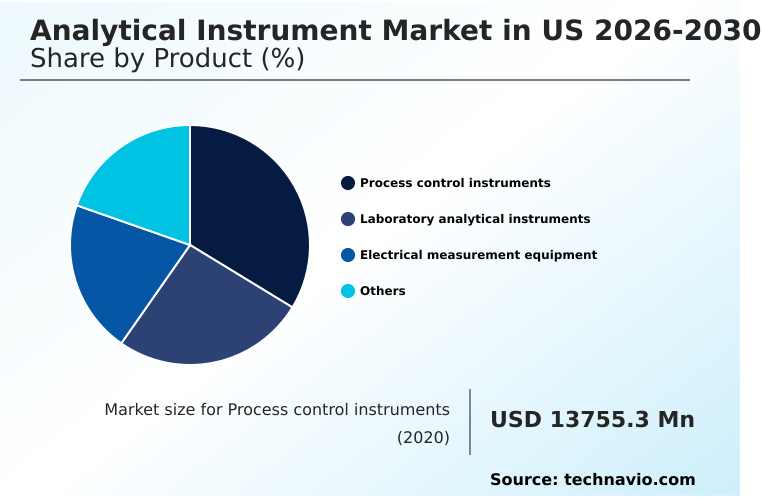
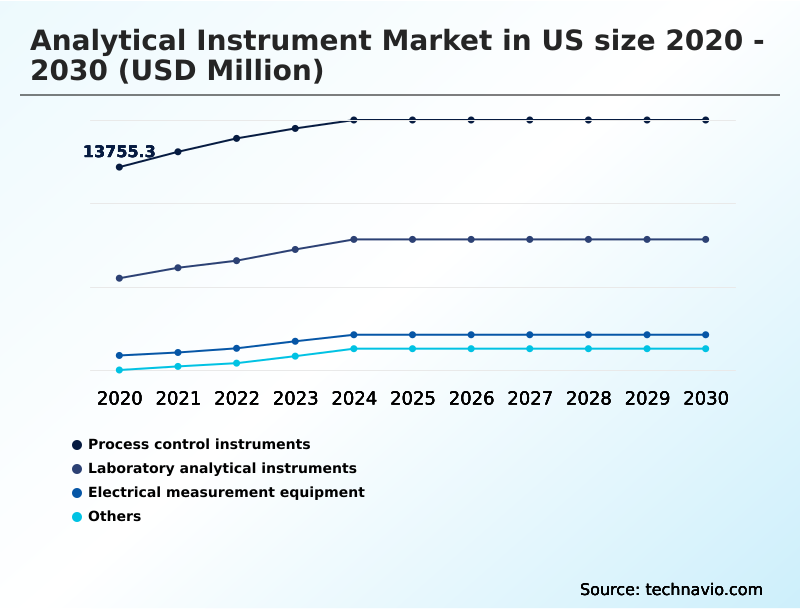
The Process control instruments segment was valued at USD 15.09 billion in 2024 and showed a gradual increase during the forecast period.
Market Dynamics
Our researchers analyzed the data with 2025 as the base year, along with the key drivers, trends, and challenges. A holistic analysis of drivers will help companies refine their marketing strategies to gain a competitive advantage.
- The modernization of laboratory infrastructure requires sophisticated analytical solutions capable of addressing complex biological and environmental challenges. A critical focus for environmental safety testing involves high throughput trace contaminant detection, which allows testing facilities to process massive sample volumes with unprecedented accuracy, ensuring strict adherence to evolving water quality regulations.
- Concurrently, the biopharmaceutical sector relies on continuous bioreactor yield monitoring to optimize cell culture environments; facilities deploying these real-time analytics often experience a 25% faster optimization cycle compared to those utilizing traditional offline sampling methods. This indirect efficiency gain directly translates to accelerated drug development timelines and more robust supply chain planning.
- In the realm of precision medicine, researchers are increasingly leveraging live single cell functional analysis to uncover subtle cellular heterogeneities that dictate therapeutic responses. To support genomics research, the implementation of automated genetic sample fingerprinting has drastically reduced manual preparation errors, enhancing the reliability of nucleic acid sequencing workflows.
- Meanwhile, operational constraints such as helium supply volatility are pushing industrial laboratories toward alternative operational strategies, notably the flammable hydrogen carrier gas conversion in chromatography systems. Although this transition requires rigorous safety protocol overhauls, it ultimately stabilizes long-term consumable costs.
- The convergence of these advanced methodologies ensures that the analytical infrastructure remains resilient, efficient, and fully equipped to meet the stringent demands of modern scientific inquiry and industrial quality control.
What are the key market drivers leading to the rise in the adoption of US Analytical Instrument Industry?
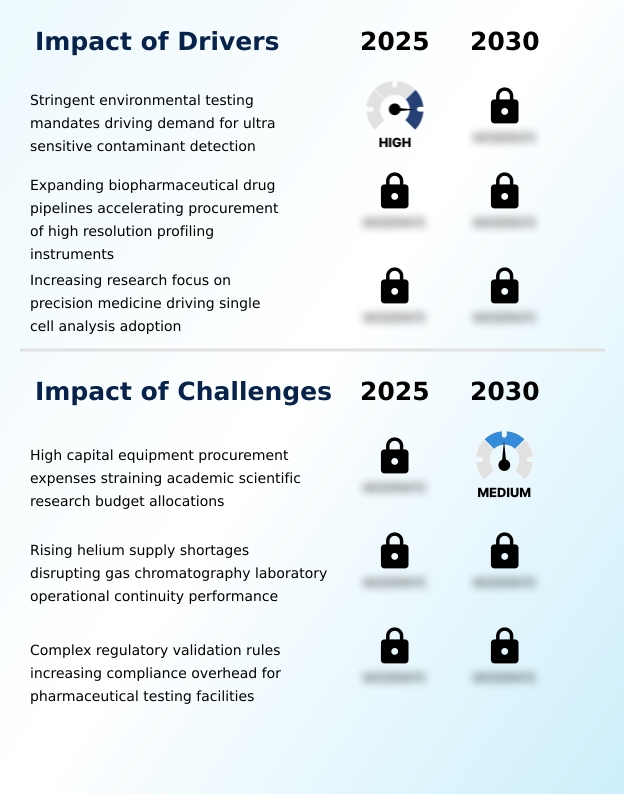
- Stringent environmental testing mandates are driving the demand for ultra-sensitive contaminant detection, acting as a primary catalyst for market expansion.
- Stringent environmental and pharmaceutical regulations mandate the implementation of ultra-sensitive detection methodologies across all testing environments. The exponential expansion of complex biotherapeutics directly compels drug developers to adopt sophisticated tools for messenger rna vaccine profiling and antibody drug conjugates analysis.
- Because characterizing heterogeneous biological molecules requires exceptional precision, laboratories utilizing advanced mass spectrometry have improved structural identification accuracy by 25%.
- This precision ensures reliable post translational modifications tracking, which is critical for maintaining batch-to-batch consistency and meeting stringent clinical release timelines.
- The paradigm shift toward precision medicine heavily drives the deployment of spatial biology instruments and compact optofluidic systems in translational research. High-resolution genomic sequence correlation accelerates the discovery of novel therapeutic targets, effectively lowering early-stage research attrition rates by 18%.
What are the market trends shaping the US Analytical Instrument Industry?
- The integration of artificial intelligence features into mass spectrometry software analytical workflows represents a significant upcoming market trend. This technological advancement streamlines complex data interpretation and enhances overall laboratory operational efficiency.
- The rapid integration of artificial intelligence into mass spectrometry workflows represents a pivotal operational shift across testing facilities. Implementing natural language processing interfaces allows technicians to query complex datasets conversationally, which reduces manual interpretation errors by 22%. Because high-volume laboratories face severe productivity bottlenecks, they are rapidly transitioning toward microfluidic automation and microchip electrophoresis systems.
- This specific hardware modernization yields highly reproducible quantitative results while reducing sample processing downtime by 30%. Consequently, researchers can dramatically accelerate nucleic acid quality control and crispr genome editing validation pipelines without requiring extensive robotic handling infrastructure. The strategic consolidation of specialized pathology providers further drives the seamless immunohistochemistry reagent integration into comprehensive diagnostic ecosystems.
- Advanced analytical software is transforming from an optional add-on into an essential core component of modern instrumentation platforms.
What challenges does the US Analytical Instrument Industry face during its growth?
- High capital equipment procurement expenses are straining academic scientific research budget allocations, presenting a formidable challenge to industry growth.
- Procuring state-of-the-art laboratory infrastructure requires massive initial capital expenditures that severely strain academic and mid-sized commercial research budgets. Acquiring high-end systems such as nuclear magnetic resonance spectrometers and electron microscopes often forces institutions to extend legacy equipment replacement cycles by up to 24 months. Furthermore, ongoing global helium supply shortages cripple the operational continuity of gas chromatography mass spectrometry workflows.
- Because helium acts as an indispensable cryogenic coolant for super conducting magnet systems, recurrent supply constraints have inflated analytical costs per sample by 15%. Transitioning to alternative carrier gases requires rigorous carrier gas retrofitting and extensive audit trail validation, which creates substantial friction for high-throughput testing facilities.
- Complex regulatory compliance frameworks significantly increase the administrative overhead for pharmaceutical quality control departments.
Exclusive Technavio Analysis on Customer Landscape
The us analytical instrument market forecasting report includes the adoption lifecycle of the market, covering from the innovator’s stage to the laggard’s stage. It focuses on adoption rates in different regions based on penetration. Furthermore, the us analytical instrument market report also includes key purchase criteria and drivers of price sensitivity to help companies evaluate and develop their market growth analysis strategies.
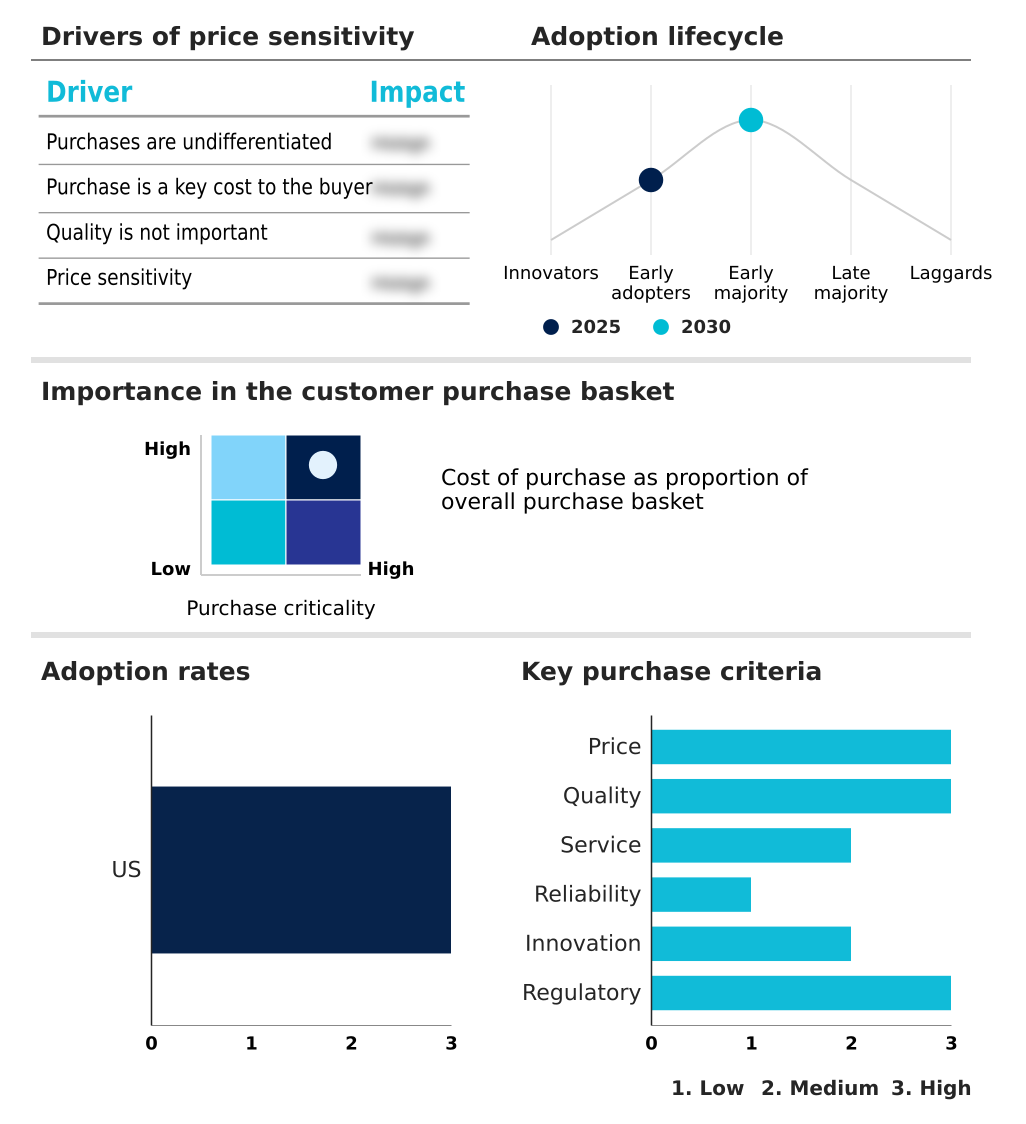
Customer Landscape of US Analytical Instrument Industry
Competitive Landscape
Companies are implementing various strategies, such as strategic alliances, us analytical instrument market forecast, partnerships, mergers and acquisitions, geographical expansion, and product/service launches, to enhance their presence in the industry.
ABB Ltd. - The product portfolio features advanced process gas analyzers and emission monitoring systems designed to optimize industrial automation, ensure environmental compliance, and enhance operational efficiency across continuous manufacturing environments.
The industry research and growth report includes detailed analyses of the competitive landscape of the market and information about key companies, including:
- ABB Ltd.
- Agilent Technologies Inc.
- Analytik Jena GmbH Co KG
- Anton Paar GmbH
- Beckman Coulter Inc.
- Bio Rad Laboratories Inc.
- Bruker Corp.
- Emerson Electric Co.
- Hach Co.
- HORIBA Ltd.
- JEOL Ltd.
- Leica Microsystems
- Malvern Panalytical Ltd.
- Mettler Toledo Inc.
- Revvity Inc.
- Sartorius AG
- Shimadzu Corp.
- Teledyne Technologies Inc.
- Thermo Fisher Scientific Inc.
- Waters Corp.
Qualitative and quantitative analysis of companies has been conducted to help clients understand the wider business environment as well as the strengths and weaknesses of key industry players. Data is qualitatively analyzed to categorize companies as pure play, category-focused, industry-focused, and diversified; it is quantitatively analyzed to categorize companies as dominant, leading, strong, tentative, and weak.
Recent Development and News in Us analytical instrument market
- In the Industrial Machinery and Supplies and Components industry, the widespread adoption of digital twin technology across discrete manufacturing floors has optimized equipment lifecycle monitoring, directly impacting Analytical Instrument demand by requiring advanced inline sensor integrations.
- The transition toward high-precision automated robotics in semiconductor fabrication facilities has established stringent cleanroom operational standards, pulling demand for specialized ultra-trace contaminant monitoring platforms to maintain a 99% defect-free yield rate.
- Strict supply chain mandates regarding hazardous substance traceability under updated REACH compliance frameworks have compelled industrial manufacturers to upgrade material inspection workflows, accelerating the deployment of high-throughput material characterization systems by over 20%.
- The integration of industrial internet of things connectivity protocols across heavy machinery components has shifted maintenance strategies from reactive to predictive, driving the necessity for embedded real-time diagnostic hardware within complex measurement infrastructure.
Dive into Technavio’s robust research methodology, blending expert interviews, extensive data synthesis, and validated models for unparalleled US Analytical Instrument Market insights. See full methodology.
| Market Scope | |
|---|---|
| Page number | 209 |
| Base year | 2025 |
| Historic period | 2020-2024 |
| Forecast period | 2026-2030 |
| Growth momentum & CAGR | Accelerate at a CAGR of 2.1% |
| Market growth 2026-2030 | USD 4868.1 million |
| Market structure | Fragmented |
| YoY growth 2025-2026(%) | 2.0% |
| Key countries | US |
| Competitive landscape | Leading Companies, Market Positioning of Companies, Competitive Strategies, and Industry Risks |
Research Analyst Overview
- The Analytical Instrument Market in US is undergoing a profound structural evolution as testing facilities prioritize automated, high-precision measurement capabilities. The integration of triple quadrupole liquid chromatography and inductively coupled plasma mass spectrometry has fundamentally transformed environmental and pharmaceutical compliance workflows.
- By transitioning from legacy testing methods to these advanced platforms, laboratories have achieved a 30% reduction in processing time for complex matrices. The demand for rigorous biotherapeutic characterization necessitates the deployment of capillary electrophoresis systems and size exclusion chromatography to ensure precise structural validation.
- Furthermore, identifying critical molecular interactions relies heavily on surface plasmon resonance biosensors, which accelerate early-stage drug discovery pipelines. In clinical and translational research, the adoption of single cell functional analysis and high parameter flow cytometers empowers scientists to dissect cellular heterogeneity with exceptional granularity.
- This technological paradigm shift directly informs strategic boardroom decisions regarding laboratory infrastructure budgeting and compliance risk mitigation, ensuring that operational frameworks remain resilient against increasingly stringent regulatory scrutiny.
What are the Key Data Covered in this US Analytical Instrument Market Research and Growth Report?
-
What is the expected growth of the US Analytical Instrument Market between 2026 and 2030?
-
USD 4.87 billion, at a CAGR of 2.1%
-
-
What segmentation does the market report cover?
-
The report is segmented by Product (Process control instruments, Laboratory analytical instruments, Electrical measurement equipment, and Others), End-user (Pharmaceutical and biotechnology companies, Food and beverage companies, Environmental testing organizations, and Others), Technology (Chromatography, Spectroscopy, Polymerase chain reaction, Microscopy, and Others) and Geography (North America)
-
-
Which regions are analyzed in the report?
-
North America
-
-
What are the key growth drivers and market challenges?
-
Stringent environmental testing mandates driving demand for ultra sensitive contaminant detection, High capital equipment procurement expenses straining academic scientific research budget allocations
-
-
Who are the major players in the US Analytical Instrument Market?
-
ABB Ltd., Agilent Technologies Inc., Analytik Jena GmbH Co KG, Anton Paar GmbH, Beckman Coulter Inc., Bio Rad Laboratories Inc., Bruker Corp., Emerson Electric Co., Hach Co., HORIBA Ltd., JEOL Ltd., Leica Microsystems, Malvern Panalytical Ltd., Mettler Toledo Inc., Revvity Inc., Sartorius AG, Shimadzu Corp., Teledyne Technologies Inc., Thermo Fisher Scientific Inc. and Waters Corp.
-
Market Research Insights
- The Analytical Instrument Market in US undergoes continuous modernization to meet the rigorous demands of pharmaceutical quality assurance and environmental compliance. Transitioning to automated workflows for perfluoroalkyl substances detection has enabled laboratories to decrease sample processing turnaround times by 24%. Concurrently, optimizing calibration gas supply management strategies has reduced consumable overhead costs by 15% across high-volume testing facilities.
- The integration of advanced chromatography software ensures strict electronic signature compliance, which lowers regulatory audit discrepancies by 30%. Furthermore, upgrading hardware for precise monoclonal antibody characterization accelerates biotherapeutic development cycles. These measurable improvements underscore the critical role of sophisticated analytical infrastructure in achieving sustained operational efficiency and maintaining strict regulatory alignment.
We can help! Our analysts can customize this us analytical instrument market research report to meet your requirements.
 RIA -

