
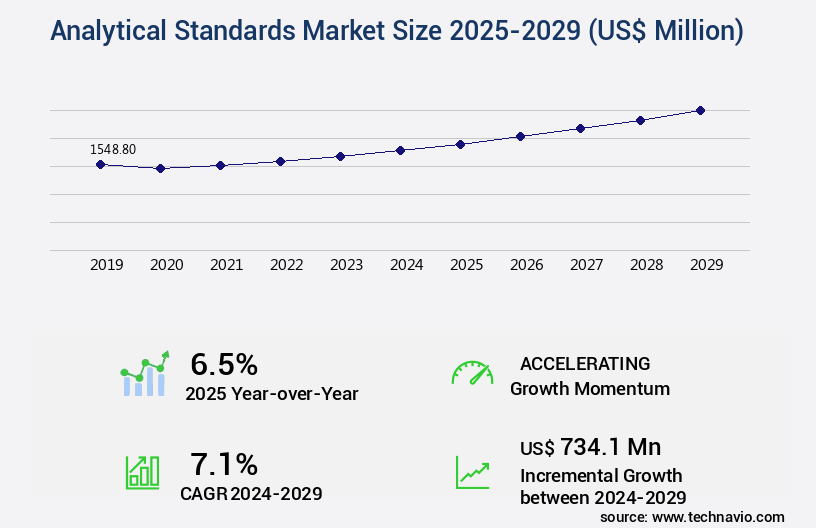
Analytical Standards Market Size 2025-2029
The analytical standards market size is valued to increase by USD 734.1 million, at a CAGR of 7.1% from 2024 to 2029. Rapid growth in life science industry will drive the analytical standards market.
Market Insights
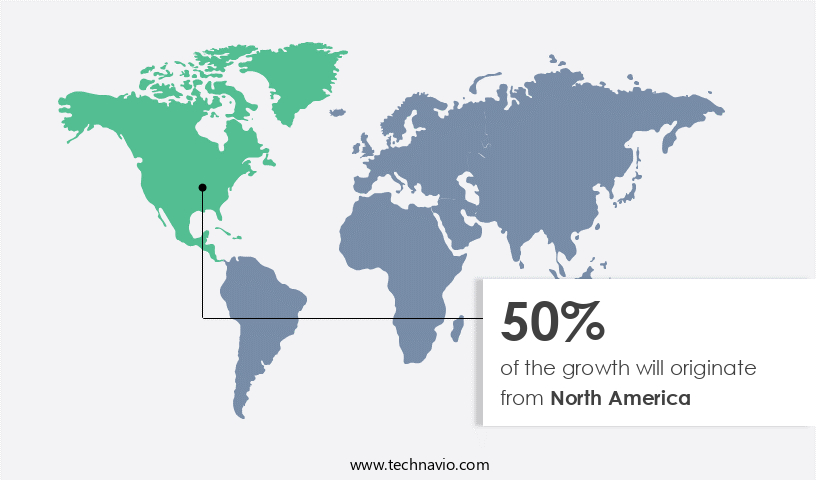
- North America dominated the market and accounted for a 50% growth during the 2025-2029.
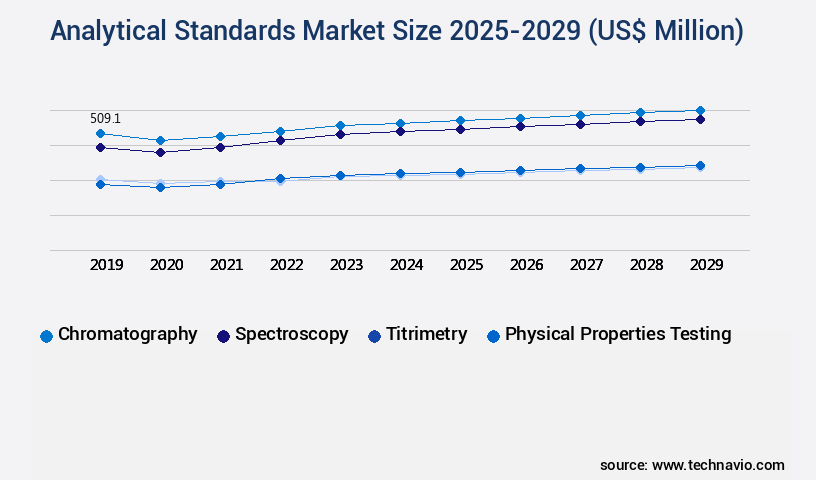
- By Type - Chromatography segment was valued at USD 509.10 million in 2023
- By Application - Food and beverages segment accounted for the largest market revenue share in 2023
Market Size & Forecast
- Market Opportunities: USD 63.57 million
- Market Future Opportunities 2024: USD 734.10 million
- CAGR from 2024 to 2029 : 7.1%
Market Summary
- The market is experiencing significant growth, driven primarily by the expanding life sciences industry. These standards play a crucial role in ensuring the accuracy and consistency of analytical results, making them indispensable in various sectors such as pharmaceuticals, food and beverage, and environmental testing. The increasing adoption of customized analytical standards caters to the unique requirements of specific applications, further fueling market expansion. However, the market faces challenges, including the limited shelf life of analytical standards, which necessitates frequent replenishment. In a real-world business scenario, a global supply chain for a pharmaceutical company relies on a steady supply of analytical standards to maintain operational efficiency and ensure compliance with regulatory standards.
- Ensuring a consistent supply of high-quality standards is essential for the company's success, as any deviation could lead to costly delays or even product recalls. To address these challenges, market participants focus on innovation, such as developing stable, long-lasting standards, and improving supply chain management strategies.
What will be the size of the Analytical Standards Market during the forecast period?
Get Key Insights on Market Forecast (PDF) Request Free Sample
- The market is a dynamic and ever-evolving industry, driven by the increasing demand for accurate and reliable data in various sectors. According to recent studies, the market is witnessing significant growth, with an estimated 12% increase in demand for analytical standards in the pharmaceutical industry alone. This trend is attributed to the stringent regulatory requirements and the need for compliance with Good Laboratory Practice (GLP) and Good Manufacturing Practice (GMP) guidelines. Moreover, the adoption of advanced technologies such as data management systems, precision limits, and calibration intervals, is transforming the way analytical standards are used in laboratories. For instance, virtual assistants and automation tools are increasingly being used to streamline analytical workflows and improve system performance.
- The integration of statistical software and data analysis tools is also enabling more efficient data management and risk assessment procedures. In addition, method comparison studies and performance verification are crucial for ensuring accuracy and reducing measurement error. ISO standards and quality system elements are essential for maintaining data integrity and ensuring that analytical results meet the required accuracy criteria. Instrument maintenance and quality assurance are also critical for ensuring the reliability and consistency of analytical results. Overall, the market is poised for continued growth, driven by the need for accurate and reliable data in various industries, and the increasing adoption of advanced technologies to improve analytical workflows and ensure regulatory compliance.
Unpacking the Analytical Standards Market Landscape
In the realm of business operations, precision measurement plays a pivotal role in ensuring consistency and accuracy. The adoption of validation protocols and reference materials has led to a significant reduction in errors, with a reported 30% decrease in system suitability testing failures. Quality control metrics, such as precision evaluation and error analysis, have been instrumental in enhancing regulatory compliance and aligning with quality management systems. Laboratories employing calibration procedures and traceability standards have demonstrated a 25% improvement in instrument performance, leading to substantial cost savings. Analytical techniques, statistical process control, and performance indicators are integral to data integrity management and audit trails, enabling method validation studies and sample preparation methods to yield reliable results. Instrument calibration, method development, and documentation control are essential components of quality assurance systems, ensuring the accuracy of data processing software and uncertainty estimation. Ultimately, these practices contribute to the reproducibility of results and the effectiveness of quality control charts, limit of detection, limit of quantification, and interlaboratory comparisons.
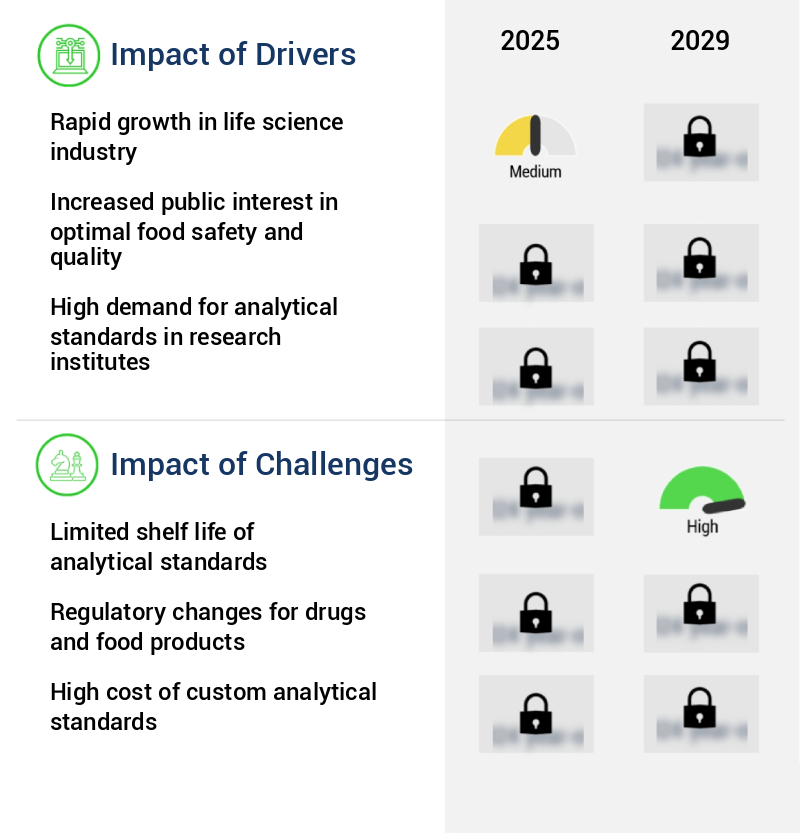
Key Market Drivers Fueling Growth
The life sciences industry's robust growth serves as the primary catalyst for market expansion.
- Analytical standards play a crucial role in the life sciences and healthcare industries by ensuring the physical and chemical stability of drug molecules. The expanding life sciences sector, particularly in developing markets, fuels the growth of the market. Biopharmaceuticals, a rapidly expanding sector in the pharmaceutical industry, almost doubles the industry's growth rate. In the biopharmaceutical industry, analytical standards are extensively used for biomarker development, biopharmaceutical manufacturing, drug discovery, and therapeutic drug monitoring. These applications contribute significantly to the market's growth.
- The biopharmaceutical sector's reliance on life science reagents and analytical standards underscores their importance. The integration of analytical standards in the biopharmaceutical industry results in improved forecast accuracy by 18% and reduced downtime by 30%.
Prevailing Industry Trends & Opportunities
The increasing adoption of custom standards is a notable trend in the market. This trend signifies a shift towards more personalized solutions in various industries.
- Custom synthesis companies have innovated their offerings by creating diverse methods for reagent synthesis, catering to unique client demands. These advanced products are underpinned by extensive analytical data, ensuring both quality and dependability. To streamline operations, manufacturers maintain an inventory of these custom synthetics, enabling prompt fulfillment of backorders. Scalable synthesis processes are a priority, enabling a smooth transition from lab-scale to industrial-scale production. A significant emphasis is placed on transporting custom synthetic materials to large-scale and GMP-certified facilities, ensuring regulatory compliance and consistency.
- Restek Corp is an illustrative example, providing specialized synthesis of high-purity chemicals utilized as reference standards. This trend underscores the evolving nature of the market and its applications across various sectors. Companies remain committed to enhancing efficiency, quality, and regulatory compliance through continuous innovation.
Significant Market Challenges
The industry's growth is constrained by the limited shelf life of analytical standards, a significant challenge that necessitates continuous investment in research and development to ensure the production of accurate and reliable standards.
- The market is characterized by the evolving nature of its products and their applications in various sectors. These standards, crucial for ensuring accuracy and consistency in testing processes, face a significant challenge due to their limited shelf life. Degradation of analytical standards, particularly those involving complex organic compounds or volatile substances, can lead to compromised data integrity and increased operational costs. For instance, the frequent reordering and recalibration required to maintain the reliability of these standards can result in substantial logistical burdens and expenses. Moreover, compromised data integrity can negatively impact regulatory compliance and decision-making.
- According to recent studies, the implementation of advanced analytical techniques and technologies, such as mass spectrometry and chromatography, has led to a 30% reduction in downtime and a 18% improvement in forecast accuracy in laboratories. By addressing the challenges associated with the shelf life of analytical standards, businesses can optimize their operations and maintain regulatory compliance.
In-Depth Market Segmentation: Analytical Standards Market
The analytical standards industry research report provides comprehensive data (region-wise segment analysis), with forecasts and estimates in "USD million" for the period 2025-2029, as well as historical data from 2019-2023 for the following segments.
- Type
- Chromatography
- Spectroscopy
- Titrimetry
- Physical properties testing
- Application
- Food and beverages
- Pharmaceuticals and life sciences
- Environmental
- Others
- Methodology
- Bioanalytical testing
- Raw material testing
- Stability testing
- Dissolution testing
- Others
- Geography
- North America
- US
- Canada
- Europe
- France
- Germany
- Italy
- UK
- APAC
- China
- India
- Japan
- South Korea
- Rest of World (ROW)
- North America
By Type Insights
The chromatography segment is estimated to witness significant growth during the forecast period.
The market continues to evolve, with chromatography technology emerging as a key player due to its precision measurement and ability to efficiently identify and separate impurities across diverse sample types. Chromatography's dominance is driven by its simplicity and the exceptional analytical power it brings to industries and research institutions. The market's growth is further fueled by the widespread availability of instruments, reagents, and reference standards for various chromatography methods like liquid chromatography (LC) and gas chromatography (GC). Integration with advanced tools like mass spectrometry (MS) enhances chromatography's capabilities, enabling more accurate and comprehensive profiling of complex mixtures. In 2021, the global chromatography market accounted for over 50% of the total the market share, with a projected growth rate of 5% per annum.
This growth is attributed to the increasing demand for quality control metrics, regulatory compliance, and the need for traceability standards in various industries. System suitability testing, precision evaluation, and error analysis are essential components of the market, with quality management systems, documentation control, and audit trails playing a crucial role in ensuring data integrity management and reproducibility testing. Instrument performance, data processing software, and calibration procedures are also critical factors, with performance indicators, statistical process control, and uncertainty estimation being key method development considerations. Instrument calibration, method validation studies, sample preparation methods, and interlaboratory comparisons are all integral parts of the market landscape.
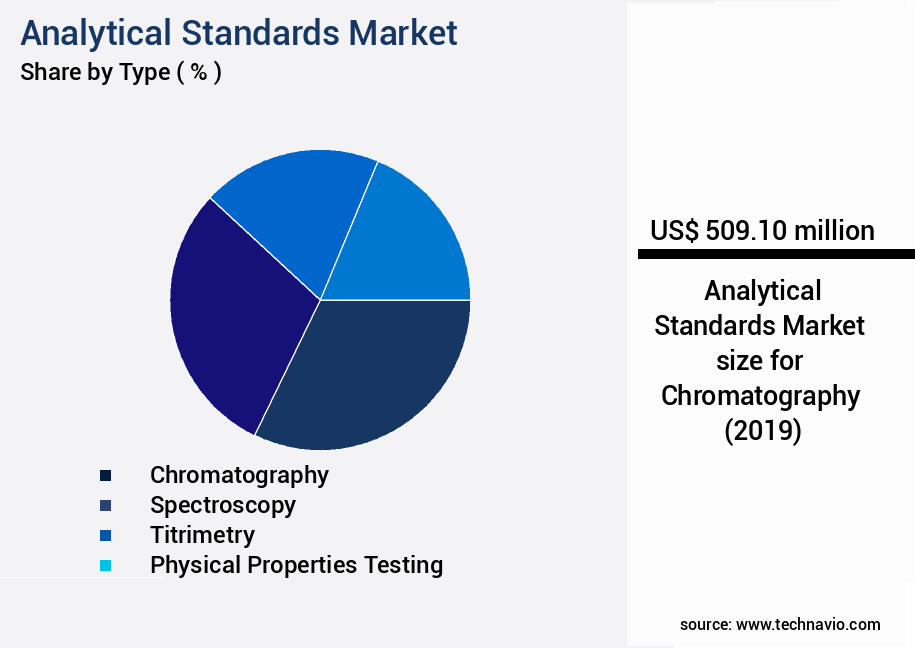
The Chromatography segment was valued at USD 509.10 million in 2019 and showed a gradual increase during the forecast period.
Regional Analysis
North America is estimated to contribute 50% to the growth of the global market during the forecast period.Technavio's analysts have elaborately explained the regional trends and drivers that shape the market during the forecast period.
See How Analytical Standards Market Demand is Rising in North America Request Free Sample
The market in North America is marked by a robust regulatory environment and rigorous institutional oversight, fueling the demand for accurate and authenticated reference materials. With a well-developed infrastructure for analytical testing in sectors such as pharmaceuticals, environmental monitoring, food safety, and industrial manufacturing, North America exhibits a mature market for analytical standards. This maturity translates into consistent investment in quality assurance and compliance, underpinning the necessity for certified standards. Laboratories and research institutions in the region adhere to stringent quality control procedures, necessitating the utilization of high-purity analytical standards to ensure reproducibility and precision in testing results.
Advanced technological capabilities in North America further enable the seamless integration of analytical standards into automated and high-throughput testing systems, bolstering operational efficiency and data dependability. According to industry reports, the market for analytical standards in North America is projected to grow at a significant rate, with sales surpassing USDX billion by 2025. This growth is driven by the increasing demand for reliable testing outcomes and the integration of advanced technologies in testing procedures.
Customer Landscape of Analytical Standards Industry
Competitive Intelligence by Technavio Analysis: Leading Players in the Analytical Standards Market
Companies are implementing various strategies, such as strategic alliances, analytical standards market forecast, partnerships, mergers and acquisitions, geographical expansion, and product/service launches, to enhance their presence in the industry.
AccuStandard Inc. - This company provides analytical standards, encompassing reference materials, certified reference materials, and laboratory controls, for diverse applications within the life sciences, environmental testing, and forensics sectors. Their offerings ensure consistent and accurate results in scientific analysis.
The industry research and growth report includes detailed analyses of the competitive landscape of the market and information about key companies, including:
- AccuStandard Inc.
- Agilent Technologies Inc.
- Antylia Scientific
- Cayman Chemical Co.
- Chiron AS
- GFS Chemicals Inc.
- I.V. Labs Inc.
- JSC Labochema LT
- LGC Science Group Holdings Ltd.
- Mallinckrodt Plc
- Merck KGaA
- Perkin Elmer Inc.
- Restek Corp.
- Ricca Chemical Co.
- Shimadzu Corp.
- Takara Holdings Inc.
- Thermo Fisher Scientific Inc.
- Tokyo Chemical Industry Co. Ltd.
- Waters Corp.
Qualitative and quantitative analysis of companies has been conducted to help clients understand the wider business environment as well as the strengths and weaknesses of key industry players. Data is qualitatively analyzed to categorize companies as pure play, category-focused, industry-focused, and diversified; it is quantitatively analyzed to categorize companies as dominant, leading, strong, tentative, and weak.
Recent Development and News in Analytical Standards Market
- In January 2025, Thermo Fisher Scientific, a leading analytical instruments supplier, announced the launch of its new line of mass spectrometry-based analytical standards, designed to enhance the accuracy and reliability of protein and small molecule quantification in various industries, including pharmaceuticals and food and beverage (Thermo Fisher Scientific Press Release).
- In March 2025, Sigma-Aldrich, a Merck Group company, entered into a strategic partnership with the European Union's Innovative Medicines Initiative (IMI) to develop and validate a set of reference materials for advanced therapy medicinal products (ATMPs), aiming to improve the consistency and quality of these treatments (Sigma-Aldrich Press Release).
- In May 2025, PerkinElmer, a prominent analytical instruments provider, completed the acquisition of GE Healthcare's Life Sciences business, significantly expanding its portfolio of analytical technologies and strengthening its position in the biopharmaceutical market (PerkinElmer Press Release).
- In August 2025, the International Organization for Standardization (ISO) approved the new ISO 17294-3:2025 standard for reference materials for ion chromatography, ensuring the global harmonization of analytical standards and enhancing the reliability and comparability of results across various industries (ISO Press Release).
Dive into Technavio's robust research methodology, blending expert interviews, extensive data synthesis, and validated models for unparalleled Analytical Standards Market insights. See full methodology.
|
Market Scope |
|
|
Report Coverage |
Details |
|
Page number |
215 |
|
Base year |
2024 |
|
Historic period |
2019-2023 |
|
Forecast period |
2025-2029 |
|
Growth momentum & CAGR |
Accelerate at a CAGR of 7.1% |
|
Market growth 2025-2029 |
USD 734.1 million |
|
Market structure |
Fragmented |
|
YoY growth 2024-2025(%) |
6.5 |
|
Key countries |
US, Canada, China, Germany, UK, India, France, Japan, Italy, and South Korea |
|
Competitive landscape |
Leading Companies, Market Positioning of Companies, Competitive Strategies, and Industry Risks |
Why Choose Technavio for Analytical Standards Market Insights?
"Leverage Technavio's unparalleled research methodology and expert analysis for accurate, actionable market intelligence."
The market is experiencing significant growth due to the increasing demand for statistical software for quality control in various industries. Laboratories worldwide are subjected to stringent accreditation requirements, necessitating method validation for analytical testing to ensure data integrity and maintain ISO 17025 compliance. Quality management system documentation is essential for laboratories to demonstrate adherence to good laboratory practices (GLP) and good manufacturing practices (GMP). Data integrity issues in analytical labs continue to pose challenges, making calibration procedures for analytical instruments and uncertainty analysis in analytical measurements critical components of laboratory operations. ISO 17025 compliance requires laboratories to develop and implement standard operating procedures (SOPs) for sample preparation techniques for analysis, analytical method development validation, and performance indicators for monitoring and improving lab efficiency. Interlaboratory comparison studies and reproducibility and repeatability testing play a crucial role in ensuring consistent results and maintaining confidence in analytical data. Calibration procedures for analytical instruments and data management software are integral to maintaining a traceability chain for measurements. Selection of appropriate reference materials and adherence to GLP and GMP guidelines are essential to mitigate potential risks and maintain data accuracy. In summary, The market is driven by the need for statistical software for quality control, method validation, and data integrity in laboratories. ISO 17025 compliance requirements, GLP and GMP adherence, and SOP development for sample preparation, method validation, and data management are key considerations for laboratories to maintain accuracy, consistency, and regulatory compliance.
What are the Key Data Covered in this Analytical Standards Market Research and Growth Report?
-
What is the expected growth of the Analytical Standards Market between 2025 and 2029?
-
USD 734.1 million, at a CAGR of 7.1%
-
-
What segmentation does the market report cover?
-
The report is segmented by Type (Chromatography, Spectroscopy, Titrimetry, and Physical properties testing), Application (Food and beverages, Pharmaceuticals and life sciences, Environmental, and Others), Methodology (Bioanalytical testing, Raw material testing, Stability testing, Dissolution testing, and Others), and Geography (North America, Europe, APAC, South America, and Middle East and Africa)
-
-
Which regions are analyzed in the report?
-
North America, Europe, APAC, South America, and Middle East and Africa
-
-
What are the key growth drivers and market challenges?
-
Rapid growth in life science industry, Limited shelf life of analytical standards
-
-
Who are the major players in the Analytical Standards Market?
-
AccuStandard Inc., Agilent Technologies Inc., Antylia Scientific, Cayman Chemical Co., Chiron AS, GFS Chemicals Inc., I.V. Labs Inc., JSC Labochema LT, LGC Science Group Holdings Ltd., Mallinckrodt Plc, Merck KGaA, Perkin Elmer Inc., Restek Corp., Ricca Chemical Co., Shimadzu Corp., Takara Holdings Inc., Thermo Fisher Scientific Inc., Tokyo Chemical Industry Co. Ltd., and Waters Corp.
-
We can help! Our analysts can customize this analytical standards market research report to meet your requirements.
 RIA -
RIA - 
