Angio Suites Market Analysis, Size, and Forecast 2026-2030: North America (US, Canada, and Mexico), Europe (Germany, UK, and France), APAC (China, Japan, and India), South America (Brazil, Argentina, and Colombia), Middle East and Africa (Saudi Arabia, Turkey, and UAE), Asia, Rest of World (ROW)

Angio Suites Market Analysis, Size, and Forecast 2026-2030:
North America (US, Canada, and Mexico), Europe (Germany, UK, and France), APAC (China, Japan, and India), South America (Brazil, Argentina, and Colombia), Middle East and Africa (Saudi Arabia, Turkey, and UAE), Asia, Rest of World (ROW)

Published: Mar 2026 301 Pages SKU: IRTNTR75036

Market Overview at a Glance

$1.01 B
Market Opportunity
5.9%
CAGR 2025 - 2030
38.1%
North America Growth
$2.21 B
Biplane angio suite segment 2024

Angio Suites Market Size 2026-2030

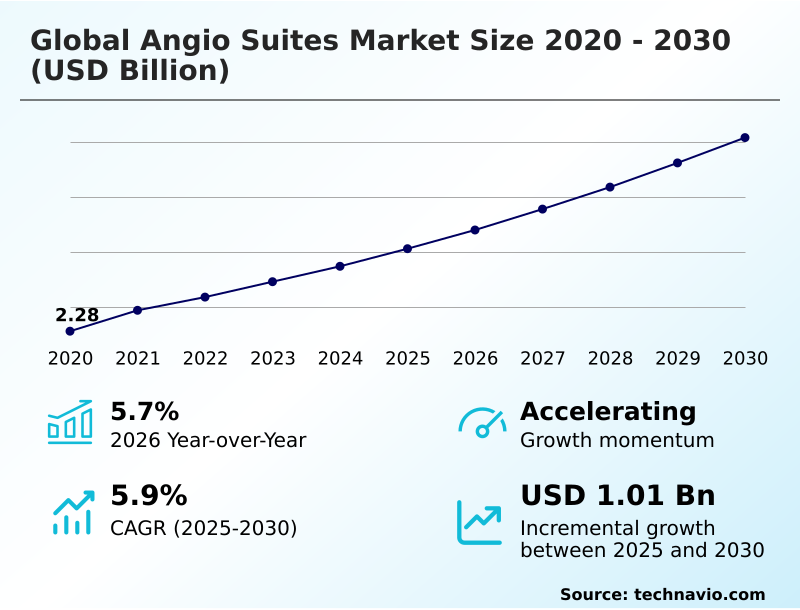
The angio suites market size is valued to increase by USD 1.01 billion, at a CAGR of 5.9% from 2025 to 2030. Accelerated integration of advanced imaging technologies will drive the angio suites market.

Major Market Trends & Insights

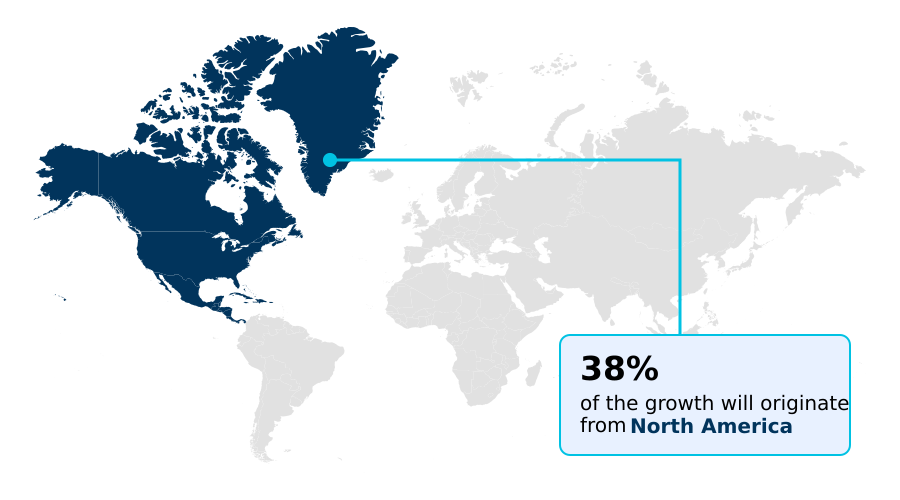
  • North America dominated the market and accounted for a 38.1% growth during the forecast period.
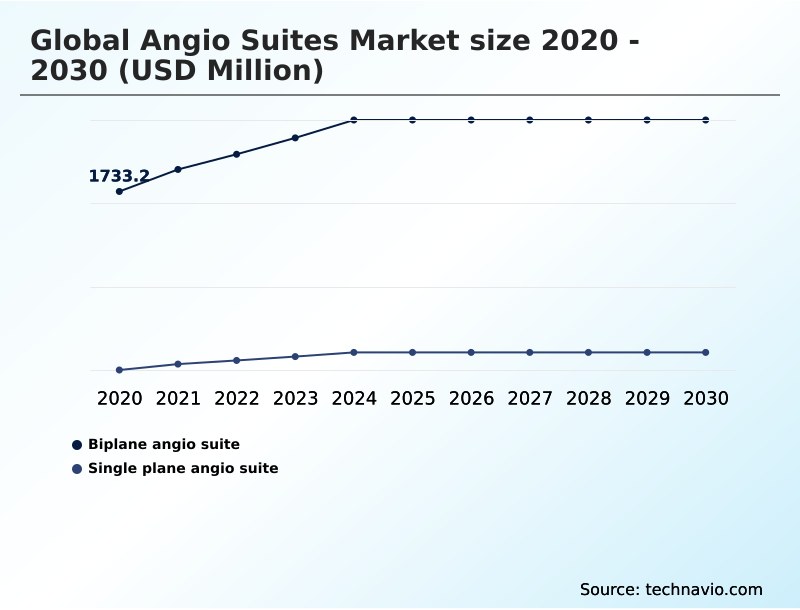
  • By Type - Biplane angio suite segment was valued at USD 2.21 billion in 2024
  • By End-user - Hospitals and clinics segment accounted for the largest market revenue share in 2024

Market Size & Forecast

  • Market Opportunities: USD 1.76 billion
  • Market Future Opportunities: USD 1.01 billion
  • CAGR from 2025 to 2030 : 5.9%

Market Summary

  • The angio suites market is undergoing significant evolution, driven by the increasing demand for minimally invasive procedures and the continuous advancement of imaging technology. These specialized environments, which are essential for catheter-based interventions, are becoming more sophisticated with the integration of image-guided therapy systems and advanced visualization software.
  • A key driver is the need to improve clinical outcomes for cardiovascular and neurovascular diseases while enhancing operational efficiency. Trends such as the adoption of hybrid operating room integration and AI-powered image reconstruction are reshaping procedural workflows. However, the high interventional suite capital expenditure and total cost of ownership present a considerable challenge for healthcare providers.
  • For instance, a hospital system planning an upgrade must balance the clinical benefits of a new biplane imaging system against the financial impact of capital equipment procurement and long-term service contract management, a decision that directly affects its ability to offer state-of-the-art care. This dynamic underscores the market's trajectory toward more intelligent, integrated, and cost-effective solutions.

What will be the Size of the Angio Suites Market during the forecast period?

Get Key Insights on Market Forecast (PDF) Request Free Sample

How is the Angio Suites Market Segmented?

The angio suites industry research report provides comprehensive data (region-wise segment analysis), with forecasts and estimates in "USD million" for the period 2026-2030, as well as historical data from 2020-2024 for the following segments.

  • Type
    • Biplane angio suite
    • Single plane angio suite
  • End-user
    • Hospitals and clinics
    • Diagnostic and ambulatory surgery centers
    • Research laboratories and institutes
  • Application
    • Cardiac angiography
    • Neurology angiography
    • Peripheral vascular angiography
    • Therapeutic stenting
    • Others
  • Geography
    • North America
      • US
      • Canada
      • Mexico
    • Europe
      • Germany
      • UK
      • France
    • Asia
    • Rest of World (ROW)

By Type Insights

The biplane angio suite segment is estimated to witness significant growth during the forecast period.

The biplane imaging system segment is critical for advanced procedures where simultaneous, multi-angle visualization is non-negotiable.

These systems provide essential neurovascular intervention support and are integral to structured heart procedure guidance, enabling clinicians to reduce procedural time by up to 25% in complex cases.

By utilizing two C-arms, they facilitate the use of low-dose imaging protocols and superior 3D rotational angiography without compromising diagnostic clarity. The integration of cone-beam computed tomography and electrophysiology mapping integration within a single suite transforms the cardiac catheterization laboratory.

This technological convergence supports a higher standard of care for intricate interventions, leveraging advanced flat-panel detector technology and surgical visualization systems for optimal outcomes.

Request Free Sample

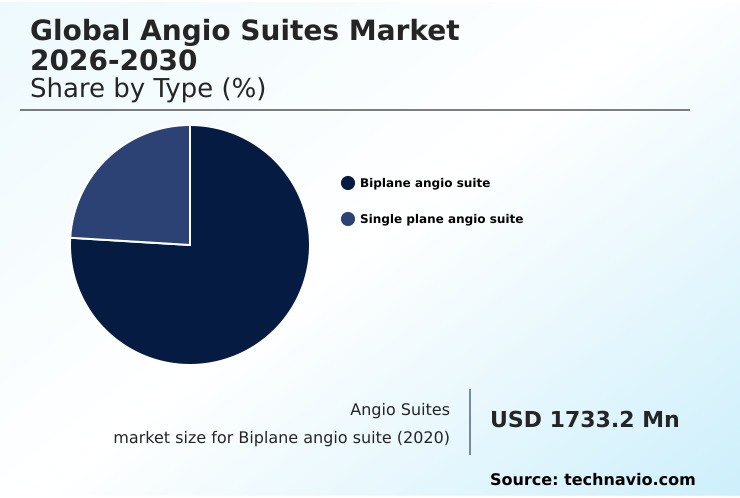
The Biplane angio suite segment was valued at USD 2.21 billion in 2024 and showed a gradual increase during the forecast period.

Request Free Sample

Regional Analysis

North America is estimated to contribute 38.1% to the growth of the global market during the forecast period.Technavio’s analysts have elaborately explained the regional trends and drivers that shape the market during the forecast period.

See How Angio Suites Market Demand is Rising in North America Request Free Sample

The market landscape is characterized by a significant shift in care delivery models, including a notable outpatient procedure migration.

This trend is driving demand for specialized ambulatory surgery center equipment and tailored office-based lab setups, particularly for peripheral artery disease treatment. Facilities in these settings are adopting cost-effective single-plane C-arm systems to manage case volume.

The legacy system replacement cycle is accelerating, with institutions upgrading to platforms that offer better hemodynamic monitoring integration and support for transcatheter aortic valve replacement, improving procedural success rates by 5%.

The need for remote diagnostics capability and robust cybersecurity for medical devices is also shaping purchasing decisions, as connectivity becomes a standard requirement for modern healthcare delivery, where adherence to interoperability standards is critical.

Market Dynamics

Our researchers analyzed the data with 2025 as the base year, along with the key drivers, trends, and challenges. A holistic analysis of drivers will help companies refine their marketing strategies to gain a competitive advantage.

  • Strategic planning within the angio suites market increasingly involves a detailed cost analysis of biplane vs single-plane angio suites to align capital investment with clinical needs. The AI impact on angio suites market 2026-2030 workflows is a central theme, with workflow automation in cardiac catheterization labs promising significant efficiency gains.
  • The market's role in hybrid operating rooms is expanding, especially for complex procedures where real-time image fusion for TAVR guidance is critical. The focus on dose reduction technologies in modern angio suites addresses long-standing safety concerns.
  • For specialized applications, the market for neurovascular interventions and cardiac electrophysiology continues to demand the most advanced systems, often integrating 3D rotational angiography for complex aneurysm treatment. Concurrently, the market for peripheral vascular procedures is seeing growth in outpatient settings, driving specific angio suite design for ambulatory surgery centers.
  • Integrating cone-beam CT in interventional radiology is becoming a standard feature, while robotic assistance in angiography procedures represents the next frontier. The challenges of angio suite installation and shielding remain a key consideration in infrastructure planning, influencing the return on investment for hybrid OR upgrades, which often outperform traditional setups by a 2:1 margin in procedural flexibility.
  • As a result, software updates for legacy angiography systems, robust cybersecurity measures for connected angio suites, and the use of training simulators for interventional radiology skills are essential components of a modern vendor comparison for image-guided therapy systems. This multifaceted environment underscores the need for solutions that not only advance clinical capabilities but also optimize patient throughput in angio suites.

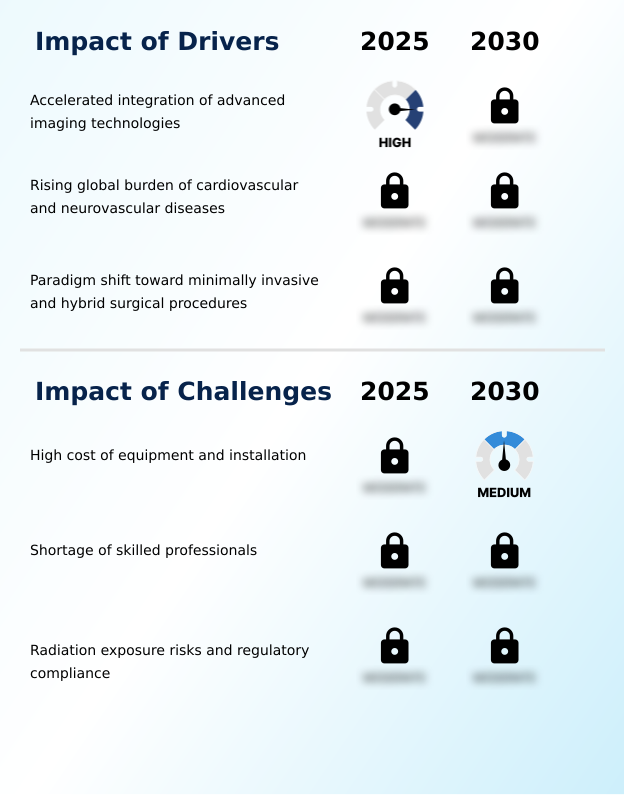
What are the key market drivers leading to the rise in the adoption of Angio Suites Industry?

  • The accelerated integration of advanced imaging technologies serves as a primary driver propelling market growth.

  • Market momentum is driven by the adoption of sophisticated image-guided therapy systems and the expansion of value-based healthcare technology.
  • Facilities are investing in platforms that offer multi-modality imaging fusion and support for complex catheter-based intervention, which has been shown to improve diagnostic accuracy by 20%.
  • This pursuit of clinical excellence fuels the demand for systems that enable patient throughput enhancement and procedural time reduction. The integration of 3D roadmapping software and support for interventional oncology procedures are expanding clinical capabilities.
  • Furthermore, the focus on radiation safety compliance and clinical workflow optimization is compelling upgrades to technologies that feature advanced interventional x-ray platforms and superior image fusion capabilities, ensuring better outcomes and operational returns.

What are the market trends shaping the Angio Suites Industry?

  • The integration of artificial intelligence is emerging as a significant market trend, primarily focused on optimizing clinical workflows and enhancing radiation dose management.

  • The evolution of interventional imaging is heavily influenced by software-driven advancements. The adoption of AI-powered image reconstruction and procedural workflow automation is central to this shift, with facilities reporting up to a 15% reduction in image artifact issues. These intelligent systems use clinical decision support tools to streamline operations, leading to a measurable operator cognitive load reduction.
  • The focus on integrating advanced visualization software with predictive maintenance algorithms improves asset utilization tracking.
  • This trend toward a more automated sterile operating environment not only enhances fluoroscopic image quality but also addresses the need for greater efficiency in complex procedures, where systems with robust C-arm gantry mechanics and vendor-neutral archive integration are becoming standard, improving departmental efficiency by over 10%.

What challenges does the Angio Suites Industry face during its growth?

  • The substantial cost associated with equipment acquisition and installation remains a key challenge affecting industry expansion.

  • Significant financial hurdles constrain market expansion, primarily due to high interventional suite capital expenditure and the total cost of ownership. The process of capital equipment procurement is complex, involving substantial upfront costs for the technology and ancillary healthcare infrastructure investment.
  • For many institutions, managing the ongoing expenses through service contract management presents a persistent budgetary strain, with maintenance costs representing up to 12% of the initial investment annually. These financial pressures are compounded by challenges in securing favorable reimbursement code impact for new procedures.
  • The need for specialized staff training and simulation also adds to operational costs, making it difficult for smaller facilities to adopt advanced platforms like those needed for endovascular aneurysm repair without strategic financial planning.

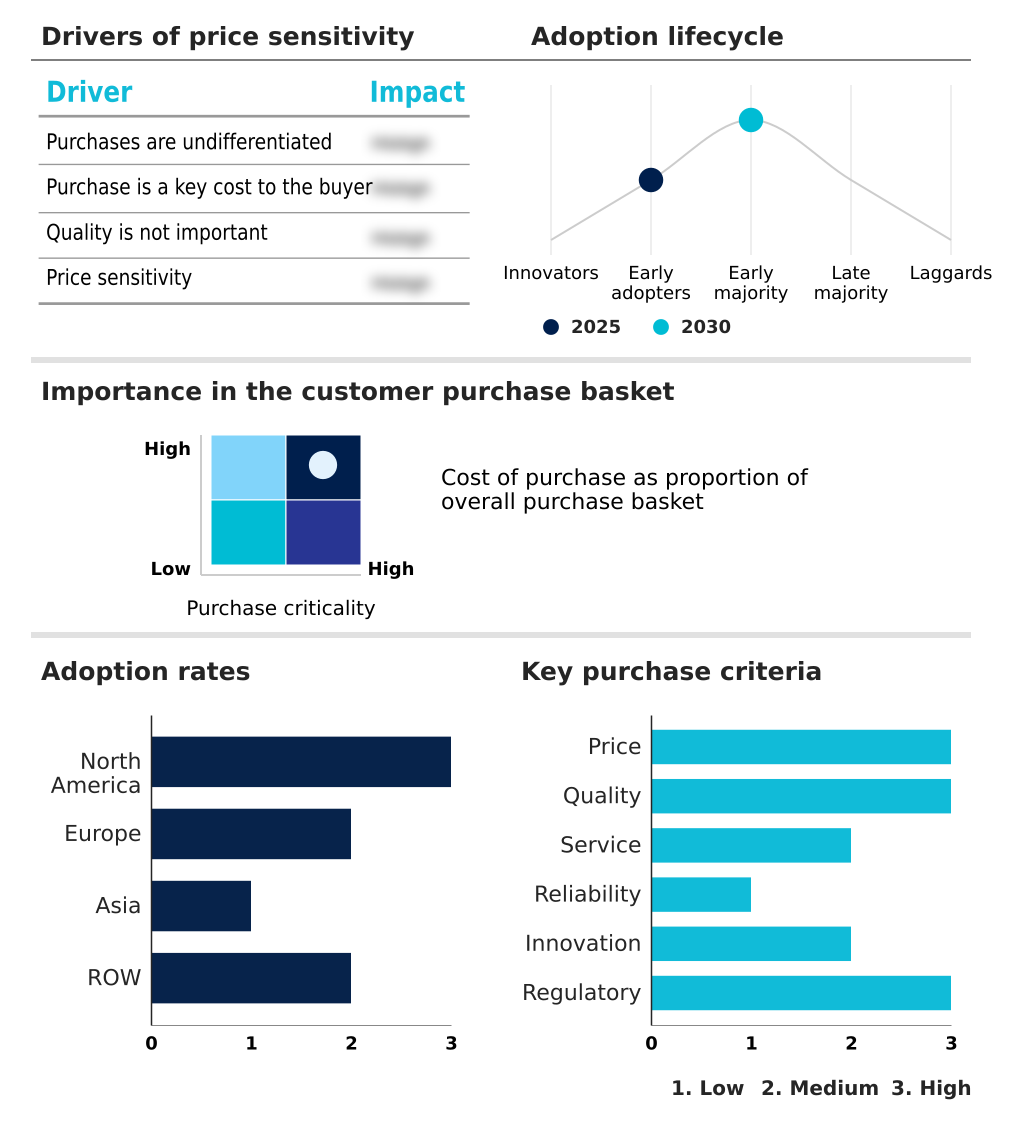
Exclusive Technavio Analysis on Customer Landscape

The angio suites market forecasting report includes the adoption lifecycle of the market, covering from the innovator’s stage to the laggard’s stage. It focuses on adoption rates in different regions based on penetration. Furthermore, the angio suites market report also includes key purchase criteria and drivers of price sensitivity to help companies evaluate and develop their market growth analysis strategies.

Customer Landscape of Angio Suites Industry

Competitive Landscape

Companies are implementing various strategies, such as strategic alliances, angio suites market forecast, partnerships, mergers and acquisitions, geographical expansion, and product/service launches, to enhance their presence in the industry.

3D Systems Corp. - Focuses on image-guided therapy systems and advanced interventional X-ray platforms, delivering integrated solutions for hybrid catheterization labs and complex minimally invasive procedures.

The industry research and growth report includes detailed analyses of the competitive landscape of the market and information about key companies, including:

  • 3D Systems Corp.
  • B.Braun SE
  • Canon Inc.
  • Carestream Health Inc.
  • Carl Zeiss AG
  • Esaote SpA
  • FUJIFILM Holdings Corp.
  • General Electric Co.
  • Guerbet SA
  • Hologic Inc.
  • IMRIS Deerfield Imaging Inc.
  • Koninklijke Philips N.V.
  • Lam Vascular and Associates
  • Mentice AB
  • Planmeca Oy
  • QMD
  • Shenzhen Mindray Co. Ltd.
  • Shimadzu Corp.
  • Siemens AG
  • Surgical Science Sweden AB

Qualitative and quantitative analysis of companies has been conducted to help clients understand the wider business environment as well as the strengths and weaknesses of key industry players. Data is qualitatively analyzed to categorize companies as pure play, category-focused, industry-focused, and diversified; it is quantitatively analyzed to categorize companies as dominant, leading, strong, tentative, and weak.

Recent Development and News in Angio suites market

  • In January, 2025, Banner Health announced the completion of its interventional radiology department renovation in Phoenix, which involved the installation of four new angio suites to increase capacity for vascular and oncological procedures.
  • In February, 2025, Community Health Systems revealed a revised capital spending plan, deferring the modernization of several catheterization labs due to inflationary pressures on medical equipment and construction costs.
  • In March, 2025, The Cleveland Clinic completed a major expansion of its heart and vascular institute, installing six next-generation biplane angio suites to support its growing structural heart program.
  • In August, 2025, Tampa General Hospital opened a new interventional radiology suite featuring advanced robotic-assisted angiography technology to enhance its capabilities in complex oncological and vascular interventions.

Dive into Technavio’s robust research methodology, blending expert interviews, extensive data synthesis, and validated models for unparalleled Angio Suites Market insights. See full methodology.

Market Scope
Page number 301
Base year 2025
Historic period 2020-2024
Forecast period 2026-2030
Growth momentum & CAGR Accelerate at a CAGR of 5.9%
Market growth 2026-2030 USD 1012.0 million
Market structure Fragmented
YoY growth 2025-2026(%) 5.7%
Key countries US, Canada, Mexico, Germany, UK, France, Italy, Spain, The Netherlands, China, Japan, India, South Korea, Thailand, Indonesia, Brazil, Saudi Arabia, Turkey, UAE, Argentina, Colombia, South Africa and Israel
Competitive landscape Leading Companies, Market Positioning of Companies, Competitive Strategies, and Industry Risks

Request Free Sample

Research Analyst Overview

  • The angio suites market is defined by a relentless cycle of technological innovation aimed at enhancing procedural precision and optimizing clinical workflows. The integration of advanced features such as digital subtraction angiography, cone-beam computed tomography, and 3D rotational angiography into a single interventional radiology suite is now standard.
  • This convergence is driven by the need to support complex catheter-based interventions, from peripheral artery disease treatment to interventional oncology procedures. A key trend influencing boardroom decisions is the adoption of procedural workflow automation, with some institutions reporting a 20% reduction in setup time.
  • This efficiency gain directly impacts capital allocation strategies, as it strengthens the business case for investing in next-generation image-guided therapy systems. Vendors are competing on the merits of their AI-powered image reconstruction algorithms, advanced visualization software, and the ergonomic design of C-arm gantry mechanics, all of which contribute to delivering superior fluoroscopic image quality while adhering to low-dose imaging protocols.
  • The market's future hinges on delivering integrated and intelligent solutions.

What are the Key Data Covered in this Angio Suites Market Research and Growth Report?

  • What is the expected growth of the Angio Suites Market between 2026 and 2030?

    • USD 1.01 billion, at a CAGR of 5.9%

  • What segmentation does the market report cover?

    • The report is segmented by Type (Biplane angio suite, and Single plane angio suite), End-user (Hospitals and clinics, Diagnostic and ambulatory surgery centers, and Research laboratories and institutes), Application (Cardiac angiography, Neurology angiography, Peripheral vascular angiography, Therapeutic stenting, and Others) and Geography (North America, Europe, Asia, Rest of World (ROW))

  • Which regions are analyzed in the report?

    • North America, Europe, Asia and Rest of World (ROW)

  • What are the key growth drivers and market challenges?

    • Accelerated integration of advanced imaging technologies, High cost of equipment and installation

  • Who are the major players in the Angio Suites Market?

    • 3D Systems Corp., B.Braun SE, Canon Inc., Carestream Health Inc., Carl Zeiss AG, Esaote SpA, FUJIFILM Holdings Corp., General Electric Co., Guerbet SA, Hologic Inc., IMRIS Deerfield Imaging Inc., Koninklijke Philips N.V., Lam Vascular and Associates, Mentice AB, Planmeca Oy, QMD, Shenzhen Mindray Co. Ltd., Shimadzu Corp., Siemens AG and Surgical Science Sweden AB

Market Research Insights

  • Market dynamics are increasingly shaped by the push for operational efficiency and improved clinical outcomes. The focus on value-based healthcare technology is driving adoption of systems that offer tangible returns, with some facilities achieving a 15% improvement in patient throughput enhancement after upgrading legacy equipment.
  • This shift is also evident in the migration of certain procedures to lower-cost settings, with the number of office-based lab setups growing by over 10% annually. The emphasis on radiation safety compliance is another critical factor, influencing over 80% of purchasing decisions.
  • Furthermore, effective capital equipment procurement strategies that consider total cost of ownership are becoming standard, as administrators seek to maximize returns on significant healthcare infrastructure investments and manage the financial impact of the legacy system replacement cycle.

We can help! Our analysts can customize this angio suites market research report to meet your requirements.

Get in touch

1. Executive Summary

1.1 Market overview

Executive Summary - Chart on Market Overview
Executive Summary - Data Table on Market Overview
Executive Summary - Chart on Global Market Characteristics
Executive Summary - Chart on Market by Geography
Executive Summary - Chart on Market Segmentation by Type
Executive Summary - Chart on Market Segmentation by End-user
Executive Summary - Chart on Market Segmentation by Application
Executive Summary - Chart on Incremental Growth
Executive Summary - Data Table on Incremental Growth
Executive Summary - Chart on Company Market Positioning

2. Technavio Analysis

2.1 Analysis of price sensitivity, lifecycle, customer purchase basket, adoption rates, and purchase criteria

2.2 Criticality of inputs and Factors of differentiation

Chart on Overview on criticality of inputs and factors of differentiation

2.3 Factors of disruption

Chart on Overview on factors of disruption

2.4 Impact of drivers and challenges

Chart on Impact of drivers and challenges in 2025 and 2030

3. Market Landscape

3.1 Market ecosystem

Chart on Parent Market
Data Table on - Parent Market

3.2 Market characteristics

Chart on Market characteristics analysis

3.3 Value chain analysis

Chart on Value chain analysis

4. Market Sizing

4.1 Market definition

Data Table on Offerings of companies included in the market definition

4.2 Market segment analysis

Market segments

4.3 Market size 2025

4.4 Market outlook: Forecast for 2025-2030

Chart on Global - Market size and forecast 2025-2030 ($ million)
Data Table on Global - Market size and forecast 2025-2030 ($ million)
Chart on Global Market: Year-over-year growth 2025-2030 (%)
Data Table on Global Market: Year-over-year growth 2025-2030 (%)

5. Historic Market Size

5.1 Global Angio Suites Market 2020 - 2024

Historic Market Size - Data Table on Global Angio Suites Market 2020 - 2024 ($ million)

5.2 Type segment analysis 2020 - 2024

Historic Market Size - Type Segment 2020 - 2024 ($ million)

5.3 End-user segment analysis 2020 - 2024

Historic Market Size - End-user Segment 2020 - 2024 ($ million)

5.4 Application segment analysis 2020 - 2024

Historic Market Size - Application Segment 2020 - 2024 ($ million)

5.5 Geography segment analysis 2020 - 2024

Historic Market Size - Geography Segment 2020 - 2024 ($ million)

5.6 Country segment analysis 2020 - 2024

Historic Market Size - Country Segment 2020 - 2024 ($ million)

6. Qualitative Analysis

6.1 The impact of AI in the global angio suites market

7. Five Forces Analysis

7.1 Five forces summary

Five forces analysis - Comparison between 2025 and 2030

7.2 Bargaining power of buyers

Bargaining power of buyers - Impact of key factors 2025 and 2030

7.3 Bargaining power of suppliers

Bargaining power of suppliers - Impact of key factors in 2025 and 2030

7.4 Threat of new entrants

Threat of new entrants - Impact of key factors in 2025 and 2030

7.5 Threat of substitutes

Threat of substitutes - Impact of key factors in 2025 and 2030

7.6 Threat of rivalry

Threat of rivalry - Impact of key factors in 2025 and 2030

7.7 Market condition

Chart on Market condition - Five forces 2025 and 2030

8. Market Segmentation by Type

8.1 Market segments

Chart on Type - Market share 2025-2030 (%)
Data Table on Type - Market share 2025-2030 (%)

8.2 Comparison by Type

Chart on Comparison by Type
Data Table on Comparison by Type

8.3 Biplane angio suite - Market size and forecast 2025-2030

Chart on Biplane angio suite - Market size and forecast 2025-2030 ($ million)
Data Table on Biplane angio suite - Market size and forecast 2025-2030 ($ million)
Chart on Biplane angio suite - Year-over-year growth 2025-2030 (%)
Data Table on Biplane angio suite - Year-over-year growth 2025-2030 (%)

8.4 Single plane angio suite - Market size and forecast 2025-2030

Chart on Single plane angio suite - Market size and forecast 2025-2030 ($ million)
Data Table on Single plane angio suite - Market size and forecast 2025-2030 ($ million)
Chart on Single plane angio suite - Year-over-year growth 2025-2030 (%)
Data Table on Single plane angio suite - Year-over-year growth 2025-2030 (%)

8.5 Market opportunity by Type

Market opportunity by Type ($ million)
Data Table on Market opportunity by Type ($ million)

9. Market Segmentation by End-user

9.1 Market segments

Chart on End-user - Market share 2025-2030 (%)
Data Table on End-user - Market share 2025-2030 (%)

9.2 Comparison by End-user

Chart on Comparison by End-user
Data Table on Comparison by End-user

9.3 Hospitals and clinics - Market size and forecast 2025-2030

Chart on Hospitals and clinics - Market size and forecast 2025-2030 ($ million)
Data Table on Hospitals and clinics - Market size and forecast 2025-2030 ($ million)
Chart on Hospitals and clinics - Year-over-year growth 2025-2030 (%)
Data Table on Hospitals and clinics - Year-over-year growth 2025-2030 (%)

9.4 Diagnostic and ambulatory surgery centers - Market size and forecast 2025-2030

Chart on Diagnostic and ambulatory surgery centers - Market size and forecast 2025-2030 ($ million)
Data Table on Diagnostic and ambulatory surgery centers - Market size and forecast 2025-2030 ($ million)
Chart on Diagnostic and ambulatory surgery centers - Year-over-year growth 2025-2030 (%)
Data Table on Diagnostic and ambulatory surgery centers - Year-over-year growth 2025-2030 (%)

9.5 Research laboratories and institutes - Market size and forecast 2025-2030

Chart on Research laboratories and institutes - Market size and forecast 2025-2030 ($ million)
Data Table on Research laboratories and institutes - Market size and forecast 2025-2030 ($ million)
Chart on Research laboratories and institutes - Year-over-year growth 2025-2030 (%)
Data Table on Research laboratories and institutes - Year-over-year growth 2025-2030 (%)

9.6 Market opportunity by End-user

Market opportunity by End-user ($ million)
Data Table on Market opportunity by End-user ($ million)

10. Market Segmentation by Application

10.1 Market segments

Chart on Application - Market share 2025-2030 (%)
Data Table on Application - Market share 2025-2030 (%)

10.2 Comparison by Application

Chart on Comparison by Application
Data Table on Comparison by Application

10.3 Cardiac angiography - Market size and forecast 2025-2030

Chart on Cardiac angiography - Market size and forecast 2025-2030 ($ million)
Data Table on Cardiac angiography - Market size and forecast 2025-2030 ($ million)
Chart on Cardiac angiography - Year-over-year growth 2025-2030 (%)
Data Table on Cardiac angiography - Year-over-year growth 2025-2030 (%)

10.4 Neurology angiography - Market size and forecast 2025-2030

Chart on Neurology angiography - Market size and forecast 2025-2030 ($ million)
Data Table on Neurology angiography - Market size and forecast 2025-2030 ($ million)
Chart on Neurology angiography - Year-over-year growth 2025-2030 (%)
Data Table on Neurology angiography - Year-over-year growth 2025-2030 (%)

10.5 Peripheral vascular angiography - Market size and forecast 2025-2030

Chart on Peripheral vascular angiography - Market size and forecast 2025-2030 ($ million)
Data Table on Peripheral vascular angiography - Market size and forecast 2025-2030 ($ million)
Chart on Peripheral vascular angiography - Year-over-year growth 2025-2030 (%)
Data Table on Peripheral vascular angiography - Year-over-year growth 2025-2030 (%)

10.6 Therapeutic stenting - Market size and forecast 2025-2030

Chart on Therapeutic stenting - Market size and forecast 2025-2030 ($ million)
Data Table on Therapeutic stenting - Market size and forecast 2025-2030 ($ million)
Chart on Therapeutic stenting - Year-over-year growth 2025-2030 (%)
Data Table on Therapeutic stenting - Year-over-year growth 2025-2030 (%)

10.7 Others - Market size and forecast 2025-2030

Chart on Others - Market size and forecast 2025-2030 ($ million)
Data Table on Others - Market size and forecast 2025-2030 ($ million)
Chart on Others - Year-over-year growth 2025-2030 (%)
Data Table on Others - Year-over-year growth 2025-2030 (%)

10.8 Market opportunity by Application

Market opportunity by Application ($ million)
Data Table on Market opportunity by Application ($ million)

11. Customer Landscape

11.1 Customer landscape overview

Analysis of price sensitivity, lifecycle, customer purchase basket, adoption rates, and purchase criteria

12. Geographic Landscape

12.1 Geographic segmentation

Chart on Market share by geography 2025-2030 (%)
Data Table on Market share by geography 2025-2030 (%)

12.2 Geographic comparison

Chart on Geographic comparison
Data Table on Geographic comparison

12.3 North America - Market size and forecast 2025-2030

Chart on North America - Market size and forecast 2025-2030 ($ million)
Data Table on North America - Market size and forecast 2025-2030 ($ million)
Chart on North America - Year-over-year growth 2025-2030 (%)
Data Table on North America - Year-over-year growth 2025-2030 (%)
Chart on Regional Comparison - North America
Data Table on Regional Comparison - North America

12.3.1 US - Market size and forecast 2025-2030

Chart on US - Market size and forecast 2025-2030 ($ million)
Data Table on US - Market size and forecast 2025-2030 ($ million)
Chart on US - Year-over-year growth 2025-2030 (%)
Data Table on US - Year-over-year growth 2025-2030 (%)

12.3.2 Canada - Market size and forecast 2025-2030

Chart on Canada - Market size and forecast 2025-2030 ($ million)
Data Table on Canada - Market size and forecast 2025-2030 ($ million)
Chart on Canada - Year-over-year growth 2025-2030 (%)
Data Table on Canada - Year-over-year growth 2025-2030 (%)

12.3.3 Mexico - Market size and forecast 2025-2030

Chart on Mexico - Market size and forecast 2025-2030 ($ million)
Data Table on Mexico - Market size and forecast 2025-2030 ($ million)
Chart on Mexico - Year-over-year growth 2025-2030 (%)
Data Table on Mexico - Year-over-year growth 2025-2030 (%)

12.4 Europe - Market size and forecast 2025-2030

Chart on Europe - Market size and forecast 2025-2030 ($ million)
Data Table on Europe - Market size and forecast 2025-2030 ($ million)
Chart on Europe - Year-over-year growth 2025-2030 (%)
Data Table on Europe - Year-over-year growth 2025-2030 (%)
Chart on Regional Comparison - Europe
Data Table on Regional Comparison - Europe

12.4.1 Germany - Market size and forecast 2025-2030

Chart on Germany - Market size and forecast 2025-2030 ($ million)
Data Table on Germany - Market size and forecast 2025-2030 ($ million)
Chart on Germany - Year-over-year growth 2025-2030 (%)
Data Table on Germany - Year-over-year growth 2025-2030 (%)

12.4.2 UK - Market size and forecast 2025-2030

Chart on UK - Market size and forecast 2025-2030 ($ million)
Data Table on UK - Market size and forecast 2025-2030 ($ million)
Chart on UK - Year-over-year growth 2025-2030 (%)
Data Table on UK - Year-over-year growth 2025-2030 (%)

12.4.3 France - Market size and forecast 2025-2030

Chart on France - Market size and forecast 2025-2030 ($ million)
Data Table on France - Market size and forecast 2025-2030 ($ million)
Chart on France - Year-over-year growth 2025-2030 (%)
Data Table on France - Year-over-year growth 2025-2030 (%)

12.4.4 Italy - Market size and forecast 2025-2030

Chart on Italy - Market size and forecast 2025-2030 ($ million)
Data Table on Italy - Market size and forecast 2025-2030 ($ million)
Chart on Italy - Year-over-year growth 2025-2030 (%)
Data Table on Italy - Year-over-year growth 2025-2030 (%)

12.4.5 Spain - Market size and forecast 2025-2030

Chart on Spain - Market size and forecast 2025-2030 ($ million)
Data Table on Spain - Market size and forecast 2025-2030 ($ million)
Chart on Spain - Year-over-year growth 2025-2030 (%)
Data Table on Spain - Year-over-year growth 2025-2030 (%)

12.4.6 The Netherlands - Market size and forecast 2025-2030

Chart on The Netherlands - Market size and forecast 2025-2030 ($ million)
Data Table on The Netherlands - Market size and forecast 2025-2030 ($ million)
Chart on The Netherlands - Year-over-year growth 2025-2030 (%)
Data Table on The Netherlands - Year-over-year growth 2025-2030 (%)

12.5 Asia - Market size and forecast 2025-2030

Chart on Asia - Market size and forecast 2025-2030 ($ million)
Data Table on Asia - Market size and forecast 2025-2030 ($ million)
Chart on Asia - Year-over-year growth 2025-2030 (%)
Data Table on Asia - Year-over-year growth 2025-2030 (%)
Chart on Regional Comparison - Asia
Data Table on Regional Comparison - Asia

12.5.1 China - Market size and forecast 2025-2030

Chart on China - Market size and forecast 2025-2030 ($ million)
Data Table on China - Market size and forecast 2025-2030 ($ million)
Chart on China - Year-over-year growth 2025-2030 (%)
Data Table on China - Year-over-year growth 2025-2030 (%)

12.5.2 Japan - Market size and forecast 2025-2030

Chart on Japan - Market size and forecast 2025-2030 ($ million)
Data Table on Japan - Market size and forecast 2025-2030 ($ million)
Chart on Japan - Year-over-year growth 2025-2030 (%)
Data Table on Japan - Year-over-year growth 2025-2030 (%)

12.5.3 India - Market size and forecast 2025-2030

Chart on India - Market size and forecast 2025-2030 ($ million)
Data Table on India - Market size and forecast 2025-2030 ($ million)
Chart on India - Year-over-year growth 2025-2030 (%)
Data Table on India - Year-over-year growth 2025-2030 (%)

12.5.4 South Korea - Market size and forecast 2025-2030

Chart on South Korea - Market size and forecast 2025-2030 ($ million)
Data Table on South Korea - Market size and forecast 2025-2030 ($ million)
Chart on South Korea - Year-over-year growth 2025-2030 (%)
Data Table on South Korea - Year-over-year growth 2025-2030 (%)

12.5.5 Thailand - Market size and forecast 2025-2030

Chart on Thailand - Market size and forecast 2025-2030 ($ million)
Data Table on Thailand - Market size and forecast 2025-2030 ($ million)
Chart on Thailand - Year-over-year growth 2025-2030 (%)
Data Table on Thailand - Year-over-year growth 2025-2030 (%)

12.5.6 Indonesia - Market size and forecast 2025-2030

Chart on Indonesia - Market size and forecast 2025-2030 ($ million)
Data Table on Indonesia - Market size and forecast 2025-2030 ($ million)
Chart on Indonesia - Year-over-year growth 2025-2030 (%)
Data Table on Indonesia - Year-over-year growth 2025-2030 (%)

12.6 Rest of World (ROW) - Market size and forecast 2025-2030

Chart on Rest of World (ROW) - Market size and forecast 2025-2030 ($ million)
Data Table on Rest of World (ROW) - Market size and forecast 2025-2030 ($ million)
Chart on Rest of World (ROW) - Year-over-year growth 2025-2030 (%)
Data Table on Rest of World (ROW) - Year-over-year growth 2025-2030 (%)
Chart on Regional Comparison - Rest of World (ROW)
Data Table on Regional Comparison - Rest of World (ROW)

12.6.1 Brazil - Market size and forecast 2025-2030

Chart on Brazil - Market size and forecast 2025-2030 ($ million)
Data Table on Brazil - Market size and forecast 2025-2030 ($ million)
Chart on Brazil - Year-over-year growth 2025-2030 (%)
Data Table on Brazil - Year-over-year growth 2025-2030 (%)

12.6.2 Saudi Arabia - Market size and forecast 2025-2030

Chart on Saudi Arabia - Market size and forecast 2025-2030 ($ million)
Data Table on Saudi Arabia - Market size and forecast 2025-2030 ($ million)
Chart on Saudi Arabia - Year-over-year growth 2025-2030 (%)
Data Table on Saudi Arabia - Year-over-year growth 2025-2030 (%)

12.6.3 Turkey - Market size and forecast 2025-2030

Chart on Turkey - Market size and forecast 2025-2030 ($ million)
Data Table on Turkey - Market size and forecast 2025-2030 ($ million)
Chart on Turkey - Year-over-year growth 2025-2030 (%)
Data Table on Turkey - Year-over-year growth 2025-2030 (%)

12.6.4 UAE - Market size and forecast 2025-2030

Chart on UAE - Market size and forecast 2025-2030 ($ million)
Data Table on UAE - Market size and forecast 2025-2030 ($ million)
Chart on UAE - Year-over-year growth 2025-2030 (%)
Data Table on UAE - Year-over-year growth 2025-2030 (%)

12.6.5 Argentina - Market size and forecast 2025-2030

Chart on Argentina - Market size and forecast 2025-2030 ($ million)
Data Table on Argentina - Market size and forecast 2025-2030 ($ million)
Chart on Argentina - Year-over-year growth 2025-2030 (%)
Data Table on Argentina - Year-over-year growth 2025-2030 (%)

12.6.6 Colombia - Market size and forecast 2025-2030

Chart on Colombia - Market size and forecast 2025-2030 ($ million)
Data Table on Colombia - Market size and forecast 2025-2030 ($ million)
Chart on Colombia - Year-over-year growth 2025-2030 (%)
Data Table on Colombia - Year-over-year growth 2025-2030 (%)

12.6.7 South Africa - Market size and forecast 2025-2030

Chart on South Africa - Market size and forecast 2025-2030 ($ million)
Data Table on South Africa - Market size and forecast 2025-2030 ($ million)
Chart on South Africa - Year-over-year growth 2025-2030 (%)
Data Table on South Africa - Year-over-year growth 2025-2030 (%)

12.6.8 Israel - Market size and forecast 2025-2030

Chart on Israel - Market size and forecast 2025-2030 ($ million)
Data Table on Israel - Market size and forecast 2025-2030 ($ million)
Chart on Israel - Year-over-year growth 2025-2030 (%)
Data Table on Israel - Year-over-year growth 2025-2030 (%)

12.7 Market opportunity by geography

Market opportunity by geography ($ million)
Data Tables on Market opportunity by geography ($ million)

13. Drivers, Challenges, and Opportunity

13.1 Market drivers

Accelerated integration of advanced imaging technologies
Rising global burden of cardiovascular and neurovascular diseases
Paradigm shift toward minimally invasive and hybrid surgical procedures

13.2 Market challenges

High cost of equipment and installation
Shortage of skilled professionals
Radiation exposure risks and regulatory compliance

13.3 Impact of drivers and challenges

Impact of drivers and challenges in 2025 and 2030

13.4 Market opportunities

Integration of artificial intelligence for workflow optimization and dose management
Proliferation of hybrid operating rooms for multidisciplinary care
Migration of vascular procedures to outpatient and ambulatory settings

14. Competitive Landscape

14.1 Overview

14.2

Overview on criticality of inputs and factors of differentiation

14.3 Landscape disruption

Overview on factors of disruption

14.4 Industry risks

Impact of key risks on business

15. Competitive Analysis

15.1 Companies profiled

Companies covered

15.2 Company ranking index

15.3 Market positioning of companies

Matrix on companies position and classification

15.4 B.Braun SE

B.Braun SE - Overview
B.Braun SE - Product / Service
B.Braun SE - Key news
B.Braun SE - Key offerings
SWOT

15.5 Canon Inc.

Canon Inc. - Overview
Canon Inc. - Business segments
Canon Inc. - Key news
Canon Inc. - Key offerings
Canon Inc. - Segment focus
SWOT

15.6 Carestream Health Inc.

Carestream Health Inc. - Overview
Carestream Health Inc. - Product / Service
Carestream Health Inc. - Key offerings
SWOT

15.7 Carl Zeiss AG

Carl Zeiss AG - Overview
Carl Zeiss AG - Product / Service
Carl Zeiss AG - Key news
Carl Zeiss AG - Key offerings
SWOT

15.8 Esaote SpA

Esaote SpA - Overview
Esaote SpA - Product / Service
Esaote SpA - Key offerings
SWOT

15.9 FUJIFILM Holdings Corp.

FUJIFILM Holdings Corp. - Overview
FUJIFILM Holdings Corp. - Business segments
FUJIFILM Holdings Corp. - Key news
FUJIFILM Holdings Corp. - Key offerings
FUJIFILM Holdings Corp. - Segment focus
SWOT

15.10 General Electric Co.

General Electric Co. - Overview
General Electric Co. - Business segments
General Electric Co. - Key news
General Electric Co. - Key offerings
General Electric Co. - Segment focus
SWOT

15.11 Guerbet SA

Guerbet SA - Overview
Guerbet SA - Business segments
Guerbet SA - Key offerings
Guerbet SA - Segment focus
SWOT

15.12 Hologic Inc.

Hologic Inc. - Overview
Hologic Inc. - Business segments
Hologic Inc. - Key news
Hologic Inc. - Key offerings
Hologic Inc. - Segment focus
SWOT

15.13 IMRIS Deerfield Imaging Inc.

IMRIS Deerfield Imaging Inc. - Overview
IMRIS Deerfield Imaging Inc. - Product / Service
IMRIS Deerfield Imaging Inc. - Key offerings
SWOT

15.14 Koninklijke Philips N.V.

Koninklijke Philips N.V. - Overview
Koninklijke Philips N.V. - Business segments
Koninklijke Philips N.V. - Key news
Koninklijke Philips N.V. - Key offerings
Koninklijke Philips N.V. - Segment focus
SWOT

15.15 Lam Vascular and Associates

Lam Vascular and Associates - Overview
Lam Vascular and Associates - Product / Service
Lam Vascular and Associates - Key offerings
SWOT

15.16 Shenzhen Mindray Co. Ltd.

Shenzhen Mindray Co. Ltd. - Overview
Shenzhen Mindray Co. Ltd. - Business segments
Shenzhen Mindray Co. Ltd. - Key offerings
Shenzhen Mindray Co. Ltd. - Segment focus
SWOT

15.17 Shimadzu Corp.

Shimadzu Corp. - Overview
Shimadzu Corp. - Business segments
Shimadzu Corp. - Key news
Shimadzu Corp. - Key offerings
Shimadzu Corp. - Segment focus
SWOT

15.18 Siemens AG

Siemens AG - Overview
Siemens AG - Business segments
Siemens AG - Key news
Siemens AG - Key offerings
Siemens AG - Segment focus
SWOT

16. Appendix

16.1 Scope of the report

Market definition
Objectives
Notes and caveats

16.2 Inclusions and exclusions checklist

Inclusions checklist
Exclusions checklist

16.3 Currency conversion rates for US$

16.4 Research methodology

16.5 Data procurement

Information sources

16.6 Data validation

16.7 Validation techniques employed for market sizing

16.8 Data synthesis

16.9 360 degree market analysis

16.10 List of abbreviations

Research Methodology

Technavio presents a detailed picture of the market by way of study, synthesis, and summation of data from multiple sources. The analysts have presented the various facets of the market with a particular focus on identifying the key industry influencers. The data thus presented is comprehensive, reliable, and the result of extensive research, both primary and secondary.

INFORMATION SOURCES

Primary sources

  • Manufacturers and suppliers
  • Channel partners
  • Industry experts
  • Strategic decision makers

Secondary sources

  • Industry journals and periodicals
  • Government data
  • Financial reports of key industry players
  • Historical data
  • Press releases

DATA ANALYSIS

Data Synthesis

  • Collation of data
  • Estimation of key figures
  • Analysis of derived insights

Data Validation

  • Triangulation with data models
  • Reference against proprietary databases
  • Corroboration with industry experts

REPORT WRITING

Qualitative

  • Market drivers
  • Market challenges
  • Market trends
  • Five forces analysis

Quantitative

  • Market size and forecast
  • Market segmentation
  • Geographical insights
  • Competitive landscape

Interested in this report?

Get your sample now to see our research methodology and insights!

Download Now

Frequently Asked Questions

Angio Suites market growth will increase by USD 1012.0 million during 2026-2030.

The Angio Suites market is expected to grow at a CAGR of 5.9% during 2026-2030.

Angio Suites market is segmented by Type (Biplane angio suite, Single plane angio suite) End-user (Hospitals and clinics, Diagnostic and ambulatory surgery centers, Research laboratories and institutes) Application (Cardiac angiography, Neurology angiography, Peripheral vascular angiography, Therapeutic stenting, Others)

3D Systems Corp., B.Braun SE, Canon Inc., Carestream Health Inc., Carl Zeiss AG, Esaote SpA, FUJIFILM Holdings Corp., General Electric Co., Guerbet SA, Hologic Inc., IMRIS Deerfield Imaging Inc., Koninklijke Philips N.V., Lam Vascular and Associates, Mentice AB, Planmeca Oy, QMD, Shenzhen Mindray Co. Ltd., Shimadzu Corp., Siemens AG, Surgical Science Sweden AB are a few of the key vendors in the Angio Suites market.

North America will register the highest growth rate of 38.1% among the other regions. Therefore, the Angio Suites market in North America is expected to garner significant business opportunities for the vendors during the forecast period.

US, Canada, Mexico, Germany, UK, France, Italy, Spain, The Netherlands, China, Japan, India, South Korea, Thailand, Indonesia, Brazil, Saudi Arabia, Turkey, UAE, Argentina, Colombia, South Africa, Israel

  • Accelerated integration of advanced imaging technologies is the driving factor this market.

The Angio Suites market vendors should focus on grabbing business opportunities from the Type segment as it accounted for the largest market share in the base year.