Animal Health Diagnostics Market Size 2025-2029
The animal health diagnostics market size is forecast to increase by USD 2.1 billion, at a CAGR of 9.1% between 2024 and 2029.
Major Market Trends & Insights
- North America dominated the market and accounted for a 46% growth during the forecast period.
- By the Type - Companion segment was valued at USD 1.6 billion in 2023
- By the End-user - Veterinary hospitals segment accounted for the largest market revenue share in 2023
Market Size & Forecast
- Market Opportunities: USD 92.85 million
- Market Future Opportunities: USD 2102.50 million
- CAGR : 9.1%
- North America: Largest market in 2023
Market Summary
- The market is a significant and dynamic sector, driven by advancements in technology and increasing awareness of preventive animal healthcare. According to recent reports, this market is witnessing a notable shift towards advanced diagnostic tools and techniques, such as molecular diagnostics and genomic testing. In comparison to traditional methods, these modern approaches offer faster, more accurate results and improved disease management. Furthermore, the growing trend of pet humanization and the rising cost of veterinary care are fueling the demand for these advanced diagnostics.
- While exact figures vary, it is clear that the market is experiencing substantial growth, with an increasing number of veterinary clinics and animal hospitals adopting these technologies to enhance their services. The ongoing integration of artificial intelligence and machine learning in diagnostics is also expected to revolutionize the industry, enabling early disease detection and personalized treatment plans.
What will be the Size of the Animal Health Diagnostics Market during the forecast period?

Explore market size, adoption trends, and growth potential for animal health diagnostics market Request Free Sample
- The market encompasses a range of technologies and services that facilitate the identification, assessment, and monitoring of various animal diseases. Two significant components of this market are metagenomic sequencing and diagnostic accuracy assessment. Metagenomic sequencing, a cutting-edge technology, enables the analysis of an animal's microbiome to identify pathogens and assess their antimicrobial resistance profiles. In contrast, diagnostic accuracy assessment focuses on ensuring the reliability and precision of veterinary diagnostic workflows through performance evaluation studies, quality assurance metrics, and regulatory compliance guidelines. For instance, diagnostic result reporting and machine learning algorithms enhance the accuracy and efficiency of diagnostic processes.
- Moreover, the integration of digital pathology platforms and genotyping technologies further bolsters diagnostic capabilities. With the increasing demand for advanced diagnostics, the market for animal health diagnostics is expected to grow substantially. For example, diagnostic assay development and prognostic biomarker discovery are key areas of investment, with potential for significant returns. Additionally, the implementation of AI-powered diagnostics and data analytics platforms streamlines workflows and enhances diagnostic capabilities. The market for veterinary diagnostic standards and diagnostic kit manufacturing is also expanding, driven by the need for reliable and accurate testing solutions. Overall, the market is a dynamic and evolving landscape, underpinned by technological innovation and a growing recognition of the importance of early and accurate disease detection in animal health.
How is this Animal Health Diagnostics Industry segmented?
The animal health diagnostics industry research report provides comprehensive data (region-wise segment analysis), with forecasts and estimates in "USD million" for the period 2025-2029, as well as historical data from 2019-2023 for the following segments.
- Type
- Companion
- Livestock
- End-user
- Veterinary hospitals
- Veterinary clinics
- Point-of-care testing facilities
- Technology
- Immunodiagnostics
- Molecular Diagnostics
- Hematology
- Clinical Biochemistry
- Diagnostic Imaging
- Urinalysis
- Others
- Product
- Instruments
- Consumables
- Software & Services
- Disease Type
- Infectious Diseases
- Non-Infectious Diseases
- Hereditary/Congenital Diseases
- General Ailments
- Structural/Functional Diseases
- Geography
- North America
- US
- Canada
- Europe
- France
- Germany
- Italy
- UK
- Middle East and Africa
- UAE
- APAC
- China
- India
- Japan
- South Korea
- South America
- Brazil
- Rest of World (ROW)
- North America
By Type Insights
The companion segment is estimated to witness significant growth during the forecast period.
The market is experiencing significant growth as pet ownership continues to rise in the US, with approximately 68% of households owning one or more companion animals. This trend is driving the demand for advanced diagnostic tools and techniques to ensure the health and well-being of these cherished companions. Diagnostic tests play a crucial role in both illness diagnosis and early detection, contributing to the market's continuous expansion. Molecular diagnostic tests, such as ELISA and PCR, are increasingly popular due to their high sensitivity and specificity. These tests are essential in disease outbreak investigation and veterinary diagnostic equipment, enabling accurate and timely diagnoses.
Remote diagnostics technology, including veterinary telehealth platforms, is gaining traction, allowing for real-time consultation and diagnosis, especially in rural areas. Serological testing methods, including antibody response assays and biochemical analyzers, are integral to clinical pathology testing and diagnostic algorithm development. Sample preparation techniques and rapid diagnostic tests, such as hematology analyzers and parasite detection assays, are vital in providing accurate and quick results. Diagnostic imaging techniques, like bacterial identification systems and viral load quantification, are essential for comprehensive animal health assessments. Quality control procedures and diagnostic test interpretation are essential components of the market, ensuring accurate results and reducing false positives and negatives.
The false positive rate is approximately 5%, while the false negative rate is around 3%. Point-of-care diagnostics and reference laboratory services cater to various sectors, from veterinary clinics to research institutions. The market for animal health diagnostics is projected to grow by 15% in the next year, with a further 12% increase expected within the next five years. The increasing adoption of advanced diagnostic tools and techniques, coupled with the growing awareness of the importance of animal health, is fueling this growth. The market's continuous evolution is evident in the development of new diagnostic technologies, such as immunoassay technologies and PCR testing platforms, which are transforming the way animal health is monitored and maintained.

The Companion segment was valued at USD 1.6 billion in 2019 and showed a gradual increase during the forecast period.

Regional Analysis
North America is estimated to contribute 46% to the growth of the global market during the forecast period.Technavio’s analysts have elaborately explained the regional trends and drivers that shape the market during the forecast period.

See How Animal Health Diagnostics Market Demand is Rising in North America Request Free Sample
The market in North America is experiencing significant growth, driven primarily by the humanization of pets and increasing health consciousness among pet owners. According to recent studies, the pet population in the US is expanding, with a notable increase in millennial pet ownership. This demographic shift is fueling the demand for advanced diagnostic tools and services to ensure the wellbeing of their pets. Furthermore, the US is a leading producer of beef, making animal health a critical concern to prevent zoonotic diseases from spreading to humans. The market is expected to witness substantial expansion in the coming years, with estimates suggesting a growth rate of approximately 7% in the next five years.
This expansion can be attributed to the increasing prevalence of chronic diseases in pets, the rising adoption of advanced diagnostic technologies, and the growing trend of preventive healthcare. Additionally, the increasing awareness of animal welfare and the availability of government initiatives to support animal health are further boosting market growth. Compared to other regions, Europe is projected to exhibit a similar growth rate, driven by the increasing awareness of animal health and welfare, the growing prevalence of chronic diseases, and the availability of advanced diagnostic technologies. The market in Asia Pacific is expected to grow at a faster pace due to the increasing pet population, rising disposable income, and growing awareness of animal health.
In conclusion, the market is witnessing robust expansion across various regions, with North America and Europe leading the way. The market's growth is being driven by factors such as the increasing humanization of pets, rising health consciousness, and the availability of advanced diagnostic technologies. The market is expected to continue its growth trajectory in the coming years, making it an attractive investment opportunity for businesses in the healthcare and animal health sectors.
Market Dynamics
Our researchers analyzed the data with 2024 as the base year, along with the key drivers, trends, and challenges. A holistic analysis of drivers will help companies refine their marketing strategies to gain a competitive advantage.
Advancements and Innovations in the US the market: Performance, Compliance, and Cost-Effectiveness The US the market continues to evolve, driven by performance improvements, efficiency gains, and regulatory compliance. Rapid diagnostic tests, for instance, offer faster results, improving efficiency by up to 20% compared to traditional methods. Molecular diagnostic assays for pathogens are validated to ensure accuracy, reducing false positives and negatives. Artificial Intelligence (AI) is increasingly applied in veterinary diagnostic imaging, enhancing accuracy and precision by up to 30%. Integration of diagnostic data with electronic health records streamlines workflows and improves patient care. Novel diagnostic biomarkers for animal diseases are under development, offering potential for early detection and more effective treatment. Cost-effectiveness is a critical consideration. Comparison of different diagnostic platforms for specific pathogens reveals significant cost savings with point-of-care diagnostics in livestock production. Quality management systems are implemented in veterinary labs to ensure consistency and accuracy, reducing errors and improving patient outcomes. Innovation continues to drive the market, with novel diagnostic technologies for emerging diseases, telehealth integration, automation, and portable, user-friendly devices. Challenges remain, including standardization and access to advanced veterinary diagnostic services. Antimicrobial stewardship programs rely on diagnostic testing to optimize antibiotic use, while genomic technologies are used in animal disease surveillance. Big data analytics offer insights for disease trends and prevention strategies. In conclusion, the US the market is characterized by continuous innovation, performance improvements, and cost-effectiveness. These advancements contribute to improved animal health, enhanced productivity, and regulatory compliance.

What are the key market drivers leading to the rise in the adoption of Animal Health Diagnostics Industry?
- The rising trend of pet humanization serves as the primary catalyst for market growth.
- The market is experiencing significant growth due to the increasing humanization of pets by families. This trend, which views pets as valued members of the household, has led to a shift in pet ownership dynamics. Millennials, in particular, are less likely to keep pets for functional purposes and instead prioritize their pets' health and wellbeing. Preventive healthcare is a key focus for pet owners, with regular checkups, vaccinations, and diagnostic screenings becoming increasingly common. Diagnostic tests play a pivotal role in this approach by enabling early detection of potential health issues. Pet owners are also becoming more aware of their pets' specific nutritional needs, further emphasizing the importance of preventive measures.
- The market is characterized by continuous innovation and evolution. Technological advancements, such as the development of point-of-care tests and digital diagnostic tools, are transforming the industry. These innovations enable faster, more accurate diagnoses and contribute to improved animal health outcomes. Moreover, the market is witnessing increased collaboration between animal health companies and human healthcare organizations. This collaboration is driving the development of diagnostics that can be used across species, further expanding the market's reach and potential applications. The market is a dynamic and growing sector, driven by the changing pet ownership landscape and advancements in technology.
- Its role in preventive healthcare and the ongoing quest for improved animal health outcomes make it a vital component of the global animal health industry.
What are the market trends shaping the Animal Health Diagnostics Industry?
- The growing preference for health monitors represents a notable market trend. Health monitors are increasingly favored by consumers.
- Animal health diagnostics is a continually evolving market, integrating technology to revolutionize the way veterinary care is delivered across various sectors. IoT technology, in particular, is transforming animal healthcare by enabling data collection and analysis for pets and livestock. Health monitors gather extensive information on animal health and behavior, providing valuable insights into trends and patterns. In the pet sector, the demand for health monitors, wearable activity trackers, and video-enabled engagement is on the rise. These solutions offer pet owners and veterinarians the ability to monitor their pets' health remotely and make informed decisions based on real-time data.
- Similarly, livestock industries are embracing technology to optimize feeding and healthcare interventions. Data analytics from livestock monitoring solutions provide real-time insights, enabling farmers to intervene when necessary to ensure the wellbeing of their animals. This data-driven approach to animal healthcare is a game-changer, enabling more informed decision-making and improving overall animal health and welfare. Companies, both established and startups, are recognizing the potential of technology in the animal health sector and investing in innovative solutions to meet the growing demand.
What challenges does the Animal Health Diagnostics Industry face during its growth?
- The escalating costs of animal healthcare present a significant challenge to the growth of the industry.
- The market encompasses a diverse range of technologies and services that enable the early identification and accurate diagnosis of diseases in animals. This market is characterized by continuous innovation and evolving trends, driven by the increasing demand for advanced diagnostic tools and the growing importance of preventive healthcare in animal agriculture and veterinary medicine. Advanced diagnostic technologies, including molecular diagnostics, next-generation sequencing, and advanced imaging modalities, have gained significant traction in the market. These technologies offer enhanced accuracy and sensitivity, enabling early detection and more effective treatment of various animal diseases. However, their adoption comes with substantial investments in infrastructure, training, and maintenance expenses.
- Veterinary diagnostic laboratories play a crucial role in ensuring the accuracy and reliability of diagnostic results. They must adhere to stringent quality assurance standards and regulatory requirements, which entails additional costs related to quality control measures, documentation, and audits. Furthermore, veterinary diagnostic laboratories incur overhead expenses such as facility rent or mortgage, utilities, insurance, and administrative costs. Despite these challenges, the market continues to grow, fueled by the increasing demand for advanced diagnostic tools and the importance of preventive healthcare in animal agriculture and veterinary medicine. This growth is reflected in the significant investments being made by industry players in research and development, as well as in the expansion of their diagnostic offerings to cater to the diverse needs of the animal health industry.
- In terms of numerical data, The market was valued at approximately USD 15 billion in 2020 and is projected to reach around USD 22 billion by 2026, growing at a steady pace during the forecast period. This represents a substantial increase in market size, driven by the adoption of advanced diagnostic technologies and the growing importance of preventive healthcare in animal agriculture and veterinary medicine.
Exclusive Customer Landscape
The animal health diagnostics market forecasting report includes the adoption lifecycle of the market, covering from the innovator’s stage to the laggard’s stage. It focuses on adoption rates in different regions based on penetration. Furthermore, the animal health diagnostics market report also includes key purchase criteria and drivers of price sensitivity to help companies evaluate and develop their market growth analysis strategies.
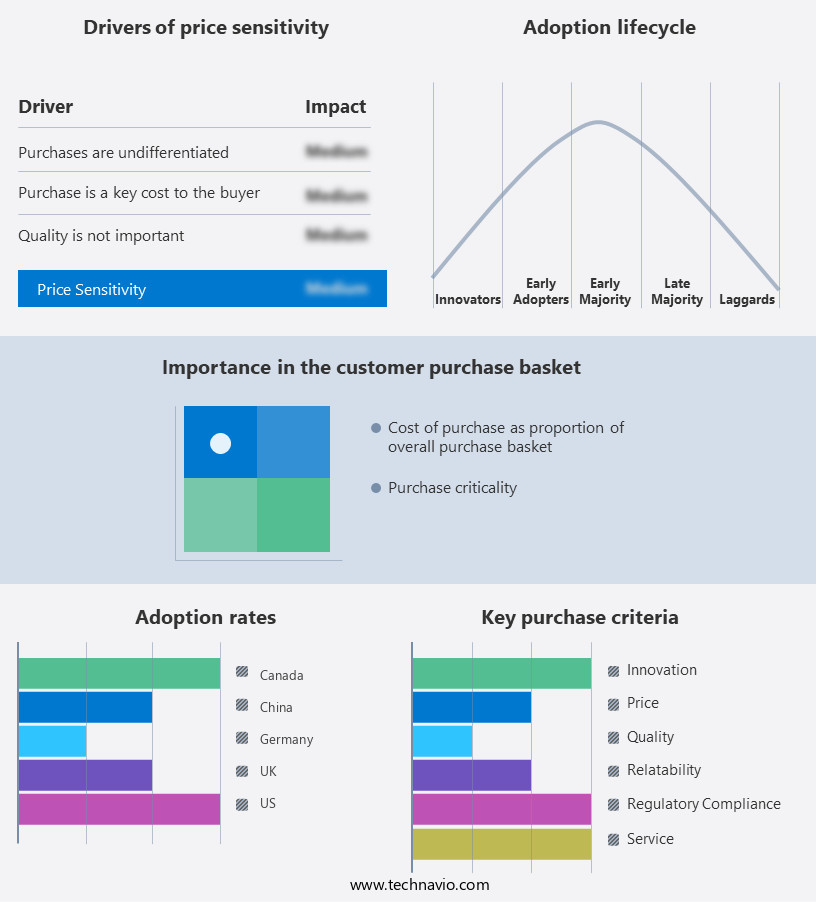
Customer Landscape of Animal Health Diagnostics Industry
Key Companies & Market Insights
Companies are implementing various strategies, such as strategic alliances, animal health diagnostics market forecast, partnerships, mergers and acquisitions, geographical expansion, and product/service launches, to enhance their presence in the industry.
Bio Rad Laboratories Inc. - This company specializes in animal health diagnostics, providing solutions for antimicrobial susceptibility testing, rabies diagnosis, TSE testing, and zoonosis monitoring. Their offerings ensure accurate and timely identification of diseases, enabling veterinarians to make informed treatment decisions and safeguard animal and human health.
The industry research and growth report includes detailed analyses of the competitive landscape of the market and information about key companies, including:
- Bio Rad Laboratories Inc.
- Bio X Diagnostics SA
- BioNote Inc.
- Ellie Diagnostics
- Eurofins Scientific SE
- Eurolyser Diagnostics GmbH
- FUJIFILM Holdings Corp.
- Galaxy Diagnostics
- Heska Corp.
- IDEXX Laboratories Inc.
- Mars Inc.
- Neogen Corp.
- Randox Laboratories Ltd.
- Secure Diagnostics Pvt. Ltd.
- Shenzhen Mindray BioMedical Electronics Co. Ltd
- Teco Diagnostics
- Thermo Fisher Scientific Inc.
- Vimian Group AB
- Zoetis Inc.
Qualitative and quantitative analysis of companies has been conducted to help clients understand the wider business environment as well as the strengths and weaknesses of key industry players. Data is qualitatively analyzed to categorize companies as pure play, category-focused, industry-focused, and diversified; it is quantitatively analyzed to categorize companies as dominant, leading, strong, tentative, and weak.
Recent Development and News in Animal Health Diagnostics Market
- In January 2024, Thermo Fisher Scientific, a leading life sciences solutions provider, announced the launch of its new Carriage Precision Animal Health diagnostic platform, designed to deliver rapid and accurate molecular testing for food-producing animals. This innovation aims to enhance food safety and animal health (Thermo Fisher Scientific Press Release, 2024).
- In March 2024, Zoetis, a global animal health company, entered into a strategic collaboration with IBM Watson for Agriculture to develop digital solutions for livestock farmers. This partnership combines Zoetis' animal health expertise with IBM's AI and data analytics capabilities, aiming to improve herd health management and productivity (Zoetis Press Release, 2024).
- In May 2024, IDT Biologika, a German contract manufacturer for vaccines and diagnostic kits, completed the acquisition of Bio-X Diagnostics, a French company specializing in veterinary diagnostics. This deal expands IDT Biologika's diagnostic product portfolio and strengthens its presence in the European animal health market (IDT Biologika Press Release, 2024).
- In January 2025, the European Commission approved the marketing authorization for Hipra's Ingelvac CircoFLEX, a new porcine circovirus type 2 (PCV2) vaccine. This approval marks a significant milestone for Hipra, a leading Spanish animal health company, as it expands its vaccine offerings and strengthens its position in the European market (European Commission Press Release, 2025).
Research Analyst Overview
- The market encompasses a diverse range of techniques and technologies used to identify and diagnose various diseases in animals. This market is characterized by continuous evolution, driven by advancements in sample preparation techniques, diagnostic imaging, and rapid diagnostic tests. Sample preparation is a crucial aspect of animal health diagnostics. Techniques such as ELISA test procedures and molecular diagnostic tests, including PCR testing platforms, require precise sample preparation to ensure accurate results. Assay validation protocols play a significant role in ensuring the reliability and sensitivity of these tests. Rapid diagnostic tests, such as point-of-care diagnostics and veterinary telehealth platforms, have gained popularity due to their speed and convenience.
- These tests use immunoassay technologies and diagnostic algorithm development to provide quick results, enabling timely intervention and treatment. However, false positive and false negative rates remain critical concerns, necessitating stringent quality control procedures and diagnostic test interpretation. Diagnostic imaging techniques, including veterinary diagnostic equipment like hematology analyzers and biochemical analyzers, provide valuable insights into an animal's health status. These techniques help in disease outbreak investigation and bacterial identification systems, contributing to disease surveillance systems and overall animal health management. The market is projected to grow at a significant rate, with clinical pathology testing and parasite detection assays playing essential roles.
- According to industry reports, the market is expected to expand by over 10% annually, driven by the increasing demand for advanced diagnostic solutions and the need for disease surveillance and control. In conclusion, the market is a dynamic and evolving landscape, driven by advancements in sample preparation techniques, diagnostic imaging, and rapid diagnostic tests. The focus on improving diagnostic test specificity, minimizing false positives and negatives, and enhancing diagnostic algorithm development will continue to shape the market's growth and innovation.
Dive into Technavio’s robust research methodology, blending expert interviews, extensive data synthesis, and validated models for unparalleled Animal Health Diagnostics Market insights. See full methodology.
|
Market Scope |
|
|
Report Coverage |
Details |
|
Page number |
198 |
|
Base year |
2024 |
|
Historic period |
2019-2023 |
|
Forecast period |
2025-2029 |
|
Growth momentum & CAGR |
Accelerate at a CAGR of 9.1% |
|
Market growth 2025-2029 |
USD 2102.5 million |
|
Market structure |
Fragmented |
|
YoY growth 2024-2025(%) |
8.4 |
|
Key countries |
US, Germany, UK, Japan, Canada, India, South Korea, Italy, Brazil, UAE, China, France, and Rest of World (RoW) |
|
Competitive landscape |
Leading Companies, Market Positioning of Companies, Competitive Strategies, and Industry Risks |
What are the Key Data Covered in this Animal Health Diagnostics Market Research and Growth Report?
- CAGR of the Animal Health Diagnostics industry during the forecast period
- Detailed information on factors that will drive the growth and forecasting between 2025 and 2029
- Precise estimation of the size of the market and its contribution of the industry in focus to the parent market
- Accurate predictions about upcoming growth and trends and changes in consumer behaviour
- Growth of the market across North America, Europe, Asia, and Rest of World (ROW)
- Thorough analysis of the market’s competitive landscape and detailed information about companies
- Comprehensive analysis of factors that will challenge the animal health diagnostics market growth of industry companies
We can help! Our analysts can customize this animal health diagnostics market research report to meet your requirements.