Animal Pregnancy Test Kit Market Size 2024-2028
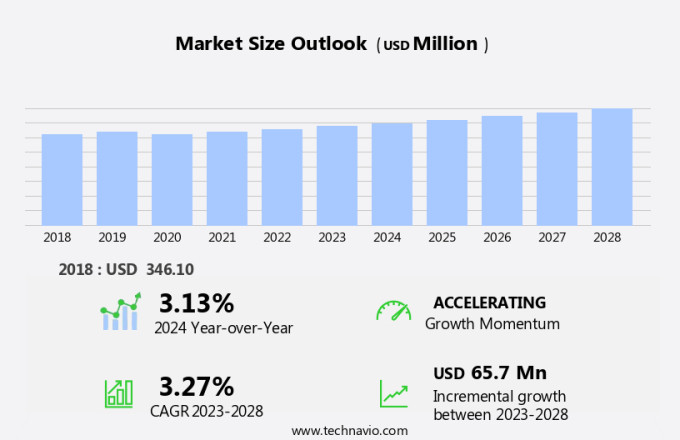
The animal pregnancy test kit market size is forecast to increase by USD 65.7 billion at a CAGR of 3.27% between 2023 and 2028.
- The market is experiencing significant growth due to several key factors. The increasing spending on veterinary care is a major driver for the market, as livestock producers seek to ensure the health and productivity of their herds. Additionally, the demand for accurate and convenient pregnancy testing methods is increasing, particularly in regions with a shortage of adequately trained veterinary doctors to perform the tests. Innovations like Veterinary Rapid Tests are further enhancing diagnostic efficiency, meeting the growing need for quick and reliable solutions. This trend is expected to continue, as animal agriculture remains a crucial industry in many parts of the world.
- However, the market also faces challenges, such as the need for affordable and user-friendly testing kits, as well as regulatory requirements for the use of certain testing methods.Overall, the market is poised for continued growth, driven by the demand for accurate and efficient testing solutions.
What will be the Size of the Animal Pregnancy Test Kit Market During the Forecast Period?
- The market is a significant segment of the larger animal diagnostics industry, catering to the reproductive health needs of various farm animals, including cattle, swine, sheep, and equines. With an increasing focus on livestock farming for food production and the welfare of animals, early pregnancy diagnosis has become a necessity for farmers and veterinarians alike. Animal population growth, artificial insemination practices, and sex-sorted semen usage have driven the demand for reliable and accurate pregnancy testing solutions. The market is influenced by factors such as the necessity of timely pregnancy outcomes for efficient livestock management, the role of veterinary services in ensuring animal health checks and vaccinations, and the impact of lockdowns and travel restrictions on the availability of diagnostic equipment and services.
- The adoption of advanced technologies, such as digital imaging and molecular diagnostics, is expected to further shape the market landscape. Overall, the market continues to play a crucial role In the livestock industry, contributing to food production, animal welfare, and overall reproductive health.
How is this Animal Pregnancy Test Kit Industry segmented and which is the largest segment?
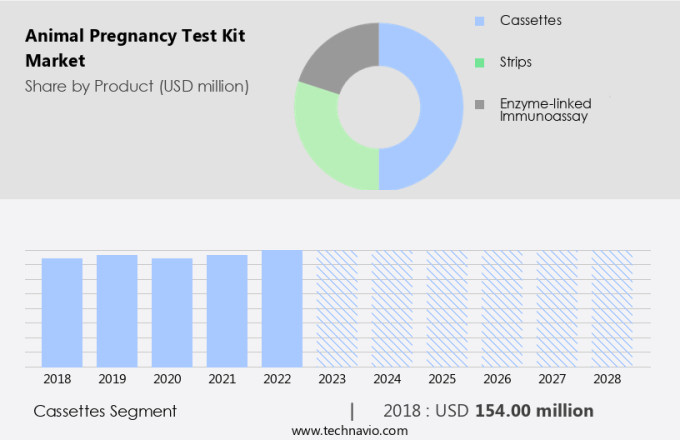
The animal pregnancy test kit industry research report provides comprehensive data (region-wise segment analysis), with forecasts and estimates in "USD million" for the period 2024-2028, as well as historical data from 2018-2022 for the following segments.
- Product
- Cassettes
- Strips
- Enzyme-linked immunoassay
- Geography
- North America
- Canada
- US
- Europe
- Germany
- Asia
- Japan
- Rest of World (ROW)
- North America
By Product Insights
- The cassettes segment is estimated to witness significant growth during the forecast period.
Animal pregnancy test kits, including cassette-based options, play a crucial role In the livestock industry by providing quick and accurate results for breeders and pet owners. These kits utilize antibodies that react with relaxin, a hormone present in animal urine, to indicate pregnancy. Cassettes, a popular format, consist of a plastic device with a built-in test strip. Their user-friendly design and reliable results make them suitable for both veterinary clinics and individual animal owners. Timely detection of pregnancy in livestock species, such as pigs, goats, sheep, and cows, is essential for effective breeding practices and animal welfare. Diagnostic tools, like pregnancy test kits, contribute significantly to the livestock sector by ensuring efficient reproductive management.
Get a glance at the Animal Pregnancy Test Kit Industry report of share of various segments Request Free Sample
The Cassettes segment was valued at USD 154.00 billion in 2018 and showed a gradual increase during the forecast period.
Regional Analysis
- North America is estimated to contribute 40% to the growth of the global market during the forecast period.
Technavio's analysts have elaborately explained the regional trends and drivers that shape the market during the forecast period.
For more insights on the market share of various regions, Request Free Sample
The market in North America held the largest revenue share in 2023, with the US and Canada being the major contributors. Factors driving the market growth include increasing pet adoption, heightened awareness towards animal healthcare, and advanced veterinary healthcare infrastructure. Notable veterinary associations, such as the Canadian Veterinary Medical Association (CVMA) and American Veterinary Medical Association (AVMA), are actively promoting animal health through various campaigns. The region's strong veterinary services sector, including health checks, vaccinations, diagnostic equipment, medicine supply, and veterinary supplies, further bolsters market growth. Strict regulation and supply chain management ensure the availability and quality of animal pregnancy test kits, making North America a significant market for this product.
Market Dynamics
Our animal pregnancy test kit market researchers analyzed the data with 2023 as the base year, along with the key drivers, trends, and challenges. A holistic analysis of drivers will help companies refine their marketing strategies to gain a competitive advantage.
What are the key market drivers leading to the rise in adoption of Animal Pregnancy Test Kit Industry?
Growing veterinary care spending is the key driver of the market.
- The market In the US is anticipated to experience significant growth due to the increasing expenditure on animal healthcare. According to the American Pet Products Association (APPA), the total pet healthcare expenditure In the US reached approximately USD103.6 billion in 2020, a 7.2% increase from the previous year's USD97.1 billion. Of this amount, USD31.4 billion was spent on veterinary care, and USD23.4 billion was allocated for pet supplies. Pet owners have been placing greater emphasis on preventive care for their pets, leading to an increased demand for diagnostic tools such as pregnancy test kits. Livestock farmers and veterinarians also require these kits for early pregnancy diagnosis in farm animals, including cows, to optimize breeding practices and ensure the welfare of their livestock.
- The availability of various diagnostic modalities, such as whole blood, plasma, and serum samples, has made pregnancy testing more accessible for livestock owners and pet breeders. The use of pregnancy test kits is crucial for sex-sorted semen collection and artificial insemination procedures, which are essential for efficient livestock farming and breeding. The welfare of animals and reproductive health are critical concerns for farmers, breeders, and pet owners alike. Diagnostic equipment, medications, vaccines, and other necessities are vital components of veterinary services, and pregnancy tests are an integral part of routine health checks and health care for animals. Strict regulation and supply chain management are essential for ensuring the availability of test kits and other veterinary supplies.
- In the event of medicine shortages or supply disruptions, veterinary professionals play a crucial role in maintaining the health and well-being of animals. The market for animal pregnancy test kits is expected to expand further as pet adoption rates increase and households with cats and dogs continue to prioritize their animal companions' health and well-being. The convenience of home use test kits adds to their appeal for pet owners, while the use of advanced technologies such as antibodies and pregnancy hormones like chorionic gonadotropin further enhances their effectiveness.
What are the market trends shaping the Animal Pregnancy Test Kit Industry?
Increasing demand from livestock producers is the upcoming market trend.
- The market is witnessing significant growth due to the increasing focus on animal care and reproductive health in livestock farming. With the rising global demand for livestock products, such as meat and dairy, the need for efficient livestock management practices has become essential. Early pregnancy diagnosis using diagnostic tools and equipment is crucial for farmers, veterinarians, and animal owners to optimize breeding practices and improve pregnancy outcomes. Diagnostic modalities like whole blood, plasma, and serum samples are used to detect pregnancy hormones such as chorionic gonadotropin in livestock animals, including farm animals and companion animals. These tests help in determining the success rate of artificial insemination and sex-sorted semen use, contributing to the welfare of animals and the livestock business.
- E-commerce distribution channels and on-farm end-use have emerged as significant growth areas for the market. Homesetting end-use, including pet owners and breeders, also contributes to the market's growth. The availability of various diagnostic equipment and veterinary services, including health checks and vaccinations, is essential for the market's expansion. Strict regulation and supply chain management are crucial factors influencing the market's growth. Veterinary professionals play a vital role In the routine health check-ins and veterinary care for animals. The availability of tests and diagnostics equipment is essential to address medicine shortages and supply disruptions. In conclusion, the market is experiencing growth due to the increasing demand for livestock products, the need for efficient reproductive management, and the availability of diagnostic tools and equipment.
- This market is expected to continue growing as the focus on animal welfare and breeding practices remains a priority for livestock owners and veterinary professionals.
What challenges does Animal Pregnancy Test Kit Industry face during the growth?
Lack of adequately trained veterinary doctors to perform animal pregnancy tests is a key challenge affecting the industry growth.
- In the realm of animal care, accurate pregnancy diagnosis plays a significant role in maintaining the reproductive health of livestock and companion animals. The animal population, encompassing farm animals and pets, necessitates various diagnostic modalities and tools, such as pregnancy test kits, to ensure optimal breeding practices and pregnancy outcomes. Livestock farmers and veterinarians rely on these tests to assess the welfare of their animals, facilitate artificial insemination, and monitor the progression of pregnancy. The collection of appropriate samples, such as whole blood, plasma, or serum, is essential for the effectiveness of these tests. Livestock farms and veterinary clinics require advanced diagnostic equipment to perform these tests, ensuring the availability of necessary medicines, vaccines, and tests.
- However, challenges such as medicine shortages and supply disruptions can impact the market's growth. Pet owners and breeders also require these tests for their companion animals, ensuring the health and well-being of their pets. The e-commerce distribution of these pregnancy test kits and their use in homesetting end-use further expand the market's reach. Strict regulation and supply chain management are crucial to maintaining the quality and accuracy of these tests. Key diagnostic hormones, such as chorionic gonadotropin, are essential for the detection of pregnancy. These hormones can be measured through various methods, including optical density and radioisotopes. The breeding rate and pregnancy outcomes are significant factors influencing the demand for these tests.
- In conclusion, the market plays a vital role In the livestock business and veterinary services by ensuring accurate pregnancy diagnosis, maintaining animal health, and improving breeding practices. The availability of these tests and the expertise of veterinary professionals are crucial to their successful implementation.
Exclusive Customer Landscape
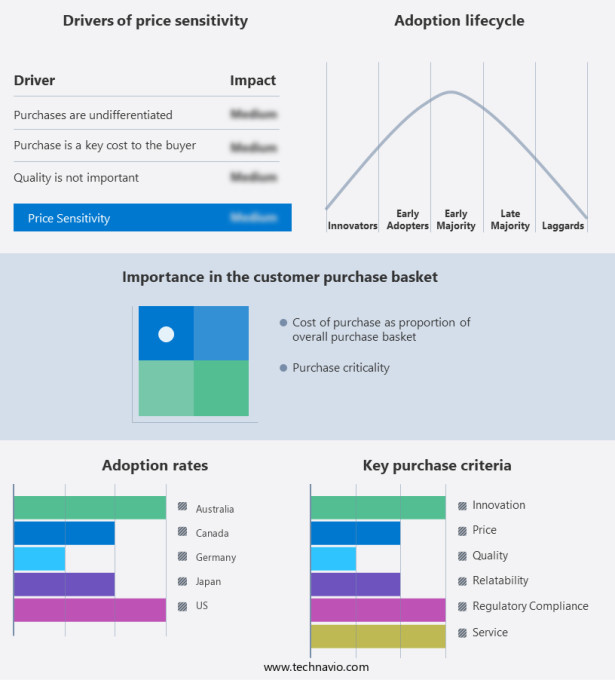
The animal pregnancy test kit market forecasting report includes the adoption lifecycle of the market, covering from the innovator's stage to the laggard's stage. It focuses on adoption rates in different regions based on penetration. Furthermore, the animal pregnancy test kit market report also includes key purchase criteria and drivers of price sensitivity to help companies evaluate and develop their market growth analysis strategies.
Customer Landscape
Key Companies & Market Insights
Companies are implementing various strategies, such as strategic alliances, animal pregnancy test kit market forecast, partnerships, mergers and acquisitions, geographical expansion, and product/service launches, to enhance their presence In the industry.
Bellylabs Oy - The company introduces the BioPryn animal pregnancy test kit to the market, providing a reliable and accurate solution for determining equine pregnancy. This user-friendly kit offers swift results, ensuring timely management of breeding programs and optimizing reproductive efficiency. BioPryn's advanced technology guarantees high sensitivity and specificity, making it a trusted choice for veterinarians, farmers, and breeders In the United States.
The industry research and growth report includes detailed analyses of the competitive landscape of the market and information about key companies, including:
- Bellylabs Oy
- Bio Tracking
- BioNote Inc.
- EMLAB GENETICS LLC.
- Fassisi, Society for Veterinary Diagnostics and Environmental Ana
- Genex Cooperative
- Hangzhou Testsea Biotechnology Co. Ltd.
- IDEXX LABORATORIES INC.
- J and G Biotech Ltd.
- MicroTUS International Biotechnology Co. Ltd.
- Randox Laboratories Ltd.
- Ring Biotechnology Co. Ltd.
- Secure Diagnostics Pvt. Ltd.
- Shenzhen Bioeasy Biotechnology Co. Ltd.
- Twil Canada Inc.
- Vetlab Supplies Ltd
- Zhengzhou Zhimuren Machinery Equipment Co.
- Zoetis Inc.
Qualitative and quantitative analysis of companies has been conducted to help clients understand the wider business environment as well as the strengths and weaknesses of key industry players. Data is qualitatively analyzed to categorize companies as pure play, category-focused, industry-focused, and diversified; it is quantitatively analyzed to categorize companies as dominant, leading, strong, tentative, and weak.
Research Analyst Overview
The market encompasses a significant segment of the animal health industry, catering to the reproductive health needs of various livestock and companion animals. This market is driven by the growing demand for early and accurate pregnancy diagnosis in farm animals and pets, enabling farmers, veterinarians, and animal owners to optimize breeding practices and ensure the welfare of their livestock and companion animals. Animal population growth and the increasing focus on livestock farming and livestock farms as a source of food and other necessities further fuel the demand for animal pregnancy test kits. Farmers and livestock owners rely on these tools to improve their breeding rates, minimize the risk of pregnancy losses, and enhance the overall productivity of their operations.
Veterinarians and animal healthcare professionals also utilize pregnancy test kits to provide routine health checks and diagnostic services to their clients. These tests play a crucial role in ensuring the health and wellbeing of animals, enabling timely interventions and treatments when necessary. The availability of various diagnostic modalities, including whole blood, plasma, and serum samples, has expanded the scope of animal pregnancy testing. These tests can be used for a wide range of livestock animals, from cows and other large farm animals to companion animals such as cats and dogs. The e-commerce distribution channel has also played a significant role In the growth of the market.
Farmers, livestock owners, and pet owners can now easily access these tests from the comfort of their homes or farms, enabling them to make informed decisions regarding their animals' reproductive health. However, the market is not without its challenges. Medicine shortages and supply disruptions can impact the availability and affordability of these tests, potentially leading to delays in diagnosis and treatment. Strict regulation and supply chain management are essential to ensuring the quality and safety of these tests, as well as maintaining the trust and confidence of consumers. In conclusion, the market is a vital component of the animal health industry, providing farmers, veterinarians, and animal owners with the tools they need to optimize breeding practices, ensure the welfare of their animals, and make informed decisions regarding their reproductive health.
The market's continued growth is driven by the increasing demand for early and accurate pregnancy diagnosis, the expanding scope of diagnostic modalities, and the convenience of e-commerce distribution. Despite challenges such as medicine shortages and strict regulation, the market is expected to continue growing, driven by the ongoing need for animal healthcare and the importance of maintaining the health and productivity of livestock and companion animals.
|
Animal Pregnancy Test Kit Market Scope |
|
|
Report Coverage |
Details |
|
Page number |
132 |
|
Base year |
2023 |
|
Historic period |
2018-2022 |
|
Forecast period |
2024-2028 |
|
Growth momentum & CAGR |
Accelerate at a CAGR of 3.27% |
|
Market growth 2024-2028 |
USD 65.7 million |
|
Market structure |
Fragmented |
|
YoY growth 2023-2024(%) |
3.13 |
|
Key countries |
US, Canada, Germany, Australia, and Japan |
|
Competitive landscape |
Leading Companies, Market Positioning of Companies, Competitive Strategies, and Industry Risks |
What are the Key Data Covered in this Animal Pregnancy Test Kit Market Research and Growth Report?
- CAGR of the Animal Pregnancy Test Kit industry during the forecast period
- Detailed information on factors that will drive the Animal Pregnancy Test Kit growth and forecasting between 2024 and 2028
- Precise estimation of the size of the market and its contribution of the industry in focus to the parent market
- Accurate predictions about upcoming growth and trends and changes in consumer behaviour
- Growth of the market across North America, Europe, Asia, and Rest of World (ROW)
- Thorough analysis of the market's competitive landscape and detailed information about companies
- Comprehensive analysis of factors that will challenge the animal pregnancy test kit market growth of industry companies
We can help! Our analysts can customize this animal pregnancy test kit market research report to meet your requirements.


