Animation And Gaming Market Size 2024-2028
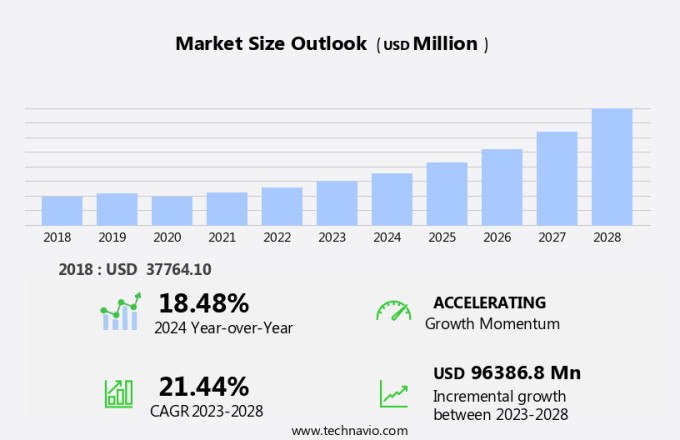
The animation and gaming market size is forecast to increase by USD 96.39 billion at a CAGR of 21.44% between 2023 and 2028.
- The market is experiencing significant growth, driven by the increasing sophistication in animation and gaming technologies. The rise of Pay TV channels has also contributed to the market's expansion, providing new platforms for the distribution of animated and gaming content. However, the industry faces challenges, including a shortage of skilled personnel to meet the growing demand for high-quality animation and gaming content. These trends and challenges offer opportunities for businesses In the animation and gaming sector to innovate and differentiate themselves in a competitive market. Companies that can effectively address the shortage of skilled labor and stay abreast of the latest technologies will be well-positioned for success.
- The market analysis report provides a comprehensive examination of these factors and more, offering valuable insights for businesses looking to capitalize on the opportunities In the animation and gaming sector.
What will be the Size of the Animation And Gaming Market During the Forecast Period?
- The market encompasses the creation and consumption of static images brought to life through the illusion of motion. This dynamic industry involves designing, drawing, and creating layouts and sequences for various applications, including gaming products and movies. Visual effects, digital art, and computer-generated imagery are integral components, with techniques ranging from traditional hand-drawn animation to motion graphics and stop motion. The market caters to diverse industries, such as advertising, teaching, and entertainment, including live action film, television, and immersive media experiences. Gaming platforms span console, PC, and mobile devices, with emerging technologies like augmented reality expanding the market's potential. The market continues to evolve, offering endless opportunities for innovation and growth.
How is this Animation And Gaming Industry segmented and which is the largest segment?
The animation and gaming industry research report provides comprehensive data (region-wise segment analysis), with forecasts and estimates in "USD million" for the period 2024-2028, as well as historical data from 2018-2022 for the following segments.
- Application
- TV
- Film
- Others
- Geography
- North America
- US
- APAC
- China
- Japan
- South Korea
- Europe
- UK
- South America
- Middle East and Africa
- North America
By Application Insights
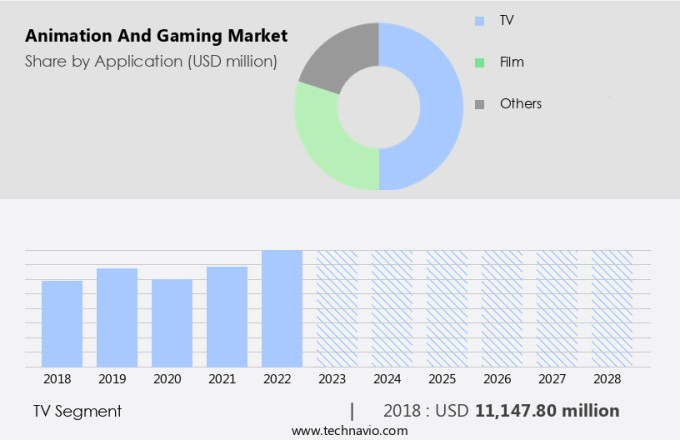
- The tv segment is estimated to witness significant growth during the forecast period.
The market encompasses console, PC, mobile, augmented reality (AR), and virtual reality (VR) experiences. Publisher and hardware producer collaborations fuel innovation, with digital distribution platforms, cloud computing, and cloud-based solutions enabling seamless access. Streaming services, such as Netflix, Amazon Prime Video, and Hulu, have transformed traditional television (TV) by offering animation-rich content on demand, including popular series like "Game of Thrones" and "Stranger Things." AR and VR technologies further enhance immersive media experiences, with applications extending to education, healthcare, and entertainment industries. The TV segment, including cable and satellite television and OTT platforms, benefits from the integration of visual effects (VFX) and animation in series production.
Get a glance at the Animation And Gaming Industry report of share of various segments Request Free Sample
The TV segment was valued at USD 11.15 billion in 2018 and showed a gradual increase during the forecast period.
Regional Analysis
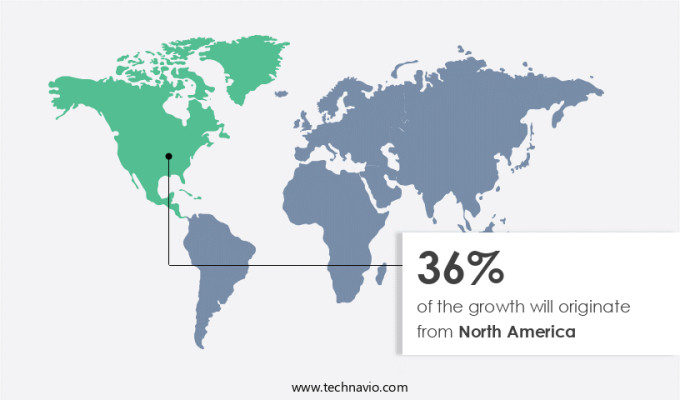
- North America is estimated to contribute 36% to the growth of the global market during the forecast period.
Technavio’s analysts have elaborately explained the regional trends and drivers that shape the market during the forecast period.
For more insights on the market share of various regions, Request Free Sample
The North American market leads the global animation and gaming industry, driven by the extensive use of software and services In the media and entertainment sector. The US is the primary contributor to this region's revenue, fueled by the high demand for locally produced animation content and the presence of major industry players like Disney and DreamWorks. The global market witnesses significant growth due to the increasing popularity of 3D animation. Key industry players, including Disney Enterprises Inc, Adobe Systems Incorporated, and Sony Corporation, are capitalizing on this trend to expand their market share. This industry's continued growth is underpinned by the increasing adoption of advanced technologies and the rising consumer preference for immersive entertainment experiences.
Market Dynamics
Our animation and gaming market researchers analyzed the data with 2023 as the base year, along with the key drivers, trends, and challenges. A holistic analysis of drivers will help companies refine their marketing strategies to gain a competitive advantage.
What are the key market drivers leading to the rise In the adoption of Animation And Gaming Industry?
Increasing sophistication in animation and gaming is the key driver of the market.
- The market is experiencing significant growth and innovation, catering to a diverse consumer base seeking entertainment, escape, and stress relief. This market encompasses various forms of animated content, including static images that create the illusion of motion, as well as motion graphics, hand-drawn animation, stop motion, and 3D animation technology. In the gaming sector, there is a focus on 3D gaming and virtual reality technologies, such as augmented reality and virtual reality, which offer immersive media experiences. Gaming products range from console and PC games to mobile applications, while visual technology advances include high definition content, 5G technology, and cloud-based solutions.
- The market also includes digital distribution platforms, publishers, and hardware producers. Animation and gaming extend to various industries, including film, video marketing, teaching, healthcare, and the medical industry, with applications in movie studios, OTT platforms, and video streaming services. Consumers can access high-quality content through subscriptions and pay-per-view services, while piracy remains a concern for content creators. Digital content, including computer-generated imagery, plays a significant role In the market, with applications in movies, video games, and 3D mobile applications. Anime, a popular form of animation, has gained significant popularity worldwide. Visual effects, simulation, and digital art are essential components of animation and gaming, with traditional art techniques often integrated into the design of characters, objects, and layouts.
- Sequences and networks of images are used to create the illusion of motion and bring stories to life. The market continues to evolve, offering endless possibilities for creativity and innovation.
What are the market trends shaping the Animation And Gaming Industry?
Rising number of Pay TV channels is the upcoming market trend.
- The market is experiencing significant growth, driven by the increasing popularity of Pay TV and its subscription-based services. Pay TV platforms, which utilize satellite and cable distribution technologies, offer a vast array of content choices to subscribers, fueling the demand for animation and gaming products. Digitalization is another key factor contributing to the market's expansion, as it enables the creation and distribution of high-quality animation and gaming content. This includes visual technology advancements, such as 3D gaming and animation technology, as well as virtual reality and augmented reality technologies. Additionally, the proliferation of OTT platforms and HD content delivery, along with the rise of 5G technology and cloud-based solutions, are further propelling the market forward.
- The animation and gaming industry encompasses various sectors, including movies, video games, and digital art, with applications In the media and entertainment industry, healthcare, education, and advertising. Characters and objects are brought to life through motion graphics, hand-drawn animation, and computer-generated imagery, providing immersive media experiences for consumers across console, PC, mobile, and web platforms.
What challenges does the Animation And Gaming Industry face during its growth?
Shortage of skilled personnel is a key challenge affecting the industry growth.
- The markets encompass the creation and development of visual content using static images to generate the illusion of motion. This field involves designing, drawing, and creating layouts and sequences for gaming products and movies, incorporating visual effects and digital art. The use of 3D animation technology and computer-generated imagery (CGI) in films, video games, and 3D mobile applications has revolutionized the industry. The market for animation and gaming is vast, spanning various sectors such as the media and entertainment industry, healthcare, and OTT platforms. High-quality content, including HD movies and video streaming services, requires advanced visual technology to create realistic images and immersive media experiences.
- Virtual reality technologies, augmented reality, and 5G technology are driving innovation in this space. However, the industry faces challenges, including the need for skilled professionals and the issue of piracy. The increasing demand for video content and games has led to a shortage of skilled animators and content creators, resulting in lower salaries and many opting for part-time jobs. Piracy continues to be a significant concern, with digital content being easily duplicated and distributed illegally. Despite these challenges, the market for animation and gaming continues to grow, with publishers, hardware producers, and digital distribution platforms investing in cloud-based solutions and streaming services to deliver high-quality content to consumers.
- The future of animation and gaming lies In the integration of user-generated content, virtual reality, and the development of realistic characters, objects, and environments.
Exclusive Customer Landscape
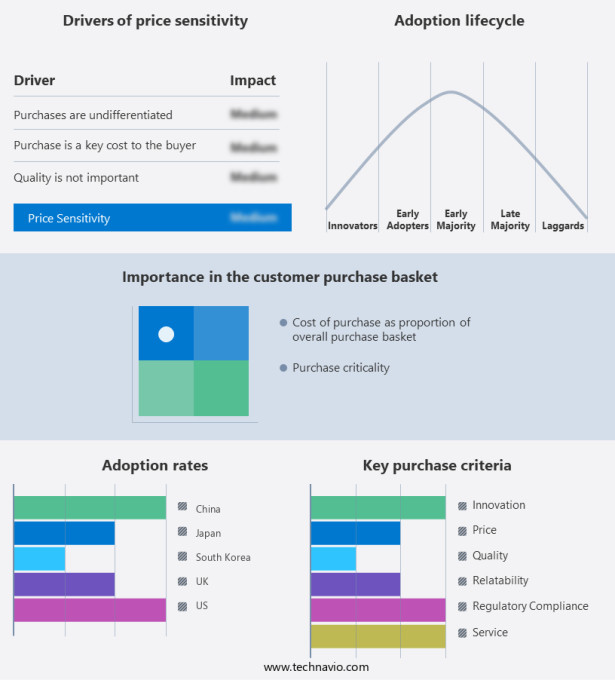
The animation and gaming market forecasting report includes the adoption lifecycle of the market, covering from the innovator’s stage to the laggard’s stage. It focuses on adoption rates in different regions based on penetration. Furthermore, the animation and gaming market report also includes key purchase criteria and drivers of price sensitivity to help companies evaluate and develop their market growth analysis strategies.
Customer Landscape
Key Companies & Market Insights
Companies are implementing various strategies, such as strategic alliances, animation and gaming market forecast, partnerships, mergers and acquisitions, geographical expansion, and product/service launches, to enhance their presence In the industry.
Activision Blizzard Inc. - The company provides access to Dreamworks Animation's esteemed film collection, featuring 15 titles such as Shrek, Madagascar, and The Croods, for US audiences. This impressive roster showcases the studio's innovative storytelling and exceptional animation techniques. By offering this content, we cater to the growing demand for high-quality animation and entertainment withIn the dynamic US market.
The industry research and growth report includes detailed analyses of the competitive landscape of the market and information about key companies, including:
- Activision Blizzard Inc.
- Adobe Inc.
- Anibrain
- Autodesk Inc.
- Corus Entertainment Inc.
- Epic Games Inc.
- Framestore Ltd.
- LOSTMARBLE LLC.
- Microsoft Corp.
- NetEase Inc.
- Nintendo Co., Ltd.
- Reliance Industries Ltd.
- Sony Group Corp.
- Technicolor SA
- The Foundry Visionmongers Ltd.
- The Walt Disney Co.
- TOEI ANIMATION Co. Ltd.
- Toonz Animation India Pvt. Ltd.
- Warner Bros. Entertainment Inc.
Qualitative and quantitative analysis of companies has been conducted to help clients understand the wider business environment as well as the strengths and weaknesses of key industry players. Data is qualitatively analyzed to categorize companies as pure play, category-focused, industry-focused, and diversified; it is quantitatively analyzed to categorize companies as dominant, leading, strong, tentative, and weak.
Research Analyst Overview
Exploring the Dynamic Intersection of Animation and Gaming: Market Insights and Trends Animation and gaming have emerged as two of the most captivating and innovative industries In the digital realm. Both fields leverage the power of visual technology to stimulate, entertain, and engage audiences in unique ways. In this article, we delve into the intricacies of animation and gaming, highlighting the market dynamics and trends that shape their continued growth. Animation, at its core, is the art of designing and creating the illusion of motion from static images. This art form has evolved significantly over the decades, with traditional drawing techniques giving way to digital art and computer-generated imagery (CGI).
Animation is not limited to movies and television; it is also a crucial component of video games, virtual reality technologies, and immersive media experiences. Gaming, on the other hand, is an interactive form of entertainment that allows users to engage with dynamic, three-dimensional environments. The gaming market encompasses a diverse range of products, from console and PC games to mobile applications and virtual reality experiences. With advancements in 3D gaming technology, visual effects, and user interfaces, the gaming industry continues to push the boundaries of what is possible In the realm of digital entertainment. The animation and gaming industries share a symbiotic relationship, with each field influencing the other's growth and development.
For instance, advancements in 3D animation technology have led to more realistic and immersive gaming experiences. Similarly, the popularity of anime and hand-drawn animation has inspired the creation of numerous video games and anime-style video games. The media and entertainment industry, including movie studios, television networks, and Ott platforms, have also embraced animation and gaming as essential components of their offerings. High-definition content, subscriptions, and streaming services have made it easier for audiences to access a wide range of animation and gaming content from anywhere In the world. The healthcare, life sciences, and education sectors are also adopting animation and gaming to enhance their offerings.
For example, medical animations help explain complex medical concepts, while simulation games are used for teaching various skills. The animation and gaming industries are not without their challenges, however. Piracy and digital content protection continue to be significant concerns, as the ease of sharing digital content online makes it vulnerable to unauthorized use. Additionally, the increasing use of augmented reality, virtual reality, and cloud-based solutions in gaming and animation requires significant investments in hardware and infrastructure. In conclusion, the animation and gaming industries are dynamic and ever-evolving, driven by technological advancements, creative innovation, and consumer demand. As these industries continue to intersect and influence each other, we can expect to see even more exciting developments In the realm of digital entertainment.
|
Animation And Gaming Market Scope |
|
|
Report Coverage |
Details |
|
Page number |
142 |
|
Base year |
2023 |
|
Historic period |
2018-2022 |
|
Forecast period |
2024-2028 |
|
Growth momentum & CAGR |
Accelerate at a CAGR of 21.44% |
|
Market growth 2024-2028 |
USD 96386.8 million |
|
Market structure |
Fragmented |
|
YoY growth 2023-2024(%) |
18.48 |
|
Key countries |
US, China, Japan, South Korea, and UK |
|
Competitive landscape |
Leading Companies, Market Positioning of Companies, Competitive Strategies, and Industry Risks |
What are the Key Data Covered in this Animation And Gaming Market Research and Growth Report?
- CAGR of the Animation And Gaming industry during the forecast period
- Detailed information on factors that will drive the Animation And Gaming growth and forecasting between 2024 and 2028
- Precise estimation of the size of the market and its contribution of the industry in focus to the parent market
- Accurate predictions about upcoming growth and trends and changes in consumer behaviour
- Growth of the market across North America, APAC, Europe, South America, and Middle East and Africa
- Thorough analysis of the market’s competitive landscape and detailed information about companies
- Comprehensive analysis of factors that will challenge the animation and gaming market growth of industry companies
We can help! Our analysts can customize this animation and gaming market research report to meet your requirements.


