Anti-CD20 Monoclonal Antibodies Market Size 2025-2029
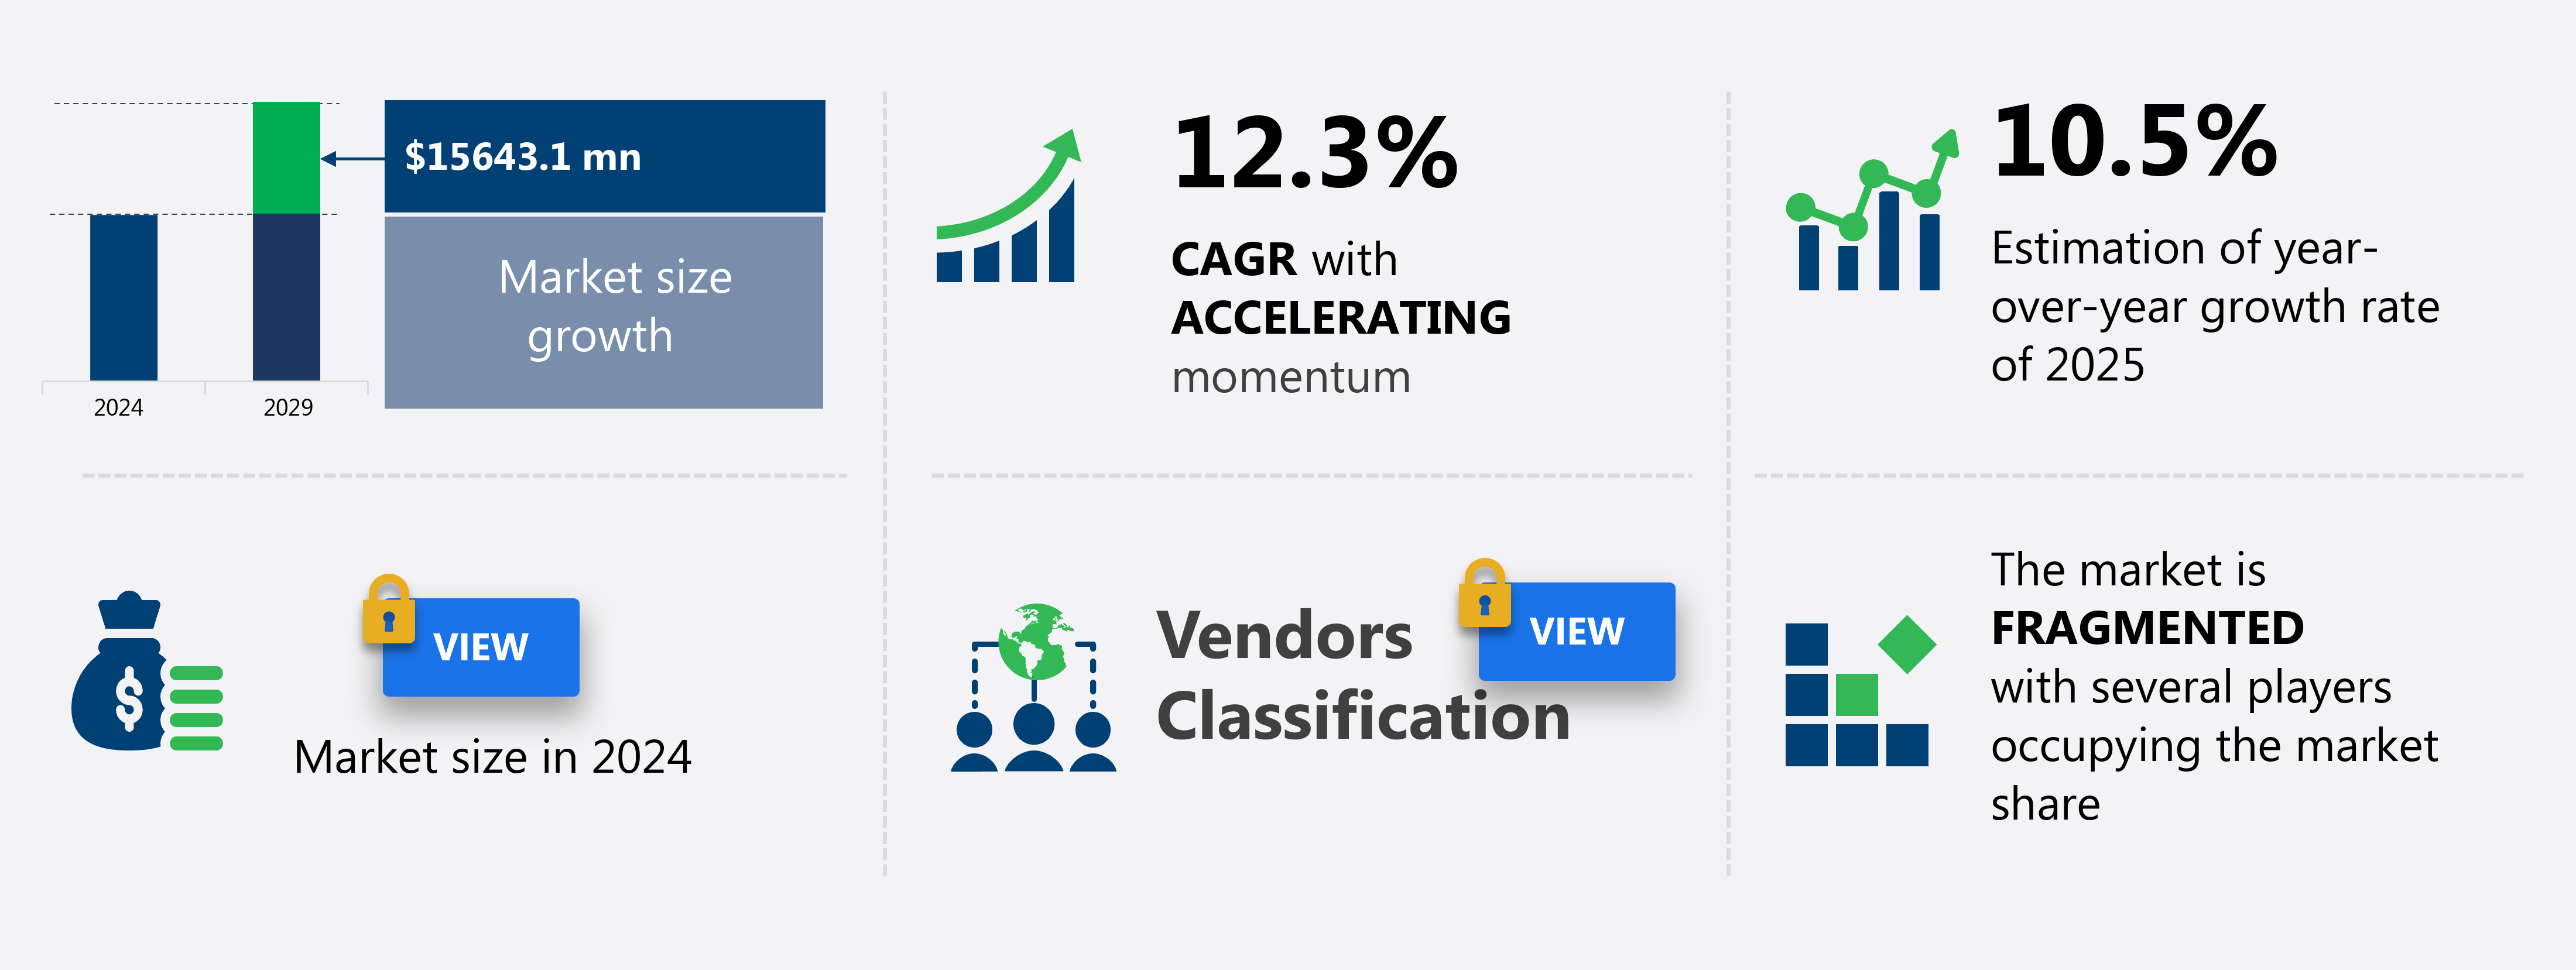
The anti-CD20 monoclonal antibodies (MABs) market size is forecast to increase by USD 15.64 billion at a CAGR of 12.3% between 2024 and 2029.
-
The market is experiencing significant growth due to the increasing use of combination therapies In the treatment of various diseases. These mAbs, which target the CD20 protein found on the surface of B cells, are increasingly being used in immunology and inflammatory bowel disease therapies. The market is driven by the rising awareness of therapeutic areas and the potential benefits of mAb treatments. However, the market also faces challenges, including the adverse effects associated with anti-CD20 mAbs, such as infusion reactions and the risk of developing neutralizing antibodies. These factors may limit the market growth and require ongoing research and development efforts to mitigate their impact. Ambulatory surgical centers and blood banks are key institutions where the demand for anti-CD20 mAbs is increasing due to the convenience and cost-effectiveness of outpatient treatments. Overall, the market for anti-CD20 mAbs is expected to continue growing, driven by the increasing demand for targeted therapies and ongoing research and development efforts to address the challenges associated with their use.
What will be the Size of the market During the Forecast Period?

Request Free Sample
-
The market encompasses a range of immunotherapeutic agents used primarily in the treatment of B-cell malignancies and certain autoimmune diseases. These mAbs target the CD20 marker found on the surface of mature and malignant B cells, as well as macrophages. The market's growth is driven by the increasing prevalence of B-cell malignancies, such as lymphoma, and autoimmune diseases, including rheumatoid arthritis, systemic lupus erythematosus, inflammatory bowel disease, and multiple sclerosis. The prognosis for patients with these conditions has significantly improved due to the efficacy of anti-CD20 mAbs, leading to increased demand.
-
In the realm of oncology, anti-CD20 mAbs are utilized extensively In the neuroscience and immunology sectors. Notable anti-CD20 mAbs include ofatumumab and ocrelizumab. The market is expected to continue expanding due to the ongoing research and development efforts In the immunotherapy space.
How is this market segmented and which is the largest segment?
The market research report provides comprehensive data (region-wise segment analysis), with forecasts and estimates in "USD billion" for the period 2025-2029, as well as historical data from 2019-2023 for the following segments.
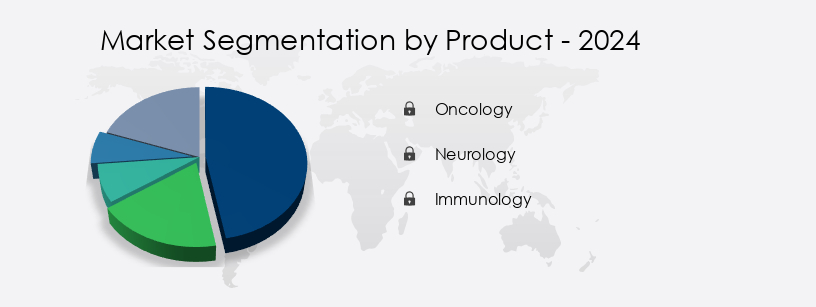
- Product
- Oncology
- Neurology
- Immunology
- Type
- First generation
- Second generation
- Third generation
- End-user
- Hospitals and clinics
- Academic and research institutions
- Contract research organizations
- Drug Class
- Rituximab
- Ofatumumab
- Obinutuzumab
- Ublituximab
- Others
- Route Of Administration
- Geography
- North America
- Europe
- Asia
- Rest of World (ROW)
By Product Insights
The oncology segment is estimated to witness significant growth during the forecast period. The market is primarily driven by the oncology segment due to the approval of these mAbs for treating prevalent cancer indications. Four out of five anti-CD20 mAbs are authorized for various cancer types, including non-Hodgkin's lymphoma (NHL), chronic lymphocytic leukemia (CLL), and follicular lymphoma. The high incidence and prevalence of cancer, with an estimated 20 million new cases and 9.7 million deaths in 2022 (NCI), are expected to fuel market growth. Anti-CD20 mAbs target mature and malignant B cells, macrophages, and autoimmune disorders. These mAbs are used in immunotherapy for treating B-cell malignancies and autoimmune diseases such as rheumatoid arthritis, systemic lupus erythematosus, inflammatory bowel disease, and multiple sclerosis.

Get a glance at the market report of share of various segments Request Free Sample
Market Dynamics
Our Anti-Cd20 Monoclonal Antibodies (Mabs) Market researchers analyzed the data with 2024 as the base year, along with the key drivers, trends, and challenges. A holistic analysis of drivers will help companies refine their marketing strategies to gain a competitive advantage.
What are the key market drivers leading to the rise in adoption of Anti-CD20 Monoclonal Antibodies (Mabs) Market?
- Increased use of combination therapies is the key driver of the market. The market is experiencing substantial growth due to the increasing utilization of combination therapies for treating various indications. Anti-CD20 mABs are the preferred choice for targeted therapy in CD20 antigen-expressing diseases across therapeutic areas like oncology, immunology, and neurology. Combination therapy is favored when monotherapy products exhibit low efficacy and poor tolerability. In the realm of comorbidity diseases, the application of anti-CD20 mABs in conjunction with other drugs is on the rise. These combination drugs target distinct pathways to combat diseases with minimal adverse effects. B-cell malignancies, autoimmune diseases such as rheumatoid arthritis, systemic lupus erythematosus, inflammatory bowel disease, multiple sclerosis, and lymphoma therapy are significant areas where anti-CD20 mABs are employed.
- The immune system, including mature B cells, malignant B cells, macrophages, and autoimmune disorders, plays a crucial role in the market's growth. The CD20 protein, found on the surface of B cells and blood plasma cells, is a critical marker for targeting these cells. Ofatumumab and Ocrelizumab are notable anti-CD20 mABs used in various therapeutic applications. Healthcare research continues to uncover new applications for anti-CD20 mABs, particularly in organ transplant recipients and immunology. Private and public sector investments in healthcare and research further fuel the market's expansion.
What are the market trends shaping the Anti-CD20 Monoclonal Antibodies (Mabs) Market?
- Increasing awareness about therapeutic areas is the upcoming trend in the market. The market is experiencing significant growth due to advancements in immunotherapy for various diseases in oncology, immunology, and neurology. B-cell malignancies, autoimmune disorders such as rheumatoid arthritis, systemic lupus erythematosus, inflammatory bowel disease, and multiple sclerosis are among the indications for anti-CD20 mABs. The epidemiology of these diseases and the increasing morbidity rates and cancer cases are driving market growth. Hospitals, specialty clinics, and ambulatory surgical centers are key end-users. The CD20 protein is a transmembrane antigen found on the surface of mature and malignant B cells, macrophages, and plasma cells. Anti-CD20 mABs work by binding to the CD20 protein, leading to cell damage and subsequent elimination.
- These drugs are used in lymphoma therapy and for organ transplant recipients to prevent graft-versus-host disease. The healthcare research sector is witnessing increased private and public sector investments in the development of new anti-CD20 mABs, such as Ofatumumab and Ocrelizumab. The CD20 marker is essential for the diagnosis and treatment of various diseases, making it a significant area of focus for research and development. The immune system plays a crucial role in maintaining health, and any disruption can lead to various disorders. Anti-CD20 mABs offer a promising solution for managing these conditions.
What challenges doesAnti-Cd20 Monoclonal Antibodies (Mabs) Market face during the growth?
- The adverse effects of anti-CD20 mABs is a key challenge affecting the market growth. The market is experiencing significant growth due to their effectiveness in treating CD20-positive diseases, including B-cell malignancies and autoimmune disorders. However, the market faces challenges from severe adverse effects associated with these therapies. For instance, Rituximab, a widely used anti-CD20 mAB, can cause chest pain, irregular heartbeats, and kidney problems. Obinutuzumab is linked to hepatitis B virus reactivation, progressive multifocal leukoencephalopathy, tumor lysis syndrome, thrombocytopenia, and hyponatremia. Ocrelizumab increases the risk of respiratory tract infections, skin infections, herpes infections, and breast cancer. These side effects have led patients to explore alternative treatment options, negatively impacting the market's growth during the forecast period.
- The anti-CD20 mABs target mature and malignant B cells, as well as macrophages, making them essential in immunology for various conditions, such as lymphoma therapy, rheumatoid arthritis, systemic lupus erythematosus, inflammatory bowel disease, multiple sclerosis, and oncology. The neuroscience and immunology sectors have also shown interest in these therapies. Despite the challenges, private and public sector investments continue to drive research and development in this field, with notable investments in Ofatumumab and Ocrelizumab. The CD20 protein is a crucial marker for identifying B cells, which are essential components of the immune system. The damage caused by these therapies to hematopoietic stem cells and plasma cells can lead to morbidity rates and cancer cases.
Exclusive Customer Landscape
The market forecasting report includes the adoption lifecycle of the market, covering from the innovator's stage to the laggard's stage. It focuses on adoption rates in different regions based on penetration. Furthermore, the market report also includes key purchase criteria and drivers of price sensitivity to help companies evaluate and develop their market growth analysis strategies.

Customer Landscape
Key Companies & Market Insights
Companies are implementing various strategies, such as strategic alliances, market forecast , partnerships, mergers and acquisitions, geographical expansion, and product/service launches, to enhance their presence In the market.
Acrotech Biopharma Inc. - The company offers anti-CD20 monoclonal antibodies such as Beleodaq, Folotyn, Evomela, and Zevalin.
The market research and growth report includes detailed analyses of the competitive landscape of the market and information about key companies, including:
- Amgen Inc.
- AstraZeneca Plc
- Celltrion Healthcare Co. Ltd.
- F. Hoffmann La Roche Ltd.
- Fosun International Ltd.
- Genmab AS
- IGM Biosciences Inc.
- JSC BIOCAD
- LFB SA
- Novartis AG
- Pfizer Inc.
- Regeneron Pharmaceuticals Inc.
- Spectrum Pharmaceuticals Inc.
- TG Therapeutics Inc.
- United BioPharma Inc.
- ZHEJIANG HISUN PHARMACEUTICAL Co. Ltd.
Qualitative and quantitative analysis of companies has been conducted to help clients understand the wider business environment as well as the strengths and weaknesses of key market players. Data is qualitatively analyzed to categorize companies as pure play, category-focused, industry-focused, and diversified; it is quantitatively analyzed to categorize companies as dominant, leading, strong, tentative, and weak.
Research Analyst Overview
The market encompasses a significant segment of the broader immunotherapy landscape, with applications in various medical fields, including but not limited to hematology and oncology, neuroscience, and immunology. These mAbs are designed to target mature and malignant B cells expressing the CD20 protein, playing a crucial role in the treatment of B-cell malignancies and autoimmune disorders. The CD20 protein is a transmembrane glycoprotein found on the surface of normal and malignant B lymphocytes, as well as macrophages. The binding of anti-CD20 mAbs to this protein facilitates various therapeutic interventions, such as cell damage, complement-dependent cytotoxicity, and antibody-dependent cellular cytotoxicity.
Moreover, the demand for anti-CD20 mAbs is driven by the increasing prevalence of B-cell malignancies and autoimmune diseases. According to healthcare research, B-cell malignancies account for approximately 20% of all hematological malignancies, with non-Hodgkin lymphoma being the most common subtype. Moreover, autoimmune diseases, such as rheumatoid arthritis, systemic lupus erythematosus, inflammatory bowel disease, and multiple sclerosis, affect millions of people worldwide, necessitating effective treatment options. The treatment landscape for B-cell malignancies and autoimmune diseases has evolved significantly in recent years, with the introduction of various anti-CD20 mAbs, including ofatumumab and ocrelizumab. These mAbs have demonstrated impressive therapeutic efficacy, leading to improved patient outcomes and reduced morbidity rates.
For instance, in oncology, anti-CD20 mAbs have become a cornerstone of lymphoma therapy, with high response rates and manageable side effects. The anti-CD20 mAbs market is influenced by various factors, including epidemiology, healthcare research, and investments in both the private and public sectors. The increasing number of cancer cases and the growing knowledge of the underlying mechanisms of autoimmune disorders have fueled significant research and development efforts in this area. Furthermore, public and private sector investments have played a crucial role in advancing the field, with notable progress In the development of novel anti-CD20 mAbs and the optimization of existing treatments.
Furthermore, in the context of organ transplantation, anti-CD20 mAbs have emerged as valuable tools for managing complications arising from the presence of donor-specific antibodies. These antibodies can lead to graft rejection, necessitating the use of immunosuppressive therapies. Anti-CD20 mAbs offer a more targeted approach, minimizing the risk of side effects associated with traditional immunosuppressive drugs. These mAbs have demonstrated impressive therapeutic efficacy in various applications, including oncology, neuroscience, and immunology, and are poised to continue shaping the future of healthcare.
Market Scope
|
Report Coverage
|
Details
|
Page number
|
255
|
Base year
|
2024
|
Historic period
|
2019-2023 |
Forecast period
|
2025-2029
|
Growth momentum & CAGR
|
Accelerate at a CAGR of 12.3%
|
Market growth 2025-2029
|
USD 15.64 billion
|
Market structure
|
Fragmented
|
YoY growth 2024-2025(%)
|
10.5
|
Key countries
|
US, Canada, China, UK, Germany, Italy, India, South Korea, Japan, France,
|
Competitive landscape
|
Leading Companies, Market Positioning of Companies, Competitive Strategies, and Industry Risks
|
Request Free Sample
What are the Key Data Covered in this Market Research and Growth Report?
- CAGR of the market during the forecast period
- Detailed information on factors that will drive the market growth and forecasting between 2025 and 2029
- Precise estimation of the size of the market and its contribution of the market in focus to the parent market
- Accurate predictions about upcoming market growth and trends and changes in consumer behaviour
- Growth of the market across North America, Europe, Asia, Rest of World (ROW),
- Thorough analysis of the market's competitive landscape and detailed information about companies
- Comprehensive analysis of factors that will challenge the growth of market companies
We can help! Our analysts can customize this market research report to meet your requirements. Get in touch
1 Executive Summary
- 1.1 Market overview
- Executive Summary - Chart on Market Overview
- Executive Summary - Data Table on Market Overview
- Executive Summary - Chart on Global Market Characteristics
- Executive Summary - Chart on Market by Geography
- Executive Summary - Chart on Market Segmentation by Product
- Executive Summary - Chart on Market Segmentation by Type
- Executive Summary - Chart on Market Segmentation by End-user
- Executive Summary - Chart on Market Segmentation by Drug Class
- Executive Summary - Chart on Market Segmentation by Route of Administration
- Executive Summary - Chart on Incremental Growth
- Executive Summary - Data Table on Incremental Growth
- Executive Summary - Chart on Company Market Positioning
2 Technavio Analysis
- 2.1 Analysis of price sensitivity, lifecycle, customer purchase basket, adoption rates, and purchase criteria
- Analysis of price sensitivity, lifecycle, customer purchase basket, adoption rates, and purchase criteria
- 2.2 Criticality of inputs and Factors of differentiation
- Overview on criticality of inputs and factors of differentiation
- 2.3 Factors of disruption
- Overview on factors of disruption
- 2.4 Impact of drivers and challenges
- Impact of drivers and challenges in 2024 and 2029
3 Market Landscape
- 3.1 Market ecosystem
- Parent Market
- Data Table on - Parent Market
- 3.2 Market characteristics
- Market characteristics analysis
4 Market Sizing
- 4.1 Market definition
- Offerings of companies included in the market definition
- 4.2 Market segment analysis
- 4.4 Market outlook: Forecast for 2024-2029
- Chart on Global - Market size and forecast 2024-2029 ($ million)
- Data Table on Global - Market size and forecast 2024-2029 ($ million)
- Chart on Global Market: Year-over-year growth 2024-2029 (%)
- Data Table on Global Market: Year-over-year growth 2024-2029 (%)
5 Historic Market Size
- 5.1 Global Anti-CD20 Monoclonal Antibodies (MABs) Market 2019 - 2023
- Historic Market Size - Data Table on Global Anti-CD20 Monoclonal Antibodies (MABs) Market 2019 - 2023 ($ million)
- 5.2 Product segment analysis 2019 - 2023
- Historic Market Size - Product Segment 2019 - 2023 ($ million)
- 5.3 Type segment analysis 2019 - 2023
- Historic Market Size - Type Segment 2019 - 2023 ($ million)
- 5.4 End-user segment analysis 2019 - 2023
- Historic Market Size - End-user Segment 2019 - 2023 ($ million)
- 5.5 Drug Class segment analysis 2019 - 2023
- Historic Market Size - Drug Class Segment 2019 - 2023 ($ million)
- 5.6 Route of Administration segment analysis 2019 - 2023
- Historic Market Size - Route of Administration Segment 2019 - 2023 ($ million)
- 5.7 Geography segment analysis 2019 - 2023
- Historic Market Size - Geography Segment 2019 - 2023 ($ million)
- 5.8 Country segment analysis 2019 - 2023
- Historic Market Size - Country Segment 2019 - 2023 ($ million)
6 Qualitative Analysis
- 6.1 Impact of AI on global anti-CD20 monoclonal antibodies (mABs) market
7 Five Forces Analysis
- 7.1 Five forces summary
- Five forces analysis - Comparison between 2024 and 2029
- 7.2 Bargaining power of buyers
- Bargaining power of buyers - Impact of key factors 2024 and 2029
- 7.3 Bargaining power of suppliers
- Bargaining power of suppliers - Impact of key factors in 2024 and 2029
- 7.4 Threat of new entrants
- Threat of new entrants - Impact of key factors in 2024 and 2029
- 7.5 Threat of substitutes
- Threat of substitutes - Impact of key factors in 2024 and 2029
- 7.6 Threat of rivalry
- Threat of rivalry - Impact of key factors in 2024 and 2029
- 7.7 Market condition
- Chart on Market condition - Five forces 2024 and 2029
8 Market Segmentation by Product
- 8.1 Market segments
- Chart on Product - Market share 2024-2029 (%)
- Data Table on Product - Market share 2024-2029 (%)
- 8.2 Comparison by Product
- Chart on Comparison by Product
- Data Table on Comparison by Product
- 8.3 Oncology - Market size and forecast 2024-2029
- Chart on Oncology - Market size and forecast 2024-2029 ($ million)
- Data Table on Oncology - Market size and forecast 2024-2029 ($ million)
- Chart on Oncology - Year-over-year growth 2024-2029 (%)
- Data Table on Oncology - Year-over-year growth 2024-2029 (%)
- 8.4 Neurology - Market size and forecast 2024-2029
- Chart on Neurology - Market size and forecast 2024-2029 ($ million)
- Data Table on Neurology - Market size and forecast 2024-2029 ($ million)
- Chart on Neurology - Year-over-year growth 2024-2029 (%)
- Data Table on Neurology - Year-over-year growth 2024-2029 (%)
- 8.5 Immunology - Market size and forecast 2024-2029
- Chart on Immunology - Market size and forecast 2024-2029 ($ million)
- Data Table on Immunology - Market size and forecast 2024-2029 ($ million)
- Chart on Immunology - Year-over-year growth 2024-2029 (%)
- Data Table on Immunology - Year-over-year growth 2024-2029 (%)
- 8.6 Market opportunity by Product
- Market opportunity by Product ($ million)
- Data Table on Market opportunity by Product ($ million)
9 Market Segmentation by Type
- 9.1 Market segments
- Chart on Type - Market share 2024-2029 (%)
- Data Table on Type - Market share 2024-2029 (%)
- 9.2 Comparison by Type
- Chart on Comparison by Type
- Data Table on Comparison by Type
- 9.3 First generation - Market size and forecast 2024-2029
- Chart on First generation - Market size and forecast 2024-2029 ($ million)
- Data Table on First generation - Market size and forecast 2024-2029 ($ million)
- Chart on First generation - Year-over-year growth 2024-2029 (%)
- Data Table on First generation - Year-over-year growth 2024-2029 (%)
- 9.4 Second generation - Market size and forecast 2024-2029
- Chart on Second generation - Market size and forecast 2024-2029 ($ million)
- Data Table on Second generation - Market size and forecast 2024-2029 ($ million)
- Chart on Second generation - Year-over-year growth 2024-2029 (%)
- Data Table on Second generation - Year-over-year growth 2024-2029 (%)
- 9.5 Third generation - Market size and forecast 2024-2029
- Chart on Third generation - Market size and forecast 2024-2029 ($ million)
- Data Table on Third generation - Market size and forecast 2024-2029 ($ million)
- Chart on Third generation - Year-over-year growth 2024-2029 (%)
- Data Table on Third generation - Year-over-year growth 2024-2029 (%)
- 9.6 Market opportunity by Type
- Market opportunity by Type ($ million)
- Data Table on Market opportunity by Type ($ million)
10 Market Segmentation by End-user
- 10.1 Market segments
- Chart on End-user - Market share 2024-2029 (%)
- Data Table on End-user - Market share 2024-2029 (%)
- 10.2 Comparison by End-user
- Chart on Comparison by End-user
- Data Table on Comparison by End-user
- 10.3 Hospitals and clinics - Market size and forecast 2024-2029
- Chart on Hospitals and clinics - Market size and forecast 2024-2029 ($ million)
- Data Table on Hospitals and clinics - Market size and forecast 2024-2029 ($ million)
- Chart on Hospitals and clinics - Year-over-year growth 2024-2029 (%)
- Data Table on Hospitals and clinics - Year-over-year growth 2024-2029 (%)
- 10.4 Academic and research institutions - Market size and forecast 2024-2029
- Chart on Academic and research institutions - Market size and forecast 2024-2029 ($ million)
- Data Table on Academic and research institutions - Market size and forecast 2024-2029 ($ million)
- Chart on Academic and research institutions - Year-over-year growth 2024-2029 (%)
- Data Table on Academic and research institutions - Year-over-year growth 2024-2029 (%)
- 10.5 Contract research organizations - Market size and forecast 2024-2029
- Chart on Contract research organizations - Market size and forecast 2024-2029 ($ million)
- Data Table on Contract research organizations - Market size and forecast 2024-2029 ($ million)
- Chart on Contract research organizations - Year-over-year growth 2024-2029 (%)
- Data Table on Contract research organizations - Year-over-year growth 2024-2029 (%)
- 10.6 Market opportunity by End-user
- Market opportunity by End-user ($ million)
- Data Table on Market opportunity by End-user ($ million)
11 Market Segmentation by Drug Class
- 11.1 Market segments
- Chart on Drug Class - Market share 2024-2029 (%)
- Data Table on Drug Class - Market share 2024-2029 (%)
- 11.2 Comparison by Drug Class
- Chart on Comparison by Drug Class
- Data Table on Comparison by Drug Class
- 11.3 Rituximab - Market size and forecast 2024-2029
- Chart on Rituximab - Market size and forecast 2024-2029 ($ million)
- Data Table on Rituximab - Market size and forecast 2024-2029 ($ million)
- Chart on Rituximab - Year-over-year growth 2024-2029 (%)
- Data Table on Rituximab - Year-over-year growth 2024-2029 (%)
- 11.4 Ofatumumab - Market size and forecast 2024-2029
- Chart on Ofatumumab - Market size and forecast 2024-2029 ($ million)
- Data Table on Ofatumumab - Market size and forecast 2024-2029 ($ million)
- Chart on Ofatumumab - Year-over-year growth 2024-2029 (%)
- Data Table on Ofatumumab - Year-over-year growth 2024-2029 (%)
- 11.5 Obinutuzumab - Market size and forecast 2024-2029
- Chart on Obinutuzumab - Market size and forecast 2024-2029 ($ million)
- Data Table on Obinutuzumab - Market size and forecast 2024-2029 ($ million)
- Chart on Obinutuzumab - Year-over-year growth 2024-2029 (%)
- Data Table on Obinutuzumab - Year-over-year growth 2024-2029 (%)
- 11.6 Ublituximab - Market size and forecast 2024-2029
- Chart on Ublituximab - Market size and forecast 2024-2029 ($ million)
- Data Table on Ublituximab - Market size and forecast 2024-2029 ($ million)
- Chart on Ublituximab - Year-over-year growth 2024-2029 (%)
- Data Table on Ublituximab - Year-over-year growth 2024-2029 (%)
- 11.7 Others - Market size and forecast 2024-2029
- Chart on Others - Market size and forecast 2024-2029 ($ million)
- Data Table on Others - Market size and forecast 2024-2029 ($ million)
- Chart on Others - Year-over-year growth 2024-2029 (%)
- Data Table on Others - Year-over-year growth 2024-2029 (%)
- 11.8 Market opportunity by Drug Class
- Market opportunity by Drug Class ($ million)
- Data Table on Market opportunity by Drug Class ($ million)
12 Market Segmentation by Route of Administration
- 12.1 Market segments
- Chart on Route of Administration - Market share 2024-2029 (%)
- Data Table on Route of Administration - Market share 2024-2029 (%)
- 12.2 Comparison by Route of Administration
- Chart on Comparison by Route of Administration
- Data Table on Comparison by Route of Administration
- 12.3 Intravenous - Market size and forecast 2024-2029
- Chart on Intravenous - Market size and forecast 2024-2029 ($ million)
- Data Table on Intravenous - Market size and forecast 2024-2029 ($ million)
- Chart on Intravenous - Year-over-year growth 2024-2029 (%)
- Data Table on Intravenous - Year-over-year growth 2024-2029 (%)
- 12.4 Subcutaneous - Market size and forecast 2024-2029
- Chart on Subcutaneous - Market size and forecast 2024-2029 ($ million)
- Data Table on Subcutaneous - Market size and forecast 2024-2029 ($ million)
- Chart on Subcutaneous - Year-over-year growth 2024-2029 (%)
- Data Table on Subcutaneous - Year-over-year growth 2024-2029 (%)
- 12.5 Market opportunity by Route of Administration
- Market opportunity by Route of Administration ($ million)
- Data Table on Market opportunity by Route of Administration ($ million)
13 Customer Landscape
- 13.1 Customer landscape overview
- Analysis of price sensitivity, lifecycle, customer purchase basket, adoption rates, and purchase criteria
14 Geographic Landscape
- 14.1 Geographic segmentation
- Chart on Market share by geography 2024-2029 (%)
- Data Table on Market share by geography 2024-2029 (%)
- 14.2 Geographic comparison
- Chart on Geographic comparison
- Data Table on Geographic comparison
- 14.3 North America - Market size and forecast 2024-2029
- Chart on North America - Market size and forecast 2024-2029 ($ million)
- Data Table on North America - Market size and forecast 2024-2029 ($ million)
- Chart on North America - Year-over-year growth 2024-2029 (%)
- Data Table on North America - Year-over-year growth 2024-2029 (%)
- 14.4 Europe - Market size and forecast 2024-2029
- Chart on Europe - Market size and forecast 2024-2029 ($ million)
- Data Table on Europe - Market size and forecast 2024-2029 ($ million)
- Chart on Europe - Year-over-year growth 2024-2029 (%)
- Data Table on Europe - Year-over-year growth 2024-2029 (%)
- 14.5 Asia - Market size and forecast 2024-2029
- Chart on Asia - Market size and forecast 2024-2029 ($ million)
- Data Table on Asia - Market size and forecast 2024-2029 ($ million)
- Chart on Asia - Year-over-year growth 2024-2029 (%)
- Data Table on Asia - Year-over-year growth 2024-2029 (%)
- 14.6 Rest of World (ROW) - Market size and forecast 2024-2029
- Chart on Rest of World (ROW) - Market size and forecast 2024-2029 ($ million)
- Data Table on Rest of World (ROW) - Market size and forecast 2024-2029 ($ million)
- Chart on Rest of World (ROW) - Year-over-year growth 2024-2029 (%)
- Data Table on Rest of World (ROW) - Year-over-year growth 2024-2029 (%)
- 14.7 US - Market size and forecast 2024-2029
- Chart on US - Market size and forecast 2024-2029 ($ million)
- Data Table on US - Market size and forecast 2024-2029 ($ million)
- Chart on US - Year-over-year growth 2024-2029 (%)
- Data Table on US - Year-over-year growth 2024-2029 (%)
- 14.8 Canada - Market size and forecast 2024-2029
- Chart on Canada - Market size and forecast 2024-2029 ($ million)
- Data Table on Canada - Market size and forecast 2024-2029 ($ million)
- Chart on Canada - Year-over-year growth 2024-2029 (%)
- Data Table on Canada - Year-over-year growth 2024-2029 (%)
- 14.9 China - Market size and forecast 2024-2029
- Chart on China - Market size and forecast 2024-2029 ($ million)
- Data Table on China - Market size and forecast 2024-2029 ($ million)
- Chart on China - Year-over-year growth 2024-2029 (%)
- Data Table on China - Year-over-year growth 2024-2029 (%)
- 14.10 UK - Market size and forecast 2024-2029
- Chart on UK - Market size and forecast 2024-2029 ($ million)
- Data Table on UK - Market size and forecast 2024-2029 ($ million)
- Chart on UK - Year-over-year growth 2024-2029 (%)
- Data Table on UK - Year-over-year growth 2024-2029 (%)
- 14.11 Germany - Market size and forecast 2024-2029
- Chart on Germany - Market size and forecast 2024-2029 ($ million)
- Data Table on Germany - Market size and forecast 2024-2029 ($ million)
- Chart on Germany - Year-over-year growth 2024-2029 (%)
- Data Table on Germany - Year-over-year growth 2024-2029 (%)
- 14.12 Japan - Market size and forecast 2024-2029
- Chart on Japan - Market size and forecast 2024-2029 ($ million)
- Data Table on Japan - Market size and forecast 2024-2029 ($ million)
- Chart on Japan - Year-over-year growth 2024-2029 (%)
- Data Table on Japan - Year-over-year growth 2024-2029 (%)
- 14.13 India - Market size and forecast 2024-2029
- Chart on India - Market size and forecast 2024-2029 ($ million)
- Data Table on India - Market size and forecast 2024-2029 ($ million)
- Chart on India - Year-over-year growth 2024-2029 (%)
- Data Table on India - Year-over-year growth 2024-2029 (%)
- 14.14 Italy - Market size and forecast 2024-2029
- Chart on Italy - Market size and forecast 2024-2029 ($ million)
- Data Table on Italy - Market size and forecast 2024-2029 ($ million)
- Chart on Italy - Year-over-year growth 2024-2029 (%)
- Data Table on Italy - Year-over-year growth 2024-2029 (%)
- 14.15 France - Market size and forecast 2024-2029
- Chart on France - Market size and forecast 2024-2029 ($ million)
- Data Table on France - Market size and forecast 2024-2029 ($ million)
- Chart on France - Year-over-year growth 2024-2029 (%)
- Data Table on France - Year-over-year growth 2024-2029 (%)
- 14.16 South Korea - Market size and forecast 2024-2029
- Chart on South Korea - Market size and forecast 2024-2029 ($ million)
- Data Table on South Korea - Market size and forecast 2024-2029 ($ million)
- Chart on South Korea - Year-over-year growth 2024-2029 (%)
- Data Table on South Korea - Year-over-year growth 2024-2029 (%)
- 14.17 Market opportunity by geography
- Market opportunity by geography ($ million)
- Data Tables on Market opportunity by geography ($ million)
15 Drivers, Challenges, and Opportunity/Restraints
- 15.3 Impact of drivers and challenges
- Impact of drivers and challenges in 2024 and 2029
- 15.4 Market opportunities/restraints
16 Competitive Landscape
- 16.2 Competitive Landscape
- Overview on criticality of inputs and factors of differentiation
- 16.3 Landscape disruption
- Overview on factors of disruption
- 16.4 Industry risks
- Impact of key risks on business
17 Competitive Analysis
- 17.2 Company ranking index
- 17.3 Market positioning of companies
- Matrix on companies position and classification
- 17.4 Acrotech Biopharma Inc.
- Acrotech Biopharma Inc. - Overview
- Acrotech Biopharma Inc. - Product / Service
- Acrotech Biopharma Inc. - Key offerings
- SWOT
- 17.5 Amgen Inc.
- Amgen Inc. - Overview
- Amgen Inc. - Product / Service
- Amgen Inc. - Key news
- Amgen Inc. - Key offerings
- SWOT
- 17.6 AstraZeneca Plc
- AstraZeneca Plc - Overview
- AstraZeneca Plc - Product / Service
- AstraZeneca Plc - Key news
- AstraZeneca Plc - Key offerings
- SWOT
- 17.7 Celltrion Healthcare Co. Ltd.
- Celltrion Healthcare Co. Ltd. - Overview
- Celltrion Healthcare Co. Ltd. - Business segments
- Celltrion Healthcare Co. Ltd. - Key offerings
- Celltrion Healthcare Co. Ltd. - Segment focus
- SWOT
- 17.8 F. Hoffmann La Roche Ltd.
- F. Hoffmann La Roche Ltd. - Overview
- F. Hoffmann La Roche Ltd. - Business segments
- F. Hoffmann La Roche Ltd. - Key news
- F. Hoffmann La Roche Ltd. - Key offerings
- F. Hoffmann La Roche Ltd. - Segment focus
- SWOT
- 17.9 Fosun International Ltd.
- Fosun International Ltd. - Overview
- Fosun International Ltd. - Business segments
- Fosun International Ltd. - Key offerings
- Fosun International Ltd. - Segment focus
- SWOT
- 17.10 Genmab AS
- Genmab AS - Overview
- Genmab AS - Product / Service
- Genmab AS - Key offerings
- SWOT
- 17.11 IGM Biosciences Inc.
- IGM Biosciences Inc. - Overview
- IGM Biosciences Inc. - Product / Service
- IGM Biosciences Inc. - Key offerings
- SWOT
- 17.12 JSC BIOCAD
- JSC BIOCAD - Overview
- JSC BIOCAD - Product / Service
- JSC BIOCAD - Key offerings
- SWOT
- 17.13 LFB SA
- LFB SA - Overview
- LFB SA - Product / Service
- LFB SA - Key offerings
- SWOT
- 17.14 Novartis AG
- Novartis AG - Overview
- Novartis AG - Business segments
- Novartis AG - Key news
- Novartis AG - Key offerings
- Novartis AG - Segment focus
- SWOT
- 17.15 Pfizer Inc.
- Pfizer Inc. - Overview
- Pfizer Inc. - Product / Service
- Pfizer Inc. - Key news
- Pfizer Inc. - Key offerings
- SWOT
- 17.16 Regeneron Pharmaceuticals Inc.
- Regeneron Pharmaceuticals Inc. - Overview
- Regeneron Pharmaceuticals Inc. - Product / Service
- Regeneron Pharmaceuticals Inc. - Key offerings
- SWOT
- 17.17 Spectrum Pharmaceuticals Inc.
- Spectrum Pharmaceuticals Inc. - Overview
- Spectrum Pharmaceuticals Inc. - Product / Service
- Spectrum Pharmaceuticals Inc. - Key offerings
- SWOT
- 17.18 TG Therapeutics Inc.
- TG Therapeutics Inc. - Overview
- TG Therapeutics Inc. - Product / Service
- TG Therapeutics Inc. - Key offerings
- SWOT
18 Appendix
- 18.2 Inclusions and exclusions checklist
- Inclusions checklist
- Exclusions checklist
- 18.3 Currency conversion rates for US$
- Currency conversion rates for US$
- 18.4 Research methodology
- 18.7 Validation techniques employed for market sizing
- Validation techniques employed for market sizing
- 18.9 360 degree market analysis
- 360 degree market analysis
- 18.10 List of abbreviations