
Anti-Cellulite Care Products Market Size 2025-2029
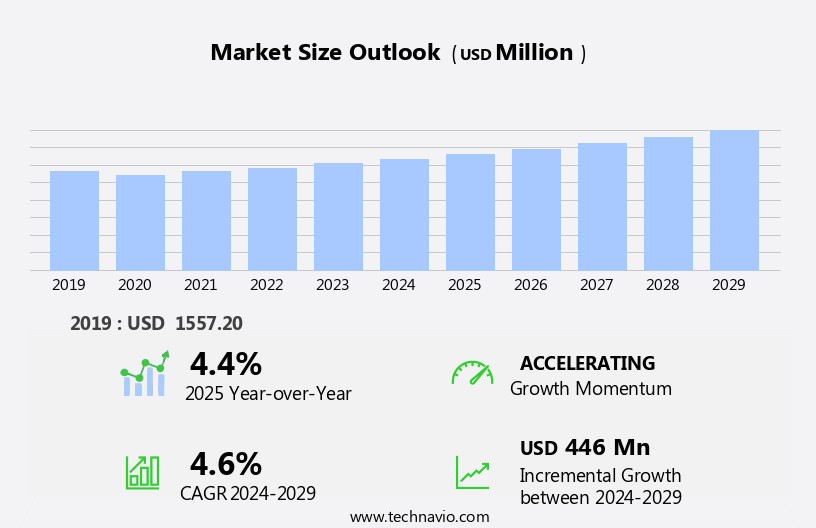
The anti-cellulite care products market size is forecast to increase by USD 446 million at a CAGR of 4.6% between 2024 and 2029.
- The market is witnessing significant growth due to several key trends. One of the primary factors driving market growth is the increasing awareness of myths surrounding surgical and non-surgical procedures for reducing cellulite. Consumers are increasingly opting for non-invasive solutions, leading to an increase in demand for topical anti-cellulite care products. Moreover, the integration of these treatments into mainstream healthcare, health and wellness practices is expected to boost market growth. Another trend influencing market growth is the preference for natural and organic products. As a result, exfoliators and body scrubs in the Body Scrub Market and the Exfoliators and Scrubs Market are gaining popularity. Additionally, the Non-surgical Cosmetic Procedures Market is expanding, providing further opportunities for the market. Overall, these trends are expected to continue, fueling market growth in the coming years.
What will be the Size of the Anti-Cellulite Care Products Market During the Forecast Period?
- The market encompasses a range of topical and non-invasive treatments designed to address the appearance of cellulite, a common condition characterized by the presence of subcutaneous fat, connective tissue, and water retention. The market is driven by the growing demand for personal appearance enhancement and the increasing prevalence of obesity worldwide. The non-invasive treatment segment, which includes radiofrequency therapy and mesotherapy, is gaining popularity due to its non-surgical nature and minimal downtime. Technological advancements, such as the use of radiofrequency waves and ultrasound devices, are driving innovation in the market. The topical treatment segment, which includes creams, lotions, and serums, continues to be a significant contributor to the market, with an increasing focus on product efficacy and safety.
- Non-organic products are also gaining traction due to their affordability and ease of access. The market is expected to grow steadily, with the healthcare industry, medical tourism industry, and C3 Organization among the key players driving demand. The market caters to both soft and hard cellulite, with edematous cellulite and minimally invasive treatments also gaining attention. Technological advancements, such as the use of lasers and retinol creams, are further expanding the market's scope.
How is this Anti-Cellulite Care Products Industry segmented and which is the largest segment?
The anti-cellulite care products industry research report provides comprehensive data (region-wise segment analysis), with forecasts and estimates in "USD million" for the period 2025-2029, as well as historical data from 2019-2023 for the following segments.
- Product
- Topical
- Non-invasive
- Distribution Channel
- Offline
- Online
- Type
- Creams and gels
- Serums and oils
- Body wraps and masks
- Supplements and pills
- Formulation
- Organic
- Natural
- Geography
- Europe
- Germany
- UK
- France
- Italy
- APAC
- China
- India
- Japan
- North America
- Canada
- US
- South America
- Middle East and Africa
- Europe
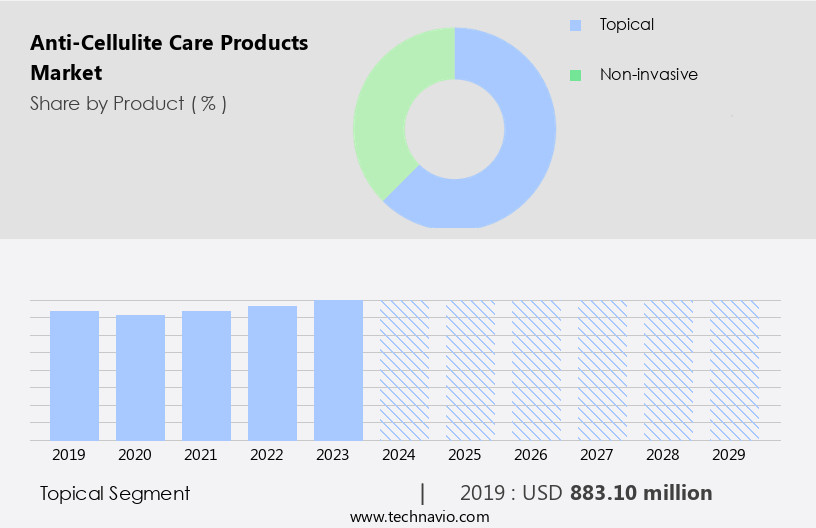
By Product Insights
- The topical segment is estimated to witness significant growth during the forecast period.
The anti-cellulite care market encompasses topical treatments, including lotions, creams, and gels, used to reduce the appearance of cellulite on various body parts such as thighs, buttocks, and hips. These products contain ingredients with medicinal and cosmetic properties that help repair damaged skin cells and slow down signs of aging. The anti-cellulite gel, a non-oily, jelly-like formulation, is popular due to its fast-absorbing nature. Some variants cater to dry skin and contribute to cellulite reduction. The non-invasive treatment segment, which includes radiofrequency waves, ultrasound devices, and mesotherapy, is gaining traction in the healthcare and personal care industries. Technologies like Sentient Sculpt and AirSculpt Smooth, which employ radiofrequency therapy, have emerged as effective alternatives to invasive procedures.
Get a glance at the Anti-Cellulite Care Products Industry report of share of various segments Request Free Sample
The topical segment was valued at USD 883.10 million in 2019 and showed a gradual increase during the forecast period.
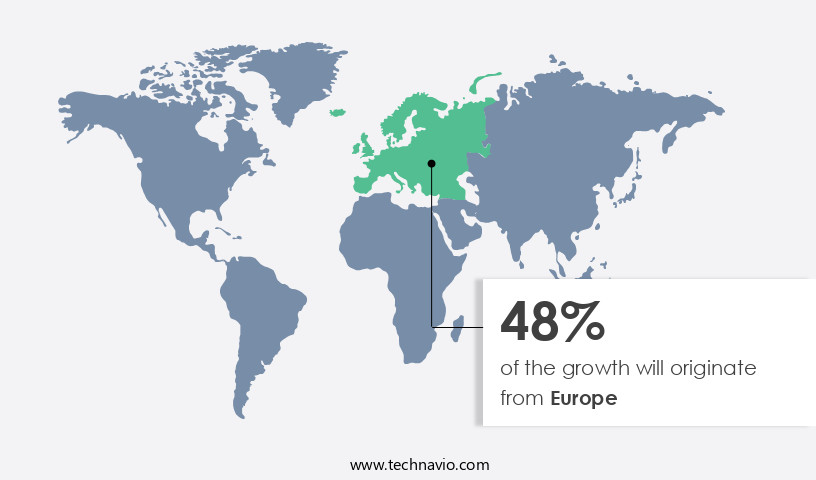
Regional Analysis
- Europe is estimated to contribute 48% to the growth of the global market during the forecast period.
Technavio's analysts have elaborately explained the regional trends and drivers that shape the market during the forecast period.
For more insights on the market share of various regions, Request Free Sample
The European market holds the largest share in the global anti-cellulite care products industry, driven by the increasing demand for premium and multifunctional anti-cellulite products. Factors such as rising health and beauty consciousness, product awareness, and frequent new product launches are fueling market growth. Major European countries, including the UK, France, Italy, and Germany, accounted for significant revenue shares in 2021. Non-invasive treatments, such as radiofrequency therapy and ultrasound devices, dominate the market, with topical treatments, including retinol creams and massage, also gaining popularity. Social media influencers and the healthcare, personal care, and medical tourism industries are further propelling market expansion.
Market Dynamics
Our researchers analyzed the data with 2024 as the base year, along with the key drivers, trends, and challenges. A holistic analysis of drivers will help companies refine their marketing strategies to gain a competitive advantage.
What are the key market drivers leading to the rise in the adoption of Anti-Cellulite Care Products Industry?
Rising awareness of myths about surgical and non-surgical procedures to reduce cellulite is the key driver of the market.
- The cellulite treatment market encompasses various methods to address unwanted cellulite, with social media influencers promoting both surgical and non-surgical options. Surgical procedures like mesotherapy involve multiple injections to infuse solutions into subcutaneous fat, aiming to reduce cellulite. However, these treatments may lead to harmful side effects, such as infections and uneven skin texture. Non-invasive treatments, such as radiofrequency therapy and ultrasound devices, have gained popularity due to their minimal risk and non-surgical nature. Topical treatments, including retinol creams and anti-cellulite massage, are also prevalent in the market. Non-organic products dominate the topical category, while non-invasive treatments like AirSculpt Smooth and Radiofrequency therapy utilize technology to improve personal appearance.
- The healthcare industry, including hospitals and medical tourism, offers these treatments, while product innovation continues to drive the market. Obesity is a significant factor contributing to cellulite development, with Edematous Cellulite affecting both soft and hard areas like thighs, hips, and buttocks. Minimally invasive treatments, such as mesotherapy, continue to be popular despite their risks. The market is expected to grow as consumers seek effective solutions for cellulite reduction.
What are the market trends shaping the Anti-Cellulite Care Products Industry?
Adoption of natural and organic topical anti-cellulite care products is the upcoming market trend.
- The anti-cellulite care market is witnessing a significant shift towards natural and organic products due to growing consumer awareness and preference for safer alternatives. Traditional anti-cellulite care products, which primarily consist of synthetic ingredients, have raised concerns regarding potential harm to the skin. In response, leading manufacturers like L'Oreal Group and Unilever are introducing natural and organic anti-cellulite care products to cater to this emerging trend. These products, which are free from harmful chemicals, are gaining popularity among consumers who prioritize personal appearance and health. Two notable competitors in this space are Amarya and Pure Original, which already offer natural and organic anti-cellulite care solutions.
- The non-invasive treatment segment, which includes topical treatments and technologies like radiofrequency therapy and ultrasound devices, is expected to dominate the market. Furthermore, the non-organic topical category continues to hold a substantial market share, driven by the availability of a wide range of products and their affordability. The anti-cellulite care market encompasses various treatments, including non-invasive treatments like mesotherapy and minimally invasive procedures like AirSculpt Smooth and Really Cellulite. Obesity is a significant factor contributing to the demand for these products, with cellulite being a common issue for individuals in the healthcare, personal care, and medical tourism industries. As technology continues to advance, product innovation is expected to remain a key driver in the market.
What challenges does the Anti-Cellulite Care Products Industry face during its growth?
Adoption of invasive cellulite treatments is a key challenge affecting the industry growth.
- The market encompasses various options for consumers seeking to reduce the appearance of cellulite. While non-invasive and topical treatments, such as radiofrequency therapy and topical creams, are popular due to their accessibility and affordability, invasive treatments also hold significance among certain demographics. These treatments, often administered in medical settings, employ energy from lasers, radio waves, and ultrasound devices to target cellulite. Invasive treatments promise long-lasting results, making them a preferred choice for those willing to invest in more extensive procedures. Despite the time and cost involved, the strict regulations governing invasive treatments ensure a degree of safety and efficacy.
- The healthcare and medical tourism industries continue to drive innovation in cellulite treatment technologies, with non-organic and minimally invasive solutions gaining traction. Cellulite, typically found on the thighs, buttocks, and hips, impacts personal appearance and self-confidence. Understanding the market dynamics and available treatments, including Mesotherapy, Sentient Sculpt, AirSculpt Smooth, Really Cellulite, and others, can help individuals make informed decisions about their cellulite treatment options.
Exclusive Customer Landscape
The anti-cellulite care products market forecasting report includes the adoption lifecycle of the market, covering from the innovator's stage to the laggard's stage. It focuses on adoption rates in different regions based on penetration. Furthermore, the anti-cellulite care products market report also includes key purchase criteria and drivers of price sensitivity to help companies evaluate and develop their market growth analysis strategies.
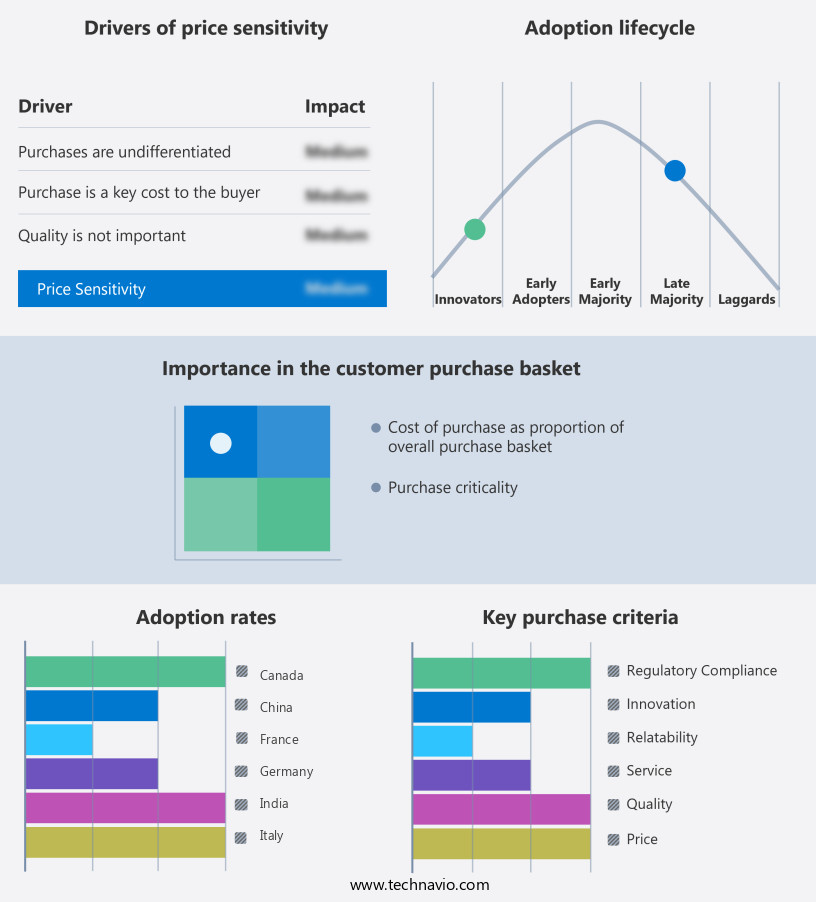
Customer Landscape
Key Companies & Market Insights
Companies are implementing various strategies, such as strategic alliances, anti-cellulite care products market forecast, partnerships, mergers and acquisitions, geographical expansion, and product/service launches, to enhance their presence in the industry.
ALPHANOVA - The company offers anti-cellulite care products, namely Alphanova Sante Minceur and Cellulite.
The industry research and growth report includes detailed analyses of the competitive landscape of the market and information about key companies, including:
- Beiersdorf AG
- Botanic Tree
- Clarins UK Ltd.
- E.T. Browne Drug Co. Inc.
- Elancyl Laboratoire
- Jan Marini Skin Research
- LABORATOIRES Dr. N.G. PAYOT
- LOreal SA
- LPG SYSTEMS
- New York Biology
- PEP Technologies Pvt. Ltd.
- Puressentiel UK Ltd.
- Shiseido Co. Ltd.
- SISLEY
- Skincode AG
- Supreme Sourcing LLC
- The Seaweed Bath Co.
- Unilever PLC
- Weleda Group
Qualitative and quantitative analysis of companies has been conducted to help clients understand the wider business environment as well as the strengths and weaknesses of key industry players. Data is qualitatively analyzed to categorize companies as pure play, category-focused, industry-focused, and diversified; it is quantitatively analyzed to categorize companies as dominant, leading, strong, tentative, and weak.
Research Analyst Overview
The market represents a significant segment within the broader personal care and healthcare industries. This market caters to consumers seeking solutions for the appearance of cellulite, a condition characterized by the presence of subcutaneous fat, connective tissue, and water retention, resulting in noticeable dimpling and uneven skin texture. The market is driven by various factors, including the increasing awareness of personal appearance and body image, advancements in technology, and the growing preference for non-invasive treatments. Two primary segments within this market are topical treatments and non-invasive treatments. Topical treatments, which include creams, lotions, and gels, are widely used due to their convenience and affordability.
In addition, these products often contain ingredients such as caffeine, retinol, and herbal extracts, which are believed to help reduce the appearance of cellulite. The innovation and development of new topical treatments continue to fuel market growth. Non-invasive treatments, on the other hand, offer more immediate and noticeable results. These treatments employ various technologies, such as radiofrequency waves, ultrasound devices, and mesotherapy, to target and eliminate cellulite. Among the popular non-invasive treatments are radiofrequency therapy and mesotherapy. The rise of social media influencers has also contributed to the growth of the market. Influencers often promote and endorse products, driving consumer interest and demand.
However, it is essential to note that not all products endorsed by influencers are effective or safe. The market for anti-cellulite care products is diverse and competitive, with offerings ranging from organic to non-organic products. Consumers' preferences and concerns, such as the safety and efficacy of products, play a crucial role in shaping market trends. The obesity rate, a significant contributor to cellulite development, continues to be a concern worldwide. The increasing prevalence of obesity, coupled with the growing awareness of the health risks associated with it, is expected to further fuel demand for anti-cellulite care products. The healthcare industry and medical tourism industry have also shown interest in anti-cellulite care products and treatments, as they offer an alternative to invasive surgical procedures. The market comprises both topical and non-invasive treatments, with ongoing innovation and development shaping its future. Consumer education and safety remain essential considerations as the market continues to evolve.
|
Market Scope |
|
|
Report Coverage |
Details |
|
Page number |
232 |
|
Base year |
2024 |
|
Historic period |
2019-2023 |
|
Forecast period |
2025-2029 |
|
Growth momentum & CAGR |
Accelerate at a CAGR of 4.6% |
|
Market growth 2025-2029 |
USD 446 million |
|
Market structure |
Fragmented |
|
YoY growth 2024-2025(%) |
4.4 |
|
Key countries |
US, China, UK, Japan, Germany, Italy, Canada, India, The Netherlands, and France |
|
Competitive landscape |
Leading Companies, market growth and forecasting, Market Positioning of Companies, Competitive Strategies, and Industry Risks |
What are the Key Data Covered in this Anti-Cellulite Care Products Market Research and Growth Report?
- CAGR of the Anti-Cellulite Care Products industry during the forecast period
- Detailed information on factors that will drive the growth and forecasting between 2025 and 2029
- Precise estimation of the size of the market and its contribution of the industry in focus to the parent market
- Accurate predictions about upcoming growth and trends and changes in consumer behaviour
- Growth of the market across Europe, APAC, North America, South America, and Middle East and Africa
- Thorough analysis of the market's competitive landscape and detailed information about companies
- Comprehensive analysis of factors that will challenge the anti-cellulite care products market growth of industry companies
We can help! Our analysts can customize this anti-cellulite care products market research report to meet your requirements.