
Anti-Venom Market Size 2024-2028
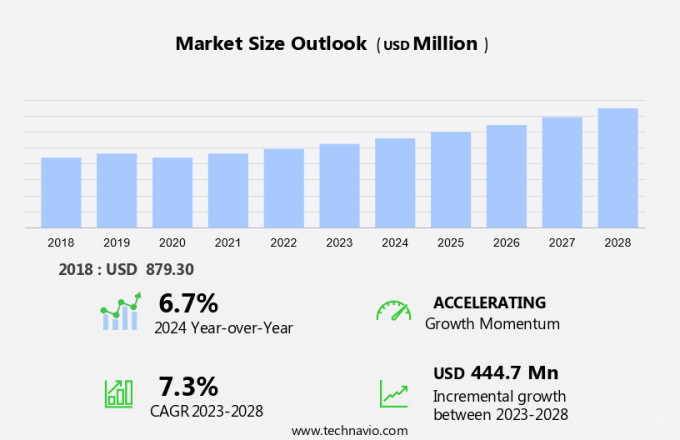
The anti-venom market size is forecast to increase by USD 444.7 million at a CAGR of 7.3% between 2023 and 2028.
- The market is driven by several factors, including the high prevalence of venomous bites and stings, which pose a significant health risk, particularly in exotic destinations. Unmet medical needs in healthcare continue to fuel the demand for effective anti-venoms. However, the high cost of available anti-venoms remains a challenge for both manufacturers and consumers. Advancements in biotechnology have led to the development of new antivenom types, such as polyvalent and monovalent antivenoms. These antivenoms offer improved efficacy and specificity against various venom types, including those that are cytotoxic and neurotoxic. Enzyme immunoassay, a diagnostic technique, is used to identify the presence and quantify the amount of venom in a patient's blood, aiding in the timely administration of antivenom.
- Moreover, understanding the unique insights of different venomous species is crucial for the development of effective antivenoms. Manufacturers are investing in research and development to create antivenoms that cater to the specific needs of various venomous species and their venoms. This focus on species-specific antivenoms is expected to drive market growth in the coming years. In summary, the market is driven by the high prevalence of venomous bites and stings, unmet medical needs, and advancements in biotechnology. The development of new antivenom types, such as polyvalent and monovalent antivenoms, and the focus on species-specific antivenoms are key trends in the market. The high cost of available antivenoms remains a challenge, but ongoing research and development efforts are expected to address this issue and drive market growth.
What will be the Size of the Market During the Forecast Period?
- The market holds substantial importance in the healthcare industry, catering to the increasing number of venomous bites and stings caused by various animals such as snakes, spiders, scorpions, marine creatures, jellyfish, cone snails, and other venomous species. These attacks can result in medical emergencies, leading to significant morbidity and mortality rates. Medical research continues to advance in the development of anti-venom medications to treat these venomous bites and stings. The market for anti-venom is segmented into monovalent and polyvalent antivenoms. Monovalent antivenoms are designed to treat specific venomous species, while polyvalent antivenoms offer protection against multiple venomous species. These attacks can result in medical service emergencies, leading to significant morbidity and mortality rates.
- Moreover, the healthcare sector is the primary consumer of anti-venom, with clinics and hospitals being the major buyers. The demand for anti-venom is driven by the increasing number of animal attacks, the need for effective treatments, and the rising awareness of snake bite avoidance. Biotechnology plays a crucial role in the production of anti-venom. The process involves the extraction of venom from the animals and the use of specific antibodies to neutralize the venom. This results in the production of effective anti-venom medications. The market is expected to witness steady growth due to the increasing number of venomous bites and stings and the need for effective treatments.
- According to the Centers for Disease Control and Prevention (CDC), an estimated 7,000-8,000 people in the US are bitten by venomous snakes each year, and about 5-10 people die from these bites. The availability of snake bite helplines and the increasing awareness of the importance of seeking medical attention after a venomous bite or sting are expected to boost the demand for anti-venom. The market is also expected to benefit from the development of new and improved anti-venom medications that offer better efficacy and fewer side effects. In conclusion, the market holds significant importance in the healthcare industry, catering to the increasing number of venomous bites and stings caused by various animals.
- In conclusion, the market is expected to witness steady growth due to the need for effective treatments and the increasing awareness of the importance of seeking medical attention after a venomous bite or sting. Biotechnology plays a crucial role in the production of anti-venom, and the market is expected to benefit from the development of new and improved anti-venom medications.
How is this market segmented and which is the largest segment?
The market research report provides comprehensive data (region-wise segment analysis), with forecasts and estimates in "USD million" for the period 2024-2028, as well as historical data from 2018-2022 for the following segments.
- Type
- Polyvalent anti-venoms
- Monovalent anti-venoms
- Others
- Geography
- North America
- Canada
- US
- Asia
- China
- India
- Japan
- South Korea
- Europe
- Germany
- UK
- France
- Italy
- Rest of World (ROW)
- North America
By Type Insights
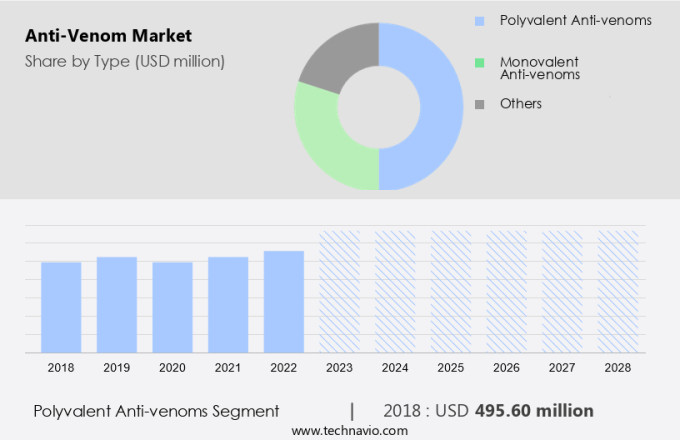
- The polyvalent anti-venoms segment is estimated to witness significant growth during the forecast period.
The market plays a vital role in addressing snake bite emergencies by providing effective treatments against venomous snake bites and other venomous creatures. In the US, where various venomous snake species pose a threat, the demand for anti-venoms is significant. Polyvalent anti-venoms, which neutralize venoms from multiple snake species, are particularly beneficial in regions with diverse and often unidentified venomous snakes. These anti-venoms save lives by offering broad-spectrum efficacy, enabling treatment even when the specific venom is uncertain.
Moreover, the preference for polyvalent anti-venoms is growing due to their ability to target venoms from several snake species, making them indispensable in areas with high snakebite incidence. The segment is projected to lead the market, accounting for a substantial share due to the increasing need for efficient treatments against venomous bites. A snakebite helpline is an essential component of the healthcare infrastructure in the US, providing crucial information and guidance during medical emergencies.
Get a glance at the market report of share of various segments Request Free Sample
The polyvalent anti-venoms segment was valued at USD 495.60 million in 2018 and showed a gradual increase during the forecast period.
Regional Analysis
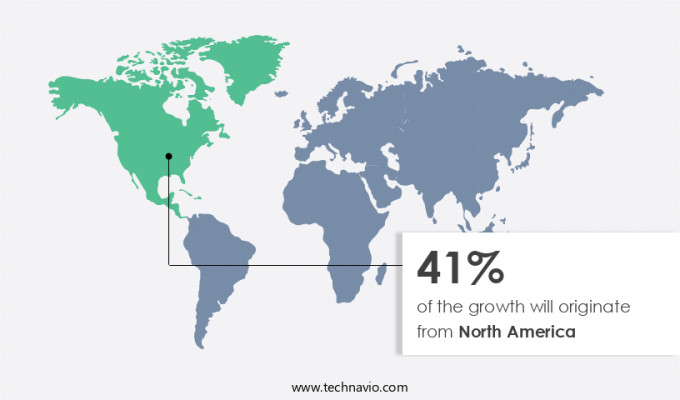
- North America is estimated to contribute 41% to the growth of the global market during the forecast period.
Technavio's analysts have elaborately explained the regional trends and drivers that shape the market during the forecast period.
For more insights on the market share of various regions Request Free Sample
In The market, North America held a significant share in 2023. Factors fueling the market expansion include the growing number of anti-venom products under development and the heightened focus on research and development initiatives by both public and private entities in the region. companies are dedicated to producing high-quality anti-venoms due to the progress in medical science and technology, which caters to the escalating demand for these life-saving treatments in North America. The United States is a key contributor, with approximately 7,000 to 8,000 venomous snake bites reported each year, resulting in a few fatalities and numerous long-term injuries. The market is witnessing substantial growth in North America due to the increasing mortality rate from snakebites. The US plays a crucial role in the market, with a substantial number of venomous snake bites occurring annually, resulting in fatalities and long-term injuries. To meet the growing demand for anti-venoms, companies are investing heavily in research and development to create high-quality products using advanced technology and medical science.
Market Dynamics
Our researchers analyzed the data with 2023 as the base year, along with the key drivers, trends, and challenges. A holistic analysis of drivers will help companies refine their marketing strategies to gain a competitive advantage.
What are the key market drivers leading to the rise in adoption of Anti-Venom Market ?
The prevalence of venomous bites and stings is the key driver of the market.
- The global market for antivenom treatments is experiencing growth due to the increasing number of venomous bites and stings from animals such as snakes, spiders, and scorpions. According to the World Health Organization (WHO), an estimated 5.4 million snakebites occur annually, leading to around 2.7 million envenomings and between 81,000 to 138,000 deaths worldwide. These statistics underscore the importance of effective anti-venom treatments, particularly in regions where venomous species are common, such as tropical and subtropical areas.
- Moreover, the rising incidence of stings from other venomous creatures, including scorpions and spiders, is also contributing to market growth. For instance, scorpion stings are a significant concern in regions like North Africa and the Middle East, where encounters with these creatures are common. Anti-venom medications are essential for treating the harmful effects of venom and saving lives. The need for these treatments is particularly urgent in areas where access to healthcare facilities is limited, making the development and availability of effective anti-venom treatments a priority.
What are the market trends shaping the Anti-Venom Market?
Unmet medical needs of anti-venom is the upcoming trend in the market.
- The market holds importance due to the significant medical need for effective treatments for venomous bites, particularly in regions with limited access to healthcare services. According to the World Health Organization, an estimated 5.4 million snakebites occur annually, resulting in around 2.7 million envenomings and substantial mortality and morbidity. The COVID-19 pandemic has worsened this issue, as healthcare systems have prioritized pandemic response over snakebite treatment, leading to increased fatalities and long-term disabilities. Moreover, the high costs of available anti-venoms pose a barrier to accessibility for vulnerable populations, making it crucial to address these unmet medical needs. Biotechnology plays a pivotal role in the development of anti-venoms, offering species insights that enable the production of effective and targeted treatments.
- Moreover, two main types of anti-venoms exist: polyvalent, which treats multiple snake species, and monovalent, which targets a single species. Understanding the specific venom type is essential for selecting the appropriate antivenom. Despite advancements in anti-venom technology, challenges remain, including the cytotoxic and neurotoxic effects of certain venoms. Enzyme immunoassay techniques are employed to detect and quantify venom components, aiding in the development of more effective and safer anti-venoms. As the demand for accessible and affordable anti-venoms grows, the market is expected to continue expanding. In conclusion, The market holds significant potential due to the substantial medical need for effective treatments for venomous bites, particularly in regions with limited access to healthcare services. Biotechnology plays a crucial role in the development of anti-venoms, and understanding venom types and their components is essential for creating targeted and effective treatments. Despite challenges, advancements in technology and the growing demand for accessible and affordable anti-venoms are expected to drive market growth.
What challenges does Anti-Venom Market face during the growth?
The high cost of available anti-venoms is a key challenge affecting the market growth.
- The market faces a significant challenge due to the high cost of available treatments. Anti-venom prices can significantly vary, with some formulations costing over USD 3,000 per vial in developed countries like the United States. This exorbitant pricing makes access to these essential therapies prohibitively expensive, particularly in low- and middle-income regions where incidents of venomous bites from snakes, jellyfish, and cone snails are common. In many cases, a single treatment may require multiple vials, leading to total costs exceeding USD 1,600. These financial burdens are further exacerbated by limited reimbursement policies in emerging markets, restricting access to these vital therapies.
- Moreover, the lack of price regulation in several countries enables manufacturers to set high prices without oversight, limiting affordability even in areas where anti-venoms are critically needed for preventing respiratory failure, organ damage, and other health complications. Agricultural workers and livestock farmers are particularly vulnerable to venomous bites and snake bites, while traveling can also increase the risk for tourists. Therefore, there is a pressing need for affordable and accessible anti-venom solutions to save lives and mitigate the health and economic consequences of venomous bites.
Exclusive Customer Landscape
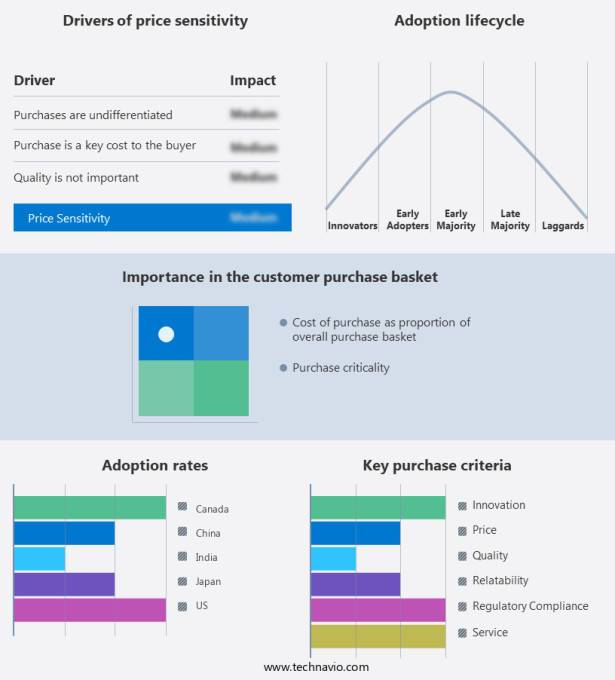
The market forecasting report includes the adoption lifecycle of the market, covering from the innovator's stage to the laggard's stage. It focuses on adoption rates in different regions based on penetration. Furthermore, the market report also includes key purchase criteria and drivers of price sensitivity to help companies evaluate and develop their market growth analysis strategies.
Customer Landscape
Key Companies & Market Insights
Companies are implementing various strategies, such as strategic alliances, market forecast, partnerships, mergers and acquisitions, geographical expansion, and product/service launches, to enhance their presence in the market.
The market research and growth report includes detailed analyses of the competitive landscape of the market and information about key companies, including:
- Bharat Serums and Vaccines Ltd.
- Biological E. Ltd.
- Boehringer Ingelheim International GmbH
- CSL Ltd.
- Haffkine Bio Pharmaceutical Corp. Ltd.
- Incepta Vaccine Ltd.
- Merck KGaA
- MicroPharm Ltd.
- Ophirex
- Pfizer Inc.
- Rare Disease Therapeutics Inc.
- SERB Sarl
- Serum Institute of India Pvt. Ltd.
- Silanes
- VINS Bioproducts Ltd.
Qualitative and quantitative analysis of companies has been conducted to help clients understand the wider business environment as well as the strengths and weaknesses of key market players. Data is qualitatively analyzed to categorize companies as pure play, category-focused, industry-focused, and diversified; it is quantitatively analyzed to categorize companies as dominant, leading, strong, tentative, and weak.
Research Analyst Overview
The antivenom market encompasses the production and distribution of venom antiserums, a crucial medication used to treat venomous bites and stings from various animals. These animals include snakes, spiders, scorpions, marine creatures such as jellyfish and cone snails, and other venomous species. Venom toxicity can lead to respiratory failure, organ damage, and even mortality in severe cases. Agricultural workers, livestock handlers, and travelers to exotic destinations are among those at highest risk. Biotechnology plays a significant role in the development of antivenom, utilizing antibodies to neutralize the toxins in venom. Two main types of antivenom exist: polyvalent, which treats multiple species, and monovalent, which targets a specific species.
In summary, the effectiveness of antivenom varies depending on the type of venom, with neurotoxic, cytotoxic, haemotoxic, cardiotoxic, and myotoxic being common classifications. Hospitals, clinics, and ambulatory surgical centers are key consumers of antivenom, with snake bite victims and those experiencing medical emergencies due to animal attacks requiring prompt treatment. Public awareness and snakebite prevention efforts are essential to reducing the need for antivenom, with initiatives focusing on snakebite avoidance and healthcare infrastructure improvement. Clinical management and patient care are crucial aspects of antivenom use, with enzyme immunoassay and species insights aiding in accurate diagnosis and appropriate treatment. Clinical trial management and patient care are crucial aspects of antivenom use, with enzyme immunoassay and species insights aiding in accurate diagnosis and appropriate treatment.
|
Market Scope |
|
|
Report Coverage |
Details |
|
Page number |
159 |
|
Base year |
2023 |
|
Historic period |
2018-2022 |
|
Forecast period |
2024-2028 |
|
Growth momentum & CAGR |
Accelerate at a CAGR of 7.3% |
|
Market growth 2024-2028 |
USD 444.7 million |
|
Market structure |
Fragmented |
|
YoY growth 2023-2024(%) |
6.7 |
|
Key countries |
US, Canada, China, Japan, India, Germany, South Korea, UK, France, and Italy |
|
Competitive landscape |
Leading Companies, Market Positioning of Companies, Competitive Strategies, and Industry Risks |
What are the Key Data Covered in this Market Research and Growth Report?
- CAGR of the market during the forecast period
- Detailed information on factors that will drive the market growth and forecasting between 2024 and 2028
- Precise estimation of the size of the market and its contribution of the market in focus to the parent market
- Accurate predictions about upcoming market growth and trends and changes in consumer behaviour
- Growth of the market across North America, Asia, Europe, and Rest of World (ROW)
- Thorough analysis of the market's competitive landscape and detailed information about companies
- Comprehensive analysis of factors that will challenge the growth of market companies
We can help! Our analysts can customize this market research report to meet your requirements. Get in touch