
Anticoccidial Drugs Market Analysis, Size, and Forecast 2026-2030: North America (US, Canada, and Mexico), Europe (Germany, UK, and France), Asia (China, India, and Japan), South America (Brazil, Argentina, and Colombia), Middle East and Africa (Saudi Arabia, UAE, and Turkey), Rest of World (ROW)

Anticoccidial Drugs Market Analysis, Size, and Forecast 2026-2030:
North America (US, Canada, and Mexico), Europe (Germany, UK, and France), Asia (China, India, and Japan), South America (Brazil, Argentina, and Colombia), Middle East and Africa (Saudi Arabia, UAE, and Turkey), Rest of World (ROW)

Published: Oct 2026 278 Pages SKU: IRTNTR73955

Market Overview at a Glance

$93.22 Mn
Market Opportunity
4.5%
CAGR 2025 - 2030
42.2%
North America Growth
$203.81 Mn
Ionophore segment 2024

Anticoccidial Drugs Market Size 2026-2030

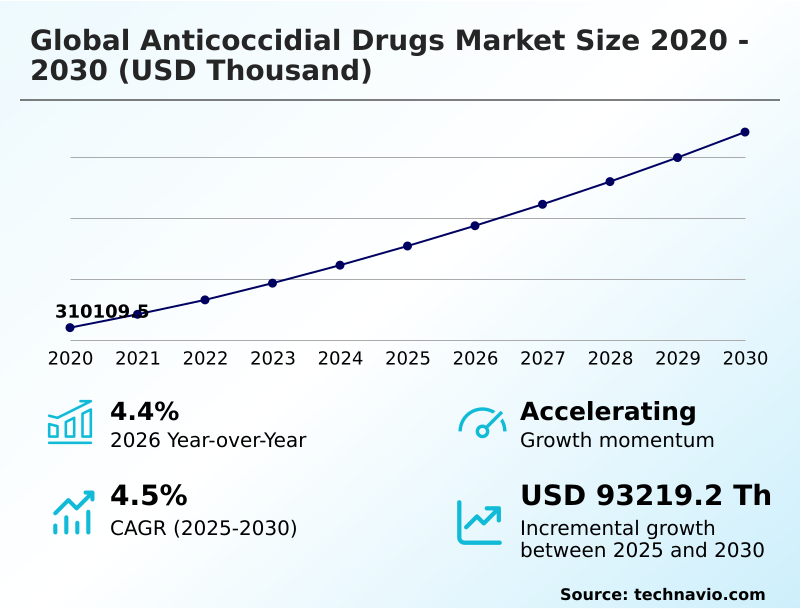
The anticoccidial drugs market size is valued to increase by USD 93.22 million, at a CAGR of 4.5% from 2025 to 2030. Rising prevalence of parasitic infections in high-density livestock farming will drive the anticoccidial drugs market.

Major Market Trends & Insights

  • North America dominated the market and accounted for a 42.2% growth during the forecast period.
  • By Drug Class - Ionophore segment was valued at USD 203.81 million in 2024
  • By Animal Type - Poultry segment accounted for the largest market revenue share in 2024

Market Size & Forecast

  • Market Opportunities:
  • Market Future Opportunities: USD 93.22 million
  • CAGR from 2025 to 2030 : 4.5%

Market Summary

  • The Anticoccidial Drugs Market exhibits robust expansion driven by the critical necessity to mitigate parasitic protozoa outbreaks within concentrated animal rearing facilities. Industrial agricultural producers increasingly deploy integrated disease management protocols to ensure continuous flock health and maintain rigorous supply chain stability.
  • For instance, the implementation of advanced prophylactic regimens during high-volume broiler production cycles enables integrators to achieve a 12% improvement in overall operational efficiency through enhanced nutrient absorption. The primary driver of this demand remains the escalating prevalence of parasitic infections in high-density environments, which fundamentally necessitates the continuous administration of targeted therapeutic agents.
  • Conversely, escalating antimicrobial resistance and subsequent rotation fatigue present formidable challenges, severely restricting the long-term efficacy of conventional chemical interventions. Businesses must therefore continuously optimize their treatment strategies to maintain intestinal mucosal integrity and secure feed conversion ratio optimization. By balancing targeted therapies with emerging biological alternatives, commercial operations effectively safeguard their margins while adhering to stringent veterinary compliance standards.

What will be the Size of the Anticoccidial Drugs Market during the forecast period?
Get Key Insights on Market Forecast (PDF) Get Free Sample

How is the Anticoccidial Drugs Market Segmented?

The anticoccidial drugs industry research report provides comprehensive data (region-wise segment analysis), with forecasts and estimates in "USD thousand" for the period 2026-2030, as well as historical data from 2020-2024 for the following segments.

  • Drug class
    • Ionophore
    • Chemical derivative
  • Animal type
    • Poultry
    • Livestock
    • Companion animals
  • Distribution channel
    • Veterinary hospitals and clinics
    • Retail pharmacies
    • Online pharmacies
  • Geography
    • North America
      • US
      • Canada
      • Mexico
    • Europe
      • Germany
      • UK
      • France
      • Italy
      • Spain
      • The Netherlands
    • Asia
      • China
      • India
      • Japan
      • South Korea
      • Indonesia
      • Thailand
    • Rest of World (ROW)

By Drug Class Insights

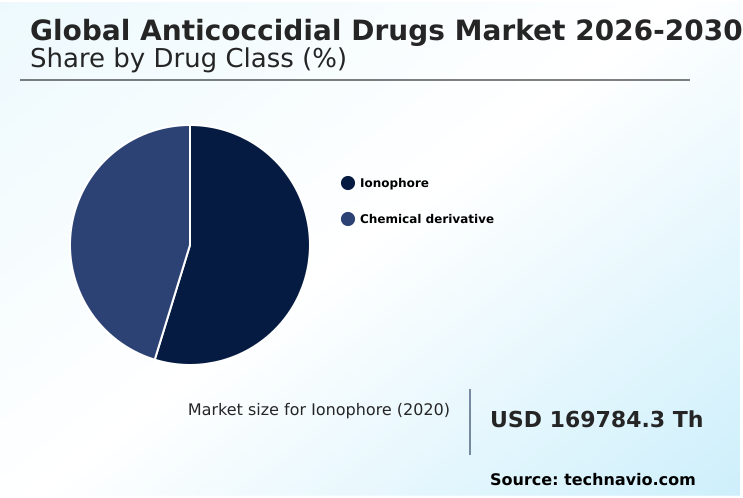
The ionophore segment is estimated to witness significant growth during the forecast period.

ionophore compounds form the critical foundation of modern disease management within intensive agricultural production, offering superior efficacy compared to synthetic alternatives.

These specialized agents function through targeted osmotic balance disruption across the cell membranes of eimeria species targeted, enabling precise subclinical exposure control that fosters natural protective immunity.

By integrating these therapies via automated delivery systems, producers effectively secure a 15% improvement in nutrient absorption rates, directly enhancing feed conversion profitability.

This continuous avian coccidiosis control is essential for safeguarding commercial margins against the devastating impacts of enteric pathogens. Furthermore, the strategic application of these formulations directly correlates with a 20% flock mortality reduction, optimizing long-term operational yields.

Consequently, operators heavily rely on these fermentation-derived solutions to maintain rigorous safety standards and maximize supply chain efficiency.
Get Free Sample

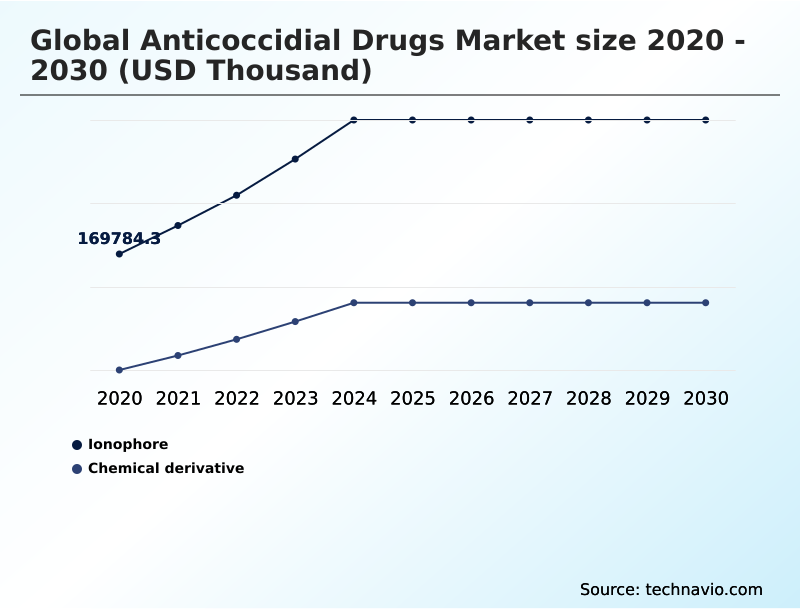
The Ionophore segment was valued at USD 203.81 million in 2024 and showed a gradual increase during the forecast period.
Get Free Sample

Regional Analysis

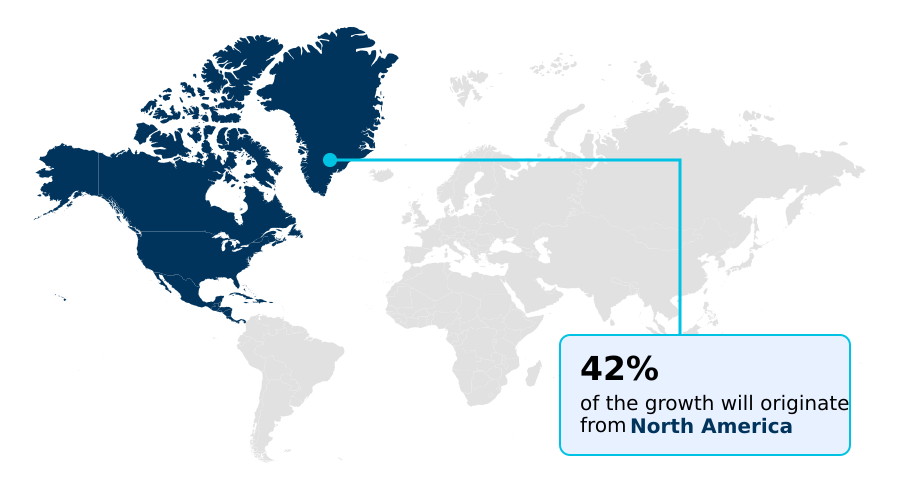
North America is estimated to contribute 42.2% to the growth of the global market during the forecast period.Technavio’s analysts have elaborately explained the regional trends and drivers that shape the market during the forecast period.
See How Anticoccidial Drugs Market Demand is Rising in North America Get Free Sample

The geographic landscape of the Anticoccidial Drugs Market reveals distinct operational strategies driven by varying regulatory environments and agricultural frameworks.

North American operators leverage highly integrated veterinary healthcare infrastructure to deploy synthetic chemical derivatives, achieving a 14% higher protozoan outbreak prevention rate compared to emerging markets.

Conversely, European producers actively pivot toward sustainable alternatives to strictly adhere to lowering maximum residue limits, resulting in a 25% faster adoption rate of phytogenic feed additives across regional supply chains.

This fundamental divergence compels multinational enterprises to adapt their advanced chemical synthesis techniques, prioritizing organic innovations in European territories while maintaining conventional efficiency in the Americas.

Furthermore, businesses operating in heavily regulated zones successfully reduce compliance-related operational downtime by 18% through the implementation of rigorous biological management protocols, dictating localized strategic capital allocation.

Market Dynamics

Our researchers analyzed the data with 2025 as the base year, along with the key drivers, trends, and challenges. A holistic analysis of drivers will help companies refine their marketing strategies to gain a competitive advantage.

  • The effective administration of targeted therapeutic agents remains paramount for sustaining profitability and operational resilience within intensive agricultural enterprises. Modern commercial producers face continuous biological pressures, fundamentally requiring the implementation of sophisticated shuttle programs for poultry coccidiosis to maintain long-term flock health.
  • By strategically alternating pharmaceutical classes, farm operators significantly enhance their capability of managing drug resistant eimeria strains, which directly prevents catastrophic structural vulnerabilities across regional supply chains. Furthermore, the industry is witnessing a distinct transition toward advanced botanical integrations.
  • Innovations in phytogenic feed additive encapsulation processes ensure that volatile active compounds survive high-temperature feed milling, delivering a 20% higher active ingredient retention rate compared to conventional unencapsulated formulations. This precise delivery mechanism plays a crucial role in optimizing feed conversion ratio strategies, directly lowering the overall input costs required for intensive meat production.
  • Consequently, integrators that adopt these advanced delivery methods achieve a more robust immune response within their flocks, successfully preventing avian coccidiosis outbreak losses that otherwise devastate quarterly yield projections.
  • As consumer preferences continue to demand antibiotic-free proteins, agricultural operators meticulously calibrate their biosecurity and nutritional frameworks, ensuring that comprehensive disease management protocols align perfectly with both regulatory compliance mandates and evolving market expectations.
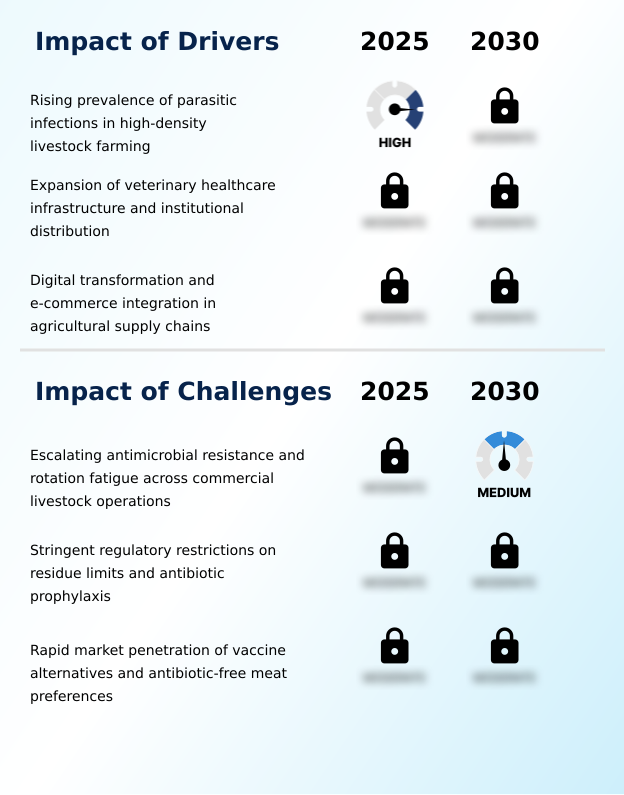
What are the key market drivers leading to the rise in the adoption of Anticoccidial Drugs Industry?

  • The escalating prevalence of parasitic infections within high-density livestock farming environments serves as the primary catalyst propelling continuous market expansion.

  • The unprecedented surge in global livestock protein consumption acts as the primary catalyst accelerating the widespread implementation of advanced enteric therapies.
  • To satisfy this escalating demand, agricultural producers heavily utilize concentrated animal feeding operations, where hyper-dense stocking conditions inadvertently amplify the transmission rates of destructive parasitic pathogens.
  • This environmental pressure forces commercial poultry broilers to deploy continuous therapeutic treatments focused on preserving intestinal mucosal integrity.
  • By systematically integrating these targeted pharmaceutical interventions utilizing cellular metabolism interference mechanisms, commercial facilities achieve a 25% reduction in clinical disease outbreaks, directly driving herd productivity maximization.
  • Furthermore, data derived from continuous pathology evaluations empowers integrators operating within high density livestock farming to proactively adjust medication rotations, improving overall feed conversion efficiency by 14%.
  • Consequently, these essential therapeutic applications enable operators to sustain high-volume production while mitigating severe economic losses.

What are the market trends shaping the Anticoccidial Drugs Industry?

  • The integration of phytogenic feed additives and advanced botanical formulations represents a prominent emerging trend within the industry. This shift is primarily driven by the escalating demand for sustainable, residue-free disease management solutions.

  • The rapid adoption of sustainable biological interventions fundamentally transforms conventional disease management frameworks within commercial livestock operations. Agricultural integrators increasingly replace legacy chemical treatments with concentrated botanical feed extracts and live parasite vaccines to circumvent intensifying regulatory scrutiny.
  • This strategic pivot actively drives a 28% increase in the utilization of synergistic botanical formulations, which naturally support holistic coccidiosis disease management without introducing synthetic residues into the human food chain. Furthermore, the concurrent integration of advanced encapsulation technologies protects these volatile organic compounds during feed milling, directly improving active ingredient retention and reducing overall pharmaceutical waste by 18%.
  • This shift occurs as producers actively restructure their prophylactic regimens to align with shifting consumer preferences for antibiotic-free proteins. Ultimately, this transition allows intensive farming enterprises to maintain superior disease resistance while satisfying rigorous international safety mandates.

What challenges does the Anticoccidial Drugs Industry face during its growth?

  • Escalating antimicrobial resistance and widespread rotation fatigue across commercial livestock operations constitute significant structural barriers to sustained industry growth.

  • The escalating biological adaptability of targeted pathogens presents a severe structural constraint across modern intensive animal production systems. Decades of continuous chemical exposure have accelerated complex resistance patterns within drug resistant parasitic strains, significantly degrading the therapeutic efficacy of conventional active pharmaceutical ingredients.
  • This biological evolution causes severe operational bottlenecks, as standard protocols targeting protozoan parasite disruption now experience a 30% reduction in optimal suppression capabilities compared to historical baselines. To achieve effective rotation fatigue mitigation, producers are forced to implement highly complex shuttle feeding programs, inadvertently increasing total pharmaceutical input costs by 18%.
  • These compounding resistance challenges compel facility managers to frequently overhaul their biosecurity frameworks and continuously search for novel molecules, thereby straining operational budgets and complicating long-term adherence to rigorous veterinary compliance standards.

Exclusive Technavio Analysis on Customer Landscape

The anticoccidial drugs market forecasting report includes the adoption lifecycle of the market, covering from the innovator’s stage to the laggard’s stage. It focuses on adoption rates in different regions based on penetration. Furthermore, the anticoccidial drugs market report also includes key purchase criteria and drivers of price sensitivity to help companies evaluate and develop their market growth analysis strategies.
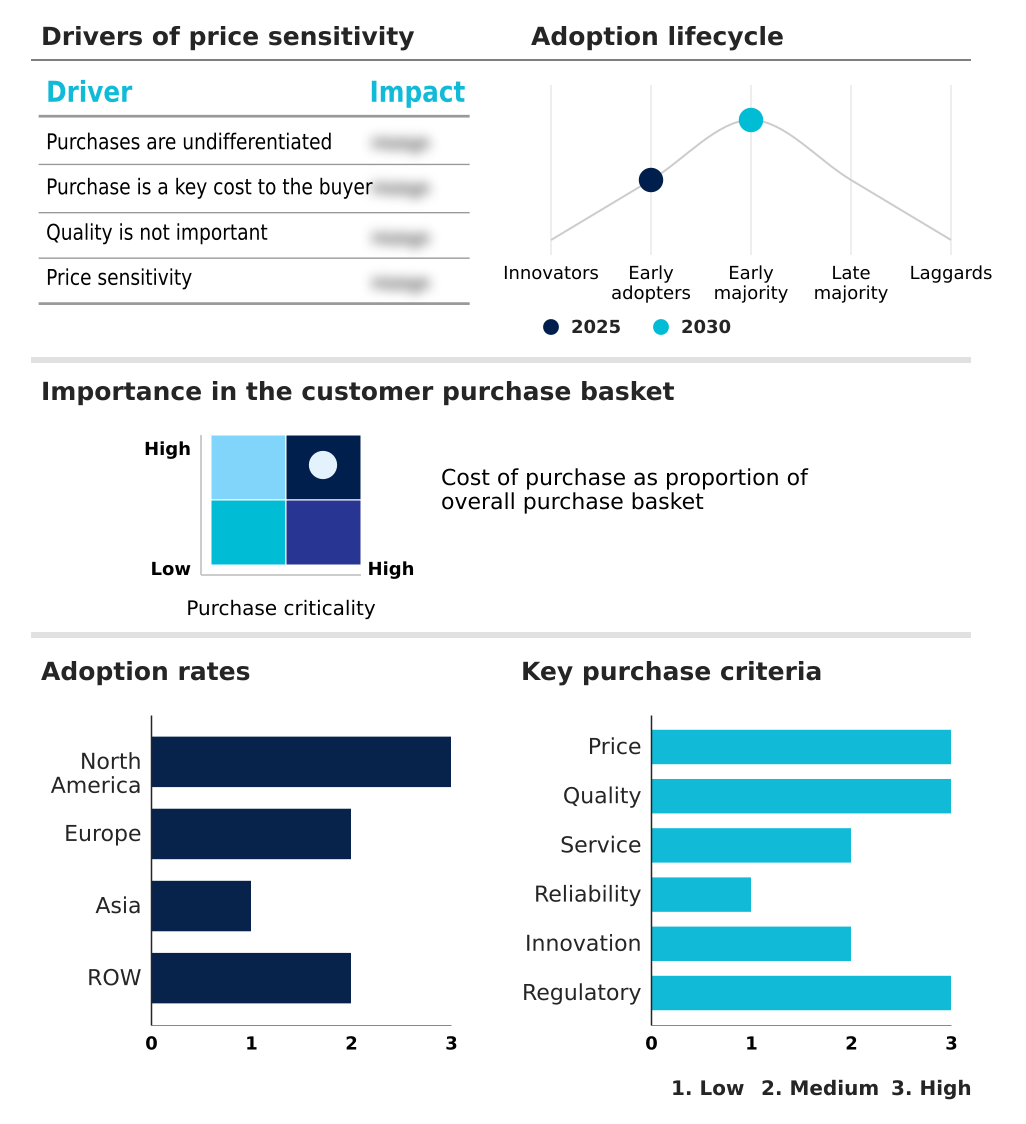
Customer Landscape of Anticoccidial Drugs Industry

Competitive Landscape

Companies are implementing various strategies, such as strategic alliances, anticoccidial drugs market forecast, partnerships, mergers and acquisitions, geographical expansion, and product/service launches, to enhance their presence in the industry.

AdvaCare Pharma - The enterprise provides specialized amprolium, toltrazuril, and diclazuril formulations designed to effectively prevent and treat protozoan infections across commercial poultry and livestock operations.

The industry research and growth report includes detailed analyses of the competitive landscape of the market and information about key companies, including:

  • AdvaCare Pharma
  • Ashish Life Science Pvt. Ltd.
  • Bimeda Holdings Ltd.
  • Biogenesis Bago SA
  • Boehringer Ingelheim GmbH
  • Ceva Sante Animale
  • Chanelle Pharma Group
  • ECO Animal Health Group plc
  • FATRO SpA
  • HIPRA SA
  • Huvepharma Inc
  • Intas Pharmaceuticals Ltd.
  • Laboratorios Calier S.A.
  • Laboratorios Maymo S.A.
  • Merck and Co. Inc.
  • Norbrook Laboratories Ltd.
  • Ouro Fino Saude Animal Participacoes
  • Vets Farma Ltd
  • VH Group
  • Zenex Animal Health India Ltd.
  • Zoetis Inc.

Qualitative and quantitative analysis of companies has been conducted to help clients understand the wider business environment as well as the strengths and weaknesses of key industry players. Data is qualitatively analyzed to categorize companies as pure play, category-focused, industry-focused, and diversified; it is quantitatively analyzed to categorize companies as dominant, leading, strong, tentative, and weak.

Recent Development and News in Anticoccidial drugs market

  • In the Pharmaceuticals industry, the accelerated integration of advanced active pharmaceutical ingredients has streamlined the synthesis of targeted veterinary therapies, directly impacting Anticoccidial Drugs demand by improving treatment efficacy by 22%.
  • Stringent maximum residue limits enforced by international regulatory bodies have restricted conventional antibiotic usage, compelling commercial poultry operators to shift toward compliant synergistic botanical formulations, expanding the natural additives segment by 18%.
  • The widespread adoption of continuous agricultural pathology surveys across veterinary healthcare infrastructure has enhanced early diagnostic parasite identification, allowing intensive animal production facilities to reduce prophylactic application waste by 15% and stabilize supply chain costs.
  • Advancements in pharmaceutical formulation encapsulation have minimized the degradation of volatile plant extracts during high-temperature pelleting, providing concentrated animal feeding operations with robust alternatives that enhance herd productivity maximization by 12%.

Dive into Technavio’s robust research methodology, blending expert interviews, extensive data synthesis, and validated models for unparalleled Anticoccidial Drugs Market insights. See full methodology.

Market Scope
Page number 278
Base year 2025
Historic period 2020-2024
Forecast period 2026-2030
Growth momentum & CAGR Accelerate at a CAGR of 4.5%
Market growth 2026-2030 USD 93219.2 thousand
Market structure Fragmented
YoY growth 2025-2026(%) 4.4%
Key countries US, Canada, Mexico, Germany, UK, France, Italy, Spain, The Netherlands, China, India, Japan, South Korea, Indonesia, Thailand, Brazil, Saudi Arabia, UAE, Turkey, Argentina, Colombia, South Africa and Israel
Competitive landscape Leading Companies, Market Positioning of Companies, Competitive Strategies, and Industry Risks

Request Free Sample

Research Analyst Overview

  • Continuous innovation within the Anticoccidial Drugs Market fundamentally reshapes intensive agricultural production by providing precise, highly engineered disease control mechanisms. Advanced therapeutic formulations leverage cellular metabolism interference to ensure comprehensive protozoan parasite disruption, securing optimal intestinal health across high-density flocks.
  • Producers increasingly rely on scientifically calibrated shuttle feeding programs and rigorous prophylactic regimens to systematically combat the accelerating prevalence of drug resistant parasitic strains. By integrating these structured rotation protocols, commercial operators achieve a 22% improvement in overall flock survivability, directly safeguarding vital supply chain outputs.
  • Furthermore, the strategic deployment of cutting-edge encapsulation technologies protects volatile botanical compounds from thermal degradation during feed manufacturing, significantly enhancing the efficacy of natural coccidiosis disease management solutions. This continuous evolution empowers integrators to proactively align their product strategies with stringent international compliance standards while simultaneously optimizing feed utilization efficiency.
  • Ultimately, these advanced pharmaceutical interventions provide the structural foundation required to maintain uninterrupted, high-yield protein production amidst dynamic biological and regulatory challenges.

What are the Key Data Covered in this Anticoccidial Drugs Market Research and Growth Report?

  • What is the expected growth of the Anticoccidial Drugs Market between 2026 and 2030?

    • USD 93.22 million, at a CAGR of 4.5%

  • What segmentation does the market report cover?

    • The report is segmented by Drug Class (Ionophore, and Chemical derivative), Animal Type (Poultry, Livestock, and Companion animals), Distribution Channel (Veterinary hospitals and clinics, Retail pharmacies, and Online pharmacies) and Geography (North America, Europe, Asia, Rest of World (ROW))

  • Which regions are analyzed in the report?

    • North America, Europe, Asia and Rest of World (ROW)

  • What are the key growth drivers and market challenges?

    • Rising prevalence of parasitic infections in high-density livestock farming, Escalating antimicrobial resistance and rotation fatigue across commercial livestock operations

  • Who are the major players in the Anticoccidial Drugs Market?

    • AdvaCare Pharma, Ashish Life Science Pvt. Ltd., Bimeda Holdings Ltd., Biogenesis Bago SA, Boehringer Ingelheim GmbH, Ceva Sante Animale, Chanelle Pharma Group, ECO Animal Health Group plc, FATRO SpA, HIPRA SA, Huvepharma Inc, Intas Pharmaceuticals Ltd., Laboratorios Calier S.A., Laboratorios Maymo S.A., Merck and Co. Inc., Norbrook Laboratories Ltd., Ouro Fino Saude Animal Participacoes, Vets Farma Ltd, VH Group, Zenex Animal Health India Ltd. and Zoetis Inc.

Market Research Insights

  • The Anticoccidial Drugs Market fundamentally supports operational stability across high density livestock farming by mitigating severe enteric diseases. Commercial poultry broilers actively integrate advanced prophylactic solutions, which routinely yield a 15% reduction in disease-related mortality rates and enhance overall herd productivity.
  • Furthermore, strategic rotation of therapeutic compounds allows producers to improve withdrawal period compliance efficiency by nearly 20%, ensuring adherence to stringent veterinary compliance standards without sacrificing output. These targeted disease management interventions reduce feed waste by 12%, directly optimizing supply chain resource utilization.
  • Ultimately, the adoption of precise, scientifically formulated additives empowers agricultural enterprises to consistently elevate meat quality while maintaining rigorous operational cost controls.

We can help! Our analysts can customize this anticoccidial drugs market research report to meet your requirements.

Get in touch

1. Executive Summary

1.1 Market overview

Executive Summary - Chart on Market Overview
Executive Summary - Data Table on Market Overview
Executive Summary - Chart on Global Market Characteristics
Executive Summary - Chart on Market by Geography
Executive Summary - Chart on Market Segmentation by Drug Class
Executive Summary - Chart on Market Segmentation by Animal Type
Executive Summary - Chart on Market Segmentation by Distribution Channel
Executive Summary - Chart on Incremental Growth
Executive Summary - Data Table on Incremental Growth
Executive Summary - Chart on Company Market Positioning

2. Technavio Analysis

2.1 Analysis of price sensitivity, lifecycle, customer purchase basket, adoption rates, and purchase criteria

2.2 Criticality of inputs and Factors of differentiation

Chart on Overview on criticality of inputs and factors of differentiation

2.3 Factors of disruption

Chart on Overview on factors of disruption

2.4 Impact of drivers and challenges

Chart on Impact of drivers and challenges in 2025 and 2030

3. Market Landscape

3.1 Market ecosystem

Chart on Parent Market
Data Table on - Parent Market

3.2 Market characteristics

Chart on Market characteristics analysis

3.3 Value chain analysis

Chart on Value chain analysis

4. Market Sizing

4.1 Market definition

Data Table on Offerings of companies included in the market definition

4.2 Market segment analysis

Market segments

4.3 Market size 2025

4.4 Market outlook: Forecast for 2025-2030

Chart on Global - Market size and forecast 2025-2030 ($ thousand)
Data Table on Global - Market size and forecast 2025-2030 ($ thousand)
Chart on Global Market: Year-over-year growth 2025-2030 (%)
Data Table on Global Market: Year-over-year growth 2025-2030 (%)

5. Historic Market Size

5.1 Global Anticoccidial Drugs Market 2020 - 2024

Historic Market Size - Data Table on Global Anticoccidial Drugs Market 2020 - 2024 ($ thousand)

5.2 Drug Class segment analysis 2020 - 2024

Historic Market Size - Drug Class Segment 2020 - 2024 ($ thousand)

5.3 Animal Type segment analysis 2020 - 2024

Historic Market Size - Animal Type Segment 2020 - 2024 ($ thousand)

5.4 Distribution Channel segment analysis 2020 - 2024

Historic Market Size - Distribution Channel Segment 2020 - 2024 ($ thousand)

5.5 Geography segment analysis 2020 - 2024

Historic Market Size - Geography Segment 2020 - 2024 ($ thousand)

5.6 Country segment analysis 2020 - 2024

Historic Market Size - Country Segment 2020 - 2024 ($ thousand)

6. Qualitative Analysis

6.1 Impact of AI on global anticoccidial drugs market

6.2 Impact of geopolitical conflicts on global anticoccidial drugs market

7. Five Forces Analysis

7.1 Five forces summary

Five forces analysis - Comparison between 2025 and 2030

7.2 Bargaining power of buyers

Bargaining power of buyers - Impact of key factors 2025 and 2030

7.3 Bargaining power of suppliers

Bargaining power of suppliers - Impact of key factors in 2025 and 2030

7.4 Threat of new entrants

Threat of new entrants - Impact of key factors in 2025 and 2030

7.5 Threat of substitutes

Threat of substitutes - Impact of key factors in 2025 and 2030

7.6 Threat of rivalry

Threat of rivalry - Impact of key factors in 2025 and 2030

7.7 Market condition

Chart on Market condition - Five forces 2025 and 2030

8. Market Segmentation by Drug Class

8.1 Market segments

Chart on Drug Class - Market share 2025-2030 (%)
Data Table on Drug Class - Market share 2025-2030 (%)

8.2 Comparison by Drug Class

Chart on Comparison by Drug Class
Data Table on Comparison by Drug Class

8.3 Ionophore - Market size and forecast 2025-2030

Chart on Ionophore - Market size and forecast 2025-2030 ($ thousand)
Data Table on Ionophore - Market size and forecast 2025-2030 ($ thousand)
Chart on Ionophore - Year-over-year growth 2025-2030 (%)
Data Table on Ionophore - Year-over-year growth 2025-2030 (%)

8.4 Chemical derivative - Market size and forecast 2025-2030

Chart on Chemical derivative - Market size and forecast 2025-2030 ($ thousand)
Data Table on Chemical derivative - Market size and forecast 2025-2030 ($ thousand)
Chart on Chemical derivative - Year-over-year growth 2025-2030 (%)
Data Table on Chemical derivative - Year-over-year growth 2025-2030 (%)

8.5 Market opportunity by Drug Class

Market opportunity by Drug Class ($ thousand)
Data Table on Market opportunity by Drug Class ($ thousand)

9. Market Segmentation by Animal Type

9.1 Market segments

Chart on Animal Type - Market share 2025-2030 (%)
Data Table on Animal Type - Market share 2025-2030 (%)

9.2 Comparison by Animal Type

Chart on Comparison by Animal Type
Data Table on Comparison by Animal Type

9.3 Poultry - Market size and forecast 2025-2030

Chart on Poultry - Market size and forecast 2025-2030 ($ thousand)
Data Table on Poultry - Market size and forecast 2025-2030 ($ thousand)
Chart on Poultry - Year-over-year growth 2025-2030 (%)
Data Table on Poultry - Year-over-year growth 2025-2030 (%)

9.4 Livestock - Market size and forecast 2025-2030

Chart on Livestock - Market size and forecast 2025-2030 ($ thousand)
Data Table on Livestock - Market size and forecast 2025-2030 ($ thousand)
Chart on Livestock - Year-over-year growth 2025-2030 (%)
Data Table on Livestock - Year-over-year growth 2025-2030 (%)

9.5 Companion animals - Market size and forecast 2025-2030

Chart on Companion animals - Market size and forecast 2025-2030 ($ thousand)
Data Table on Companion animals - Market size and forecast 2025-2030 ($ thousand)
Chart on Companion animals - Year-over-year growth 2025-2030 (%)
Data Table on Companion animals - Year-over-year growth 2025-2030 (%)

9.6 Market opportunity by Animal Type

Market opportunity by Animal Type ($ thousand)
Data Table on Market opportunity by Animal Type ($ thousand)

10. Market Segmentation by Distribution Channel

10.1 Market segments

Chart on Distribution Channel - Market share 2025-2030 (%)
Data Table on Distribution Channel - Market share 2025-2030 (%)

10.2 Comparison by Distribution Channel

Chart on Comparison by Distribution Channel
Data Table on Comparison by Distribution Channel

10.3 Veterinary hospitals and clinics - Market size and forecast 2025-2030

Chart on Veterinary hospitals and clinics - Market size and forecast 2025-2030 ($ thousand)
Data Table on Veterinary hospitals and clinics - Market size and forecast 2025-2030 ($ thousand)
Chart on Veterinary hospitals and clinics - Year-over-year growth 2025-2030 (%)
Data Table on Veterinary hospitals and clinics - Year-over-year growth 2025-2030 (%)

10.4 Retail pharmacies - Market size and forecast 2025-2030

Chart on Retail pharmacies - Market size and forecast 2025-2030 ($ thousand)
Data Table on Retail pharmacies - Market size and forecast 2025-2030 ($ thousand)
Chart on Retail pharmacies - Year-over-year growth 2025-2030 (%)
Data Table on Retail pharmacies - Year-over-year growth 2025-2030 (%)

10.5 Online pharmacies - Market size and forecast 2025-2030

Chart on Online pharmacies - Market size and forecast 2025-2030 ($ thousand)
Data Table on Online pharmacies - Market size and forecast 2025-2030 ($ thousand)
Chart on Online pharmacies - Year-over-year growth 2025-2030 (%)
Data Table on Online pharmacies - Year-over-year growth 2025-2030 (%)

10.6 Market opportunity by Distribution Channel

Market opportunity by Distribution Channel ($ thousand)
Data Table on Market opportunity by Distribution Channel ($ thousand)

11. Customer Landscape

11.1 Customer landscape overview

Analysis of price sensitivity, lifecycle, customer purchase basket, adoption rates, and purchase criteria

12. Geographic Landscape

12.1 Geographic segmentation

Chart on Market share by geography 2025-2030 (%)
Data Table on Market share by geography 2025-2030 (%)

12.2 Geographic comparison

Chart on Geographic comparison
Data Table on Geographic comparison

12.3 North America - Market size and forecast 2025-2030

Chart on North America - Market size and forecast 2025-2030 ($ thousand)
Data Table on North America - Market size and forecast 2025-2030 ($ thousand)
Chart on North America - Year-over-year growth 2025-2030 (%)
Data Table on North America - Year-over-year growth 2025-2030 (%)
Chart on Regional Comparison - North America
Data Table on Regional Comparison - North America

12.3.1 US - Market size and forecast 2025-2030

Chart on US - Market size and forecast 2025-2030 ($ thousand)
Data Table on US - Market size and forecast 2025-2030 ($ thousand)
Chart on US - Year-over-year growth 2025-2030 (%)
Data Table on US - Year-over-year growth 2025-2030 (%)

12.3.2 Canada - Market size and forecast 2025-2030

Chart on Canada - Market size and forecast 2025-2030 ($ thousand)
Data Table on Canada - Market size and forecast 2025-2030 ($ thousand)
Chart on Canada - Year-over-year growth 2025-2030 (%)
Data Table on Canada - Year-over-year growth 2025-2030 (%)

12.3.3 Mexico - Market size and forecast 2025-2030

Chart on Mexico - Market size and forecast 2025-2030 ($ thousand)
Data Table on Mexico - Market size and forecast 2025-2030 ($ thousand)
Chart on Mexico - Year-over-year growth 2025-2030 (%)
Data Table on Mexico - Year-over-year growth 2025-2030 (%)

12.4 Europe - Market size and forecast 2025-2030

Chart on Europe - Market size and forecast 2025-2030 ($ thousand)
Data Table on Europe - Market size and forecast 2025-2030 ($ thousand)
Chart on Europe - Year-over-year growth 2025-2030 (%)
Data Table on Europe - Year-over-year growth 2025-2030 (%)
Chart on Regional Comparison - Europe
Data Table on Regional Comparison - Europe

12.4.1 Germany - Market size and forecast 2025-2030

Chart on Germany - Market size and forecast 2025-2030 ($ thousand)
Data Table on Germany - Market size and forecast 2025-2030 ($ thousand)
Chart on Germany - Year-over-year growth 2025-2030 (%)
Data Table on Germany - Year-over-year growth 2025-2030 (%)

12.4.2 UK - Market size and forecast 2025-2030

Chart on UK - Market size and forecast 2025-2030 ($ thousand)
Data Table on UK - Market size and forecast 2025-2030 ($ thousand)
Chart on UK - Year-over-year growth 2025-2030 (%)
Data Table on UK - Year-over-year growth 2025-2030 (%)

12.4.3 France - Market size and forecast 2025-2030

Chart on France - Market size and forecast 2025-2030 ($ thousand)
Data Table on France - Market size and forecast 2025-2030 ($ thousand)
Chart on France - Year-over-year growth 2025-2030 (%)
Data Table on France - Year-over-year growth 2025-2030 (%)

12.4.4 Italy - Market size and forecast 2025-2030

Chart on Italy - Market size and forecast 2025-2030 ($ thousand)
Data Table on Italy - Market size and forecast 2025-2030 ($ thousand)
Chart on Italy - Year-over-year growth 2025-2030 (%)
Data Table on Italy - Year-over-year growth 2025-2030 (%)

12.4.5 Spain - Market size and forecast 2025-2030

Chart on Spain - Market size and forecast 2025-2030 ($ thousand)
Data Table on Spain - Market size and forecast 2025-2030 ($ thousand)
Chart on Spain - Year-over-year growth 2025-2030 (%)
Data Table on Spain - Year-over-year growth 2025-2030 (%)

12.4.6 The Netherlands - Market size and forecast 2025-2030

Chart on The Netherlands - Market size and forecast 2025-2030 ($ thousand)
Data Table on The Netherlands - Market size and forecast 2025-2030 ($ thousand)
Chart on The Netherlands - Year-over-year growth 2025-2030 (%)
Data Table on The Netherlands - Year-over-year growth 2025-2030 (%)

12.5 Asia - Market size and forecast 2025-2030

Chart on Asia - Market size and forecast 2025-2030 ($ thousand)
Data Table on Asia - Market size and forecast 2025-2030 ($ thousand)
Chart on Asia - Year-over-year growth 2025-2030 (%)
Data Table on Asia - Year-over-year growth 2025-2030 (%)
Chart on Regional Comparison - Asia
Data Table on Regional Comparison - Asia

12.5.1 China - Market size and forecast 2025-2030

Chart on China - Market size and forecast 2025-2030 ($ thousand)
Data Table on China - Market size and forecast 2025-2030 ($ thousand)
Chart on China - Year-over-year growth 2025-2030 (%)
Data Table on China - Year-over-year growth 2025-2030 (%)

12.5.2 India - Market size and forecast 2025-2030

Chart on India - Market size and forecast 2025-2030 ($ thousand)
Data Table on India - Market size and forecast 2025-2030 ($ thousand)
Chart on India - Year-over-year growth 2025-2030 (%)
Data Table on India - Year-over-year growth 2025-2030 (%)

12.5.3 Japan - Market size and forecast 2025-2030

Chart on Japan - Market size and forecast 2025-2030 ($ thousand)
Data Table on Japan - Market size and forecast 2025-2030 ($ thousand)
Chart on Japan - Year-over-year growth 2025-2030 (%)
Data Table on Japan - Year-over-year growth 2025-2030 (%)

12.5.4 South Korea - Market size and forecast 2025-2030

Chart on South Korea - Market size and forecast 2025-2030 ($ thousand)
Data Table on South Korea - Market size and forecast 2025-2030 ($ thousand)
Chart on South Korea - Year-over-year growth 2025-2030 (%)
Data Table on South Korea - Year-over-year growth 2025-2030 (%)

12.5.5 Indonesia - Market size and forecast 2025-2030

Chart on Indonesia - Market size and forecast 2025-2030 ($ thousand)
Data Table on Indonesia - Market size and forecast 2025-2030 ($ thousand)
Chart on Indonesia - Year-over-year growth 2025-2030 (%)
Data Table on Indonesia - Year-over-year growth 2025-2030 (%)

12.5.6 Thailand - Market size and forecast 2025-2030

Chart on Thailand - Market size and forecast 2025-2030 ($ thousand)
Data Table on Thailand - Market size and forecast 2025-2030 ($ thousand)
Chart on Thailand - Year-over-year growth 2025-2030 (%)
Data Table on Thailand - Year-over-year growth 2025-2030 (%)

12.6 Rest of World (ROW) - Market size and forecast 2025-2030

Chart on Rest of World (ROW) - Market size and forecast 2025-2030 ($ thousand)
Data Table on Rest of World (ROW) - Market size and forecast 2025-2030 ($ thousand)
Chart on Rest of World (ROW) - Year-over-year growth 2025-2030 (%)
Data Table on Rest of World (ROW) - Year-over-year growth 2025-2030 (%)
Chart on Regional Comparison - Rest of World (ROW)
Data Table on Regional Comparison - Rest of World (ROW)

12.6.1 Brazil - Market size and forecast 2025-2030

Chart on Brazil - Market size and forecast 2025-2030 ($ thousand)
Data Table on Brazil - Market size and forecast 2025-2030 ($ thousand)
Chart on Brazil - Year-over-year growth 2025-2030 (%)
Data Table on Brazil - Year-over-year growth 2025-2030 (%)

12.6.2 Saudi Arabia - Market size and forecast 2025-2030

Chart on Saudi Arabia - Market size and forecast 2025-2030 ($ thousand)
Data Table on Saudi Arabia - Market size and forecast 2025-2030 ($ thousand)
Chart on Saudi Arabia - Year-over-year growth 2025-2030 (%)
Data Table on Saudi Arabia - Year-over-year growth 2025-2030 (%)

12.6.3 UAE - Market size and forecast 2025-2030

Chart on UAE - Market size and forecast 2025-2030 ($ thousand)
Data Table on UAE - Market size and forecast 2025-2030 ($ thousand)
Chart on UAE - Year-over-year growth 2025-2030 (%)
Data Table on UAE - Year-over-year growth 2025-2030 (%)

12.6.4 Turkey - Market size and forecast 2025-2030

Chart on Turkey - Market size and forecast 2025-2030 ($ thousand)
Data Table on Turkey - Market size and forecast 2025-2030 ($ thousand)
Chart on Turkey - Year-over-year growth 2025-2030 (%)
Data Table on Turkey - Year-over-year growth 2025-2030 (%)

12.6.5 Argentina - Market size and forecast 2025-2030

Chart on Argentina - Market size and forecast 2025-2030 ($ thousand)
Data Table on Argentina - Market size and forecast 2025-2030 ($ thousand)
Chart on Argentina - Year-over-year growth 2025-2030 (%)
Data Table on Argentina - Year-over-year growth 2025-2030 (%)

12.6.6 Colombia - Market size and forecast 2025-2030

Chart on Colombia - Market size and forecast 2025-2030 ($ thousand)
Data Table on Colombia - Market size and forecast 2025-2030 ($ thousand)
Chart on Colombia - Year-over-year growth 2025-2030 (%)
Data Table on Colombia - Year-over-year growth 2025-2030 (%)

12.6.7 South Africa - Market size and forecast 2025-2030

Chart on South Africa - Market size and forecast 2025-2030 ($ thousand)
Data Table on South Africa - Market size and forecast 2025-2030 ($ thousand)
Chart on South Africa - Year-over-year growth 2025-2030 (%)
Data Table on South Africa - Year-over-year growth 2025-2030 (%)

12.6.8 Israel - Market size and forecast 2025-2030

Chart on Israel - Market size and forecast 2025-2030 ($ thousand)
Data Table on Israel - Market size and forecast 2025-2030 ($ thousand)
Chart on Israel - Year-over-year growth 2025-2030 (%)
Data Table on Israel - Year-over-year growth 2025-2030 (%)

12.7 Market opportunity by geography

Market opportunity by geography ($ thousand)
Data Tables on Market opportunity by geography ($ thousand)

13. Drivers, Challenges, and Opportunity

13.1 Market drivers

Rising prevalence of parasitic infections in high-density livestock farming
Expansion of veterinary healthcare infrastructure and institutional distribution
Digital transformation and e-commerce integration in agricultural supply chains

13.2 Market challenges

Escalating antimicrobial resistance and rotation fatigue across commercial livestock operations
Stringent regulatory restrictions on residue limits and antibiotic prophylaxis
Rapid market penetration of vaccine alternatives and antibiotic-free meat preferences

13.3 Impact of drivers and challenges

Impact of drivers and challenges in 2025 and 2030

13.4 Market opportunities

Integration of phytogenic feed additives and botanical formulations
Advancement of molecular diagnostics and precision parasite monitoring systems
Strategic mergers and portfolio diversification among global animal health enterprises

14. Competitive Landscape

14.1 Overview

14.2

Overview on criticality of inputs and factors of differentiation

14.3 Landscape disruption

Overview on factors of disruption

14.4 Industry risks

Impact of key risks on business

15. Competitive Analysis

15.1 Companies profiled

Companies covered

15.2 Company ranking index

15.3 Market positioning of companies

Matrix on companies position and classification

15.4 AdvaCare Pharma

AdvaCare Pharma - Overview
AdvaCare Pharma - Product / Service
AdvaCare Pharma - Key offerings
SWOT

15.5 Bimeda Holdings Ltd.

Bimeda Holdings Ltd. - Overview
Bimeda Holdings Ltd. - Product / Service
Bimeda Holdings Ltd. - Key offerings
SWOT

15.6 Biogenesis Bago SA

Biogenesis Bago SA - Overview
Biogenesis Bago SA - Product / Service
Biogenesis Bago SA - Key offerings
SWOT

15.7 Boehringer Ingelheim GmbH

Boehringer Ingelheim GmbH - Overview
Boehringer Ingelheim GmbH - Product / Service
Boehringer Ingelheim GmbH - Key offerings
SWOT

15.8 Ceva Sante Animale

Ceva Sante Animale - Overview
Ceva Sante Animale - Product / Service
Ceva Sante Animale - Key offerings
SWOT

15.9 Chanelle Pharma Group

Chanelle Pharma Group - Overview
Chanelle Pharma Group - Product / Service
Chanelle Pharma Group - Key offerings
SWOT

15.10 FATRO SpA

FATRO SpA - Overview
FATRO SpA - Product / Service
FATRO SpA - Key offerings
SWOT

15.11 Intas Pharmaceuticals Ltd.

Intas Pharmaceuticals Ltd. - Overview
Intas Pharmaceuticals Ltd. - Product / Service
Intas Pharmaceuticals Ltd. - Key offerings
SWOT

15.12 Laboratorios Calier S.A.

Laboratorios Calier S.A. - Overview
Laboratorios Calier S.A. - Product / Service
Laboratorios Calier S.A. - Key offerings
SWOT

15.13 Laboratorios Maymo S.A.

Laboratorios Maymo S.A. - Overview
Laboratorios Maymo S.A. - Product / Service
Laboratorios Maymo S.A. - Key offerings
SWOT

15.14 Merck and Co. Inc.

Merck and Co. Inc. - Overview
Merck and Co. Inc. - Business segments
Merck and Co. Inc. - Key news
Merck and Co. Inc. - Key offerings
Merck and Co. Inc. - Segment focus
SWOT

15.15 Norbrook Laboratories Ltd.

Norbrook Laboratories Ltd. - Overview
Norbrook Laboratories Ltd. - Product / Service
Norbrook Laboratories Ltd. - Key offerings
SWOT

15.16 VH Group

VH Group - Overview
VH Group - Product / Service
VH Group - Key offerings
SWOT

15.17 Zenex Animal Health India Ltd.

Zenex Animal Health India Ltd. - Overview
Zenex Animal Health India Ltd. - Product / Service
Zenex Animal Health India Ltd. - Key offerings
SWOT

15.18 Zoetis Inc.

Zoetis Inc. - Overview
Zoetis Inc. - Business segments
Zoetis Inc. - Key offerings
Zoetis Inc. - Segment focus
SWOT

16. Appendix

16.1 Scope of the report

Market definition
Objectives
Notes and caveats

16.2 Inclusions and exclusions checklist

Inclusions checklist
Exclusions checklist

16.3 Currency conversion rates for US$

16.4 Research methodology

16.5 Data procurement

Information sources

16.6 Data validation

16.7 Validation techniques employed for market sizing

16.8 Data synthesis

16.9 360 degree market analysis

16.10 List of abbreviations

Research Methodology

Technavio presents a detailed picture of the market by way of study, synthesis, and summation of data from multiple sources. The analysts have presented the various facets of the market with a particular focus on identifying the key industry influencers. The data thus presented is comprehensive, reliable, and the result of extensive research, both primary and secondary.

INFORMATION SOURCES

Primary sources

  • Manufacturers and suppliers
  • Channel partners
  • Industry experts
  • Strategic decision makers

Secondary sources

  • Industry journals and periodicals
  • Government data
  • Financial reports of key industry players
  • Historical data
  • Press releases

DATA ANALYSIS

Data Synthesis

  • Collation of data
  • Estimation of key figures
  • Analysis of derived insights

Data Validation

  • Triangulation with data models
  • Reference against proprietary databases
  • Corroboration with industry experts

REPORT WRITING

Qualitative

  • Market drivers
  • Market challenges
  • Market trends
  • Five forces analysis

Quantitative

  • Market size and forecast
  • Market segmentation
  • Geographical insights
  • Competitive landscape

Interested in this report?

Get your sample now to see our research methodology and insights!

Download Now

Frequently Asked Questions

Anticoccidial Drugs market growth will increase by USD 93219.2 thousand thousand during 2026-2030.

The Anticoccidial Drugs market is expected to grow at a CAGR of 4.5% during 2026-2030.

Anticoccidial Drugs market is segmented by Drug class (Ionophore, Chemical derivative) Animal type (Poultry, Livestock, Companion animals) Distribution channel (Veterinary hospitals and clinics, Retail pharmacies, Online pharmacies)

AdvaCare Pharma, Ashish Life Science Pvt. Ltd., Bimeda Holdings Ltd., Biogenesis Bago SA, Boehringer Ingelheim GmbH, Ceva Sante Animale, Chanelle Pharma Group, ECO Animal Health Group plc, FATRO SpA, HIPRA SA, Huvepharma Inc, Intas Pharmaceuticals Ltd., Laboratorios Calier S.A., Laboratorios Maymo S.A., Merck and Co. Inc., Norbrook Laboratories Ltd., Ouro Fino Saude Animal Participacoes, Vets Farma Ltd, VH Group, Zenex Animal Health India Ltd., Zoetis Inc. are a few of the key vendors in the Anticoccidial Drugs market.

North America will register the highest growth rate of 42.2% among the other regions. Therefore, the Anticoccidial Drugs market in North America is expected to garner significant business opportunities for the vendors during the forecast period.

US, Canada, Mexico, Germany, UK, France, Italy, Spain, The Netherlands, China, India, Japan, South Korea, Indonesia, Thailand, Brazil, Saudi Arabia, UAE, Turkey, Argentina, Colombia, South Africa, Israel

  • Rising prevalence of parasitic infections in high-density livestock farming is the driving factor this market.

The Anticoccidial Drugs market vendors should focus on grabbing business opportunities from the Drug class segment as it accounted for the largest market share in the base year.
RIA - Research AI Assistant
Ask RIA
