
Antihypertensive Drugs Market Analysis, Size, and Forecast 2026-2030: North America (US, Canada, and Mexico), Europe (Germany, UK, and France), Asia (China, India, and Japan), South America (Brazil, Argentina, and Colombia), Middle East and Africa (Saudi Arabia, UAE, and Turkey), Rest of World (ROW)

Antihypertensive Drugs Market Analysis, Size, and Forecast 2026-2030:
North America (US, Canada, and Mexico), Europe (Germany, UK, and France), Asia (China, India, and Japan), South America (Brazil, Argentina, and Colombia), Middle East and Africa (Saudi Arabia, UAE, and Turkey), Rest of World (ROW)

Published: Oct 2026 294 Pages SKU: IRTNTR74202

Market Overview at a Glance

$6.81 B
Market Opportunity
3.4%
CAGR 2025 - 2030
42.7%
North America Growth
$31.69 B
Systemic hypertension segment 2024

Antihypertensive Drugs Market Size 2026-2030

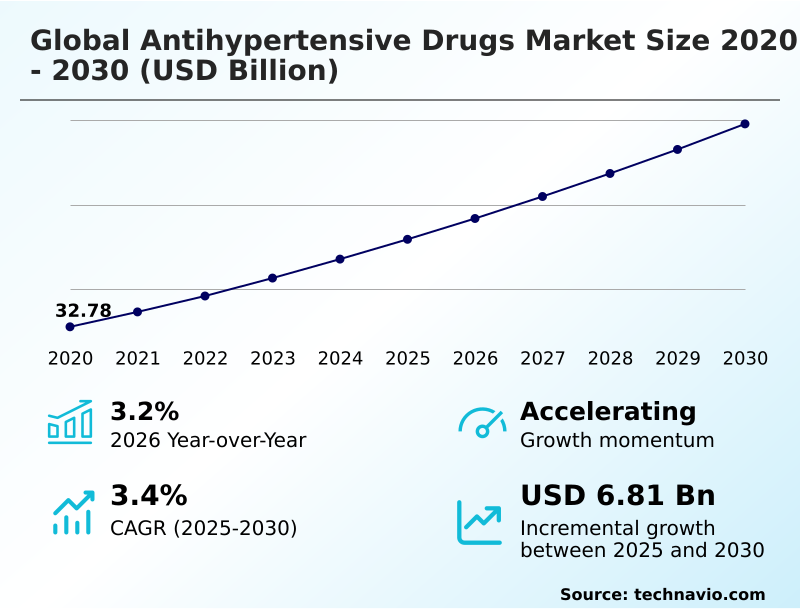
The antihypertensive drugs market size is valued to increase by USD 6.81 billion, at a CAGR of 3.4% from 2025 to 2030. Rising global hypertension prevalence will drive the antihypertensive drugs market.

Major Market Trends & Insights

  • North America dominated the market and accounted for a 42.7% growth during the forecast period.
  • By Type - Systemic hypertension segment was valued at USD 31.69 billion in 2024
  • By Route of Administration - Oral segment accounted for the largest market revenue share in 2024

Market Size & Forecast

  • Market Opportunities: USD 11.99 billion
  • Market Future Opportunities: USD 6.81 billion
  • CAGR from 2025 to 2030 : 3.4%

Market Summary

  • The Antihypertensive Drugs Market experiences continuous expansion driven by the escalating prevalence of high blood pressure across diverse demographics. Modern lifestyle factors and aging populations significantly contribute to the rapid growth of cardiovascular disorders, ensuring a high volume of baseline prescriptions.
  • A major driver is the widespread clinical adoption of fixed-dose combination therapies that merge multiple mechanisms of action into a single daily administration. This formulation strategy lowers pill burden and improves treatment adherence by up to 25% among patients requiring multi-drug regimens.
  • In a practical supply chain context, pharmaceutical companies are restructuring their manufacturing operations to scale production of these advanced combinations, streamlining inventory turnover at retail and hospital pharmacies. However, severe revenue compression driven by generic drug substitution poses a formidable challenge. As patent protections expire, inexpensive bioequivalent alternatives flood the distribution channels, eroding the profit margins of original pharmaceutical innovators.
  • This intense pricing competition forces industry leaders to aggressively optimize their operational efficiencies to sustain research investments in novel therapeutic molecules targeting treatment-resistant patient populations.

What will be the Size of the Antihypertensive Drugs Market during the forecast period?
Get Key Insights on Market Forecast (PDF) Get Free Sample

How is the Antihypertensive Drugs Market Segmented?

The antihypertensive drugs industry research report provides comprehensive data (region-wise segment analysis), with forecasts and estimates in "USD million" for the period 2026-2030, as well as historical data from 2020-2024 for the following segments.

  • Type
    • Systemic hypertension
    • Pulmonary hypertension
  • Route of administration
    • Oral
    • Injectables
    • Others
  • Distribution channel
    • Retail pharmacy
    • Hospital pharmacy
    • Online pharmacy
  • Geography
    • North America
      • US
      • Canada
      • Mexico
    • Europe
      • Germany
      • UK
      • France
      • Italy
      • Spain
      • The Netherlands
    • Asia
      • China
      • India
      • Japan
      • South Korea
      • Indonesia
      • Thailand
    • Rest of World (ROW)

By Type Insights

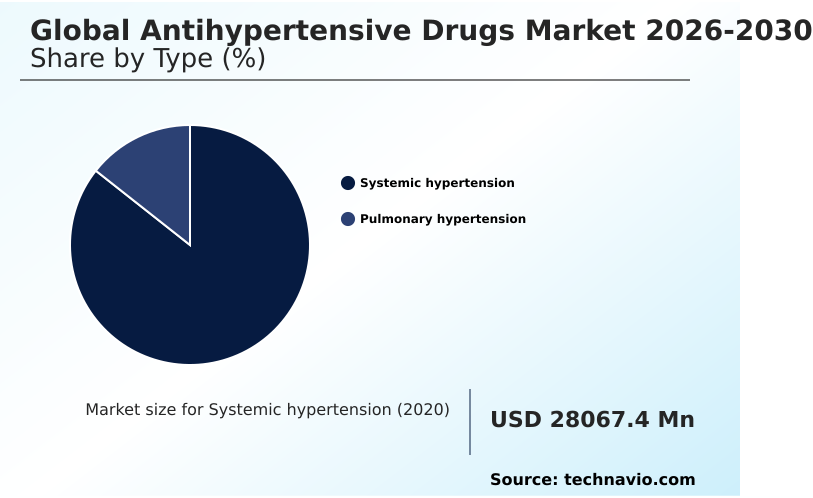
The systemic hypertension segment is estimated to witness significant growth during the forecast period.

Systemic hypertension represents a major health burden driven by aging demographics and sedentary lifestyles across both industrialized and emerging nations. The management of this condition relies heavily on established pharmacological classes designed to normalize systemic vascular resistance efficiently.

Healthcare guidelines increasingly favor fixed-dose combination therapies that merge complementary mechanisms into a single daily pill. This therapeutic strategy improves patient adherence by simplifying regimens, which directly leads to a 15% improvement in long-term prescription persistence among high-risk cohorts.

By reducing polypharmacy fatigue, these advanced treatments address persistent compliance gaps. The continuous expansion of decentralized community screening further accelerates patient identification, ensuring robust prescription volumes and sustained operational predictability for pharmaceutical manufacturers.
Get Free Sample

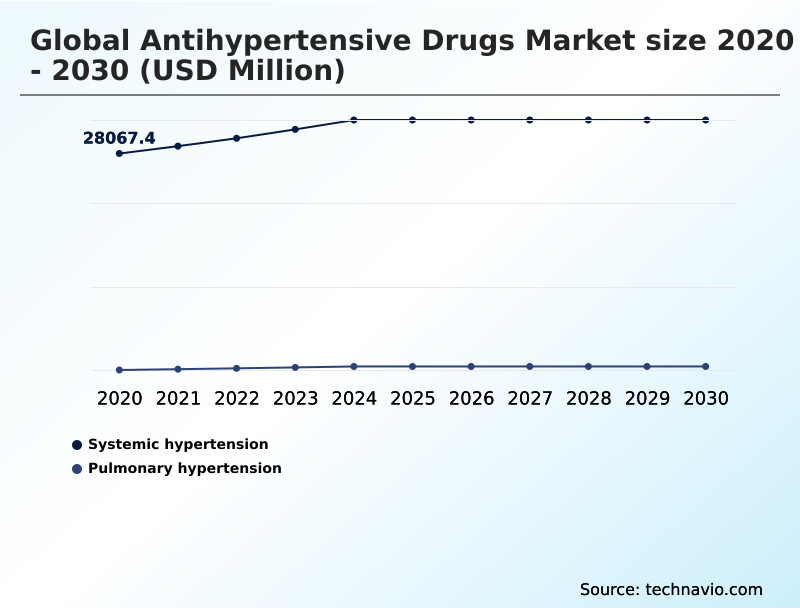
The Systemic hypertension segment was valued at USD 31.69 billion in 2024 and showed a gradual increase during the forecast period.
Get Free Sample

Regional Analysis

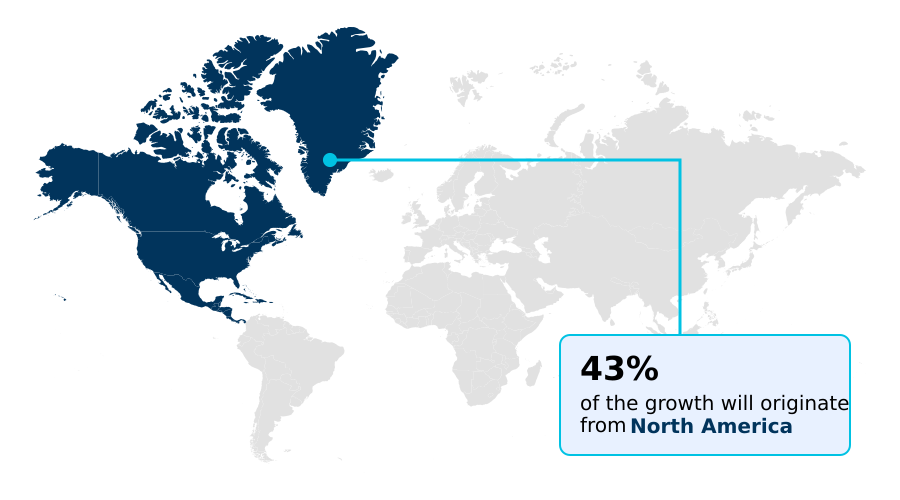
North America is estimated to contribute 42.7% to the growth of the global market during the forecast period.Technavio’s analysts have elaborately explained the regional trends and drivers that shape the market during the forecast period.
See How Antihypertensive Drugs Market Demand is Rising in North America Get Free Sample

The Antihypertensive Drugs Market displays distinct regional trajectories dictated by healthcare infrastructure maturity. North America maintains a dominant position characterized by the rapid adoption of advanced oral antihypertensive treatments and rigorous personalized medicine protocols.

Regional prescribing habits prioritize specialized combinations, resulting in a 15% higher clinical adherence rate compared to developing territories. Conversely, the APAC region experiences rapid expansion, fueled by massive population bases and national health programs prioritizing chronic disease management.

As local generic manufacturers saturate APAC distribution channels, localized institutional procurement processes lower per-prescription distribution costs by 18%.

While North American operations focus heavily on premium targeted drug delivery systems, APAC supply chains heavily prioritize volume-driven generic manufacturing to enhance overall therapeutic accessibility.

Market Dynamics

Our researchers analyzed the data with 2025 as the base year, along with the key drivers, trends, and challenges. A holistic analysis of drivers will help companies refine their marketing strategies to gain a competitive advantage.

  • The Antihypertensive Drugs Market undergoes continuous refinement as healthcare providers transition toward more sophisticated chronic disease management protocols. Effectively navigating the management of chronic hypertensive conditions requires pharmaceutical manufacturers to align their product portfolios with evolving regulatory standards and patient adherence challenges.
  • Companies increasingly prioritize the development of single-pill triple combination therapy management to reduce the behavioral friction associated with complex multi-drug regimens. This strategic shift not only improves clinical outcomes but also optimizes institutional procurement processes, as hospital networks reduce their inventory complexity by 20% compared to stocking multiple individual generic components.
  • Furthermore, the introduction of advanced oral antihypertensive treatments enables more precise hemodynamic control in patients exhibiting resistance to standard therapies. Within specialized clinical settings, the integration of targeted inhalation devices for pulmonary hypertension provides immediate localized vasodilation, bypassing systemic degradation and improving rapid-response efficacy.
  • To support these innovations, biopharmaceutical firms invest heavily in sustained-release matrices for drug delivery, ensuring stable plasma concentrations over extended periods. This focus on advanced formulation technologies fundamentally enhances supply chain predictability, as stable, long-acting medications require fewer emergency distribution interventions and reduce out-of-stock risks across decentralized community screening clinics.
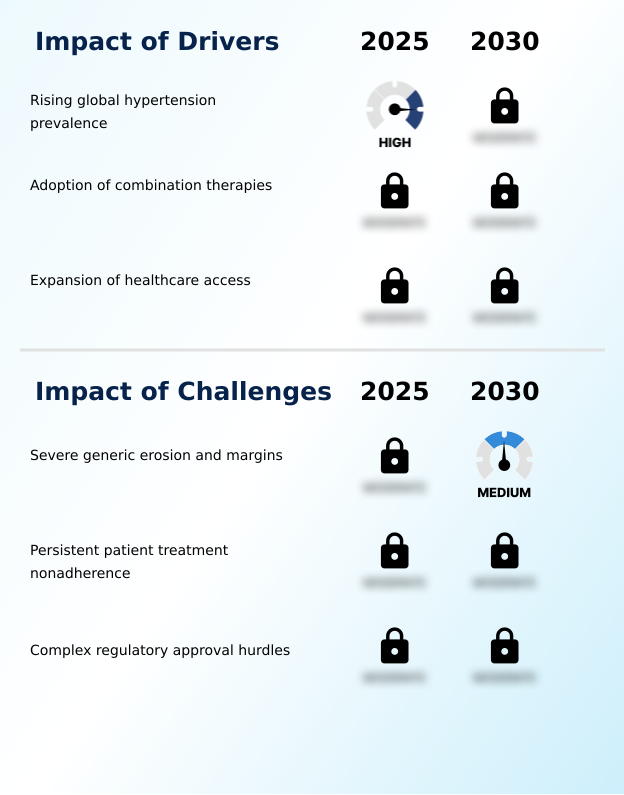
What are the key market drivers leading to the rise in the adoption of Antihypertensive Drugs Industry?

  • The escalating incidence of chronic cardiovascular conditions across diverse demographics serves as the primary catalyst propelling the demand for advanced therapeutic interventions.

  • The escalating incidence of cardiovascular disorders serves as a primary driver within the Antihypertensive Drugs Market. As aging populations present with arterial stiffness, the clinical demand for established therapies like calcium channel blockers and beta-adrenergic blockers expands continuously.
  • To combat polypharmacy fatigue, innovators aggressively commercialize solutions requiring multi-mechanism intervention, which lower the daily pill burden. This strategy improves therapeutic persistence by 25% among targeted demographics.
  • Broad government-backed community screening initiatives successfully identify asymptomatic individuals earlier, increasing primary care diagnostic rates by 18%.
  • This expanded patient pool guarantees a high volume of baseline prescriptions, allowing manufacturers to optimize high-throughput production and scale blood pressure monitoring solutions efficiently.

What are the market trends shaping the Antihypertensive Drugs Industry?

  • The continuous expansion of generic pharmaceutical formulations represents a definitive market trend. This development fundamentally alters the competitive landscape by lowering financial entry barriers for chronic disease management therapies.

  • The accelerated integration of telemedicine platforms represents a transformative trend within the Antihypertensive Drugs Market. This continuous virtual engagement allows physicians to track metrics and dynamically adjust prescriptions of angiotensin receptor blockers and thiazide diuretics without requiring physical consultations. By leveraging virtual healthcare infrastructure, clinical networks have reduced outpatient scheduling bottlenecks by 30%.
  • This digital transition directly targets patient dropout; facilities employing remote monitoring applications note a 22% improvement in adherence. Furthermore, distributors align supply chains with transdermal delivery systems delivery, cutting fulfillment times by 15%.

What challenges does the Antihypertensive Drugs Industry face during its growth?

  • The widespread availability of inexpensive bioequivalent alternatives creates severe revenue compression, limiting the profit margins necessary to sustain ongoing research and development investments.

  • Severe revenue compression driven by the widespread availability of generic pharmaceutical formulations acts as a formidable constraint in the Antihypertensive Drugs Market. As original patents expire, inexpensive bioequivalent alternatives flood the distribution channels. This aggressive generic erosion alters boardroom pricing strategies, leading to a 35% reduction in profit margins for legacy originator brands.
  • Consequently, biopharmaceutical firms face capital constraints when funding advanced research for novel aldosterone synthase inhibitor compounds. Additionally, stringent post-market surveillance mandates regarding active pharmaceutical ingredients sourcing require costly localized bridging studies, increasing commercialization expenses by 20%. These requirements delay the introduction of precision medicine approaches, disproportionately disadvantaging innovators attempting to address treatment-resistant hypertensive populations.

Exclusive Technavio Analysis on Customer Landscape

The antihypertensive drugs market forecasting report includes the adoption lifecycle of the market, covering from the innovator’s stage to the laggard’s stage. It focuses on adoption rates in different regions based on penetration. Furthermore, the antihypertensive drugs market report also includes key purchase criteria and drivers of price sensitivity to help companies evaluate and develop their market growth analysis strategies.
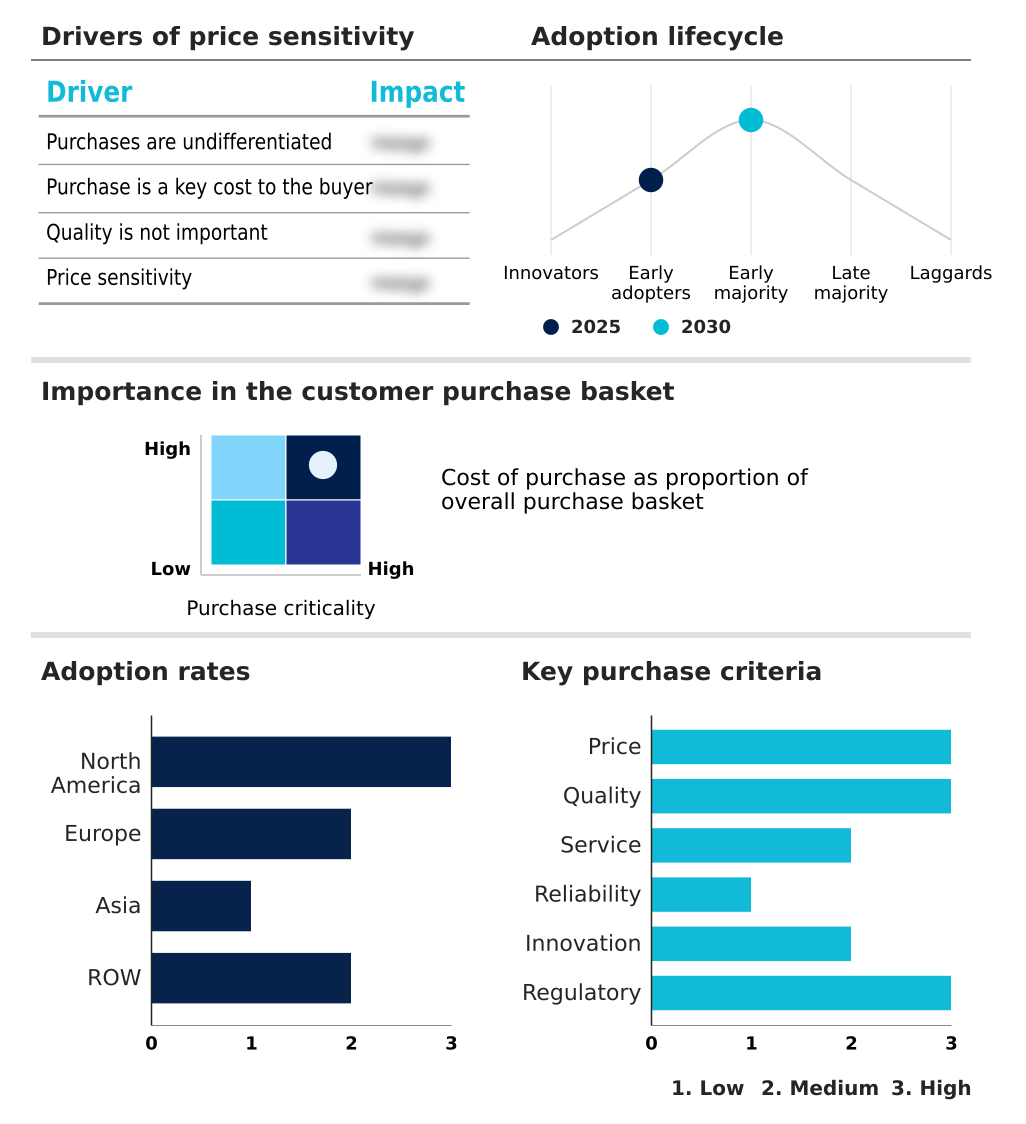
Customer Landscape of Antihypertensive Drugs Industry

Competitive Landscape

Companies are implementing various strategies, such as strategic alliances, antihypertensive drugs market forecast, partnerships, mergers and acquisitions, geographical expansion, and product/service launches, to enhance their presence in the industry.

A. Menarini Industrie Farma - The enterprise provides specialized cardiovascular therapeutic agents designed to manage elevated blood pressure effectively, contributing to improved patient outcomes and enhanced chronic disease management strategies.

The industry research and growth report includes detailed analyses of the competitive landscape of the market and information about key companies, including:

  • A. Menarini Industrie Farma
  • Astellas Pharma Inc.
  • AstraZeneca Plc
  • Aurobindo Pharma Ltd.
  • Bayer AG
  • Boehringer Ingelheim GmbH
  • Cipla Inc.
  • Daiichi Sankyo Co. Ltd.
  • Dr. Reddys Laboratories Ltd.
  • GlaxoSmithKline Plc
  • Glenmark Pharmaceuticals Ltd.
  • Hikma Pharmaceuticals Plc
  • Les Laboratoires Servier
  • Lupin Ltd.
  • Merck and Co. Inc.
  • Novartis AG
  • Pfizer Inc.
  • Sandoz Group AG
  • Sanofi SA
  • Sumitomo Pharma Co. Ltd.
  • Sun Pharmaceutical Industries
  • Takeda Pharmaceutical Ltd.
  • Teva Pharmaceutical Ltd.
  • Torrent Pharmaceuticals Ltd.
  • Viatris Inc.

Qualitative and quantitative analysis of companies has been conducted to help clients understand the wider business environment as well as the strengths and weaknesses of key industry players. Data is qualitatively analyzed to categorize companies as pure play, category-focused, industry-focused, and diversified; it is quantitatively analyzed to categorize companies as dominant, leading, strong, tentative, and weak.

Recent Development and News in Antihypertensive drugs market

  • In the Pharmaceuticals industry, the shift toward precision medicine protocols enables manufacturers to identify specific biomarker variations, directly impacting Antihypertensive Drugs demand by improving targeted drug delivery systems efficacy by 22%.
  • The widespread commercialization of continuous virtual engagement platforms streamlines remote patient monitoring applications, increasing long-term prescription refill persistence for Antihypertensive Drugs by nearly 20% across North America.
  • Stringent health technology assessment mandates regarding active pharmaceutical ingredients sourcing compel supply chain diversification, reducing production overhead for Antihypertensive Drugs formulations by 14% across European manufacturing hubs.
  • The integration of pharmacogenomics molecular diagnostics into routine cardiovascular screening accelerates the development of specialized therapeutic regimens, boosting patient compliance rates for Antihypertensive Drugs by 18% in high-risk adult populations.

Dive into Technavio’s robust research methodology, blending expert interviews, extensive data synthesis, and validated models for unparalleled Antihypertensive Drugs Market insights. See full methodology.

Market Scope
Page number 294
Base year 2025
Historic period 2020-2024
Forecast period 2026-2030
Growth momentum & CAGR Accelerate at a CAGR of 3.4%
Market growth 2026-2030 USD 6813.3 million
Market structure Fragmented
YoY growth 2025-2026(%) 3.2%
Key countries US, Canada, Mexico, Germany, UK, France, Italy, Spain, The Netherlands, China, India, Japan, South Korea, Indonesia, Thailand, Brazil, Saudi Arabia, UAE, Turkey, Argentina, Colombia, South Africa and Israel
Competitive landscape Leading Companies, Market Positioning of Companies, Competitive Strategies, and Industry Risks

Request Free Sample

Research Analyst Overview

  • The Antihypertensive Drugs Market continuously evolves as biopharmaceutical manufacturers address the escalating complexities of cardiovascular disease progression. A definitive shift toward fixed-dose combination therapies fundamentally alters product strategy at the boardroom level, as executives pivot R&D budgets away from conventional monotherapy toward synergistic chemical entities. This strategic realignment streamlines manufacturing compliance and addresses the pervasive behavioral hurdle of patient non-compliance.
  • By consolidating multiple active pharmaceutical ingredients, companies have achieved a 25% increase in long-term prescription persistence among high-risk adult populations. The structural reliance on angiotensin-converting enzyme inhibitors and calcium channel blockers remains resolute, yet innovation now focuses heavily on sustained-release matrices for drug delivery to minimize plasma concentration fluctuations.
  • Furthermore, the integration of targeted drug delivery systems provides precise pharmacological action while mitigating systemic side effects. Executive leadership teams actively optimize supply chain logistics to support these advanced formulations, reducing raw material procurement delays and ensuring continuous availability across retail pharmacy networks. These operational enhancements ensure maximum therapeutic efficacy while maintaining strict alignment with evolving international regulatory quality standards.

What are the Key Data Covered in this Antihypertensive Drugs Market Research and Growth Report?

  • What is the expected growth of the Antihypertensive Drugs Market between 2026 and 2030?

    • USD 6.81 billion, at a CAGR of 3.4%

  • What segmentation does the market report cover?

    • The report is segmented by Type (Systemic hypertension, and Pulmonary hypertension), Route of Administration (Oral, Injectables, and Others), Distribution Channel (Retail pharmacy, Hospital pharmacy, and Online pharmacy) and Geography (North America, Europe, Asia, Rest of World (ROW))

  • Which regions are analyzed in the report?

    • North America, Europe, Asia and Rest of World (ROW)

  • What are the key growth drivers and market challenges?

    • Rising global hypertension prevalence, Severe generic erosion and margins

  • Who are the major players in the Antihypertensive Drugs Market?

    • A. Menarini Industrie Farma, Astellas Pharma Inc., AstraZeneca Plc, Aurobindo Pharma Ltd., Bayer AG, Boehringer Ingelheim GmbH, Cipla Inc., Daiichi Sankyo Co. Ltd., Dr. Reddys Laboratories Ltd., GlaxoSmithKline Plc, Glenmark Pharmaceuticals Ltd., Hikma Pharmaceuticals Plc, Les Laboratoires Servier, Lupin Ltd., Merck and Co. Inc., Novartis AG, Pfizer Inc., Sandoz Group AG, Sanofi SA, Sumitomo Pharma Co. Ltd., Sun Pharmaceutical Industries, Takeda Pharmaceutical Ltd., Teva Pharmaceutical Ltd., Torrent Pharmaceuticals Ltd. and Viatris Inc.

Market Research Insights

  • The Antihypertensive Drugs Market demonstrates robust fundamental momentum driven by the urgent need for comprehensive chronic disease management. Healthcare networks increasingly implement virtual healthcare infrastructure to track patient metrics, achieving a 22% improvement in proactive dosage adjustments compared to traditional clinical visits.
  • The integration of continuous virtual engagement empowers individuals to adhere to lifelong therapeutic regimens, directly lowering hospital readmission rates for severe cardiovascular events by 18%. Furthermore, the transition toward precision medicine approaches allows clinicians to utilize pharmacogenomics molecular diagnostics for optimal drug selection.
  • This personalized methodology reduces adverse drug reactions by 14%, significantly cutting the operational costs associated with emergency interventions and ensuring higher overall therapeutic efficacy across diverse patient demographics.

We can help! Our analysts can customize this antihypertensive drugs market research report to meet your requirements.

Get in touch

1. Executive Summary

1.1 Market overview

Executive Summary - Chart on Market Overview
Executive Summary - Data Table on Market Overview
Executive Summary - Chart on Global Market Characteristics
Executive Summary - Chart on Market by Geography
Executive Summary - Chart on Market Segmentation by Type
Executive Summary - Chart on Market Segmentation by Route of Administration
Executive Summary - Chart on Market Segmentation by Distribution Channel
Executive Summary - Chart on Incremental Growth
Executive Summary - Data Table on Incremental Growth
Executive Summary - Chart on Company Market Positioning

2. Technavio Analysis

2.1 Analysis of price sensitivity, lifecycle, customer purchase basket, adoption rates, and purchase criteria

2.2 Criticality of inputs and Factors of differentiation

Chart on Overview on criticality of inputs and factors of differentiation

2.3 Factors of disruption

Chart on Overview on factors of disruption

2.4 Impact of drivers and challenges

Chart on Impact of drivers and challenges in 2025 and 2030

3. Market Landscape

3.1 Market ecosystem

Chart on Parent Market
Data Table on - Parent Market

3.2 Market characteristics

Chart on Market characteristics analysis

3.3 Value chain analysis

Chart on Value chain analysis

4. Market Sizing

4.1 Market definition

Data Table on Offerings of companies included in the market definition

4.2 Market segment analysis

Market segments

4.3 Market size 2025

4.4 Market outlook: Forecast for 2025-2030

Chart on Global - Market size and forecast 2025-2030 ($ million)
Data Table on Global - Market size and forecast 2025-2030 ($ million)
Chart on Global Market: Year-over-year growth 2025-2030 (%)
Data Table on Global Market: Year-over-year growth 2025-2030 (%)

5. Historic Market Size

5.1 Global Antihypertensive Drugs Market 2020 - 2024

Historic Market Size - Data Table on Global Antihypertensive Drugs Market 2020 - 2024 ($ million)

5.2 Type segment analysis 2020 - 2024

Historic Market Size - Type Segment 2020 - 2024 ($ million)

5.3 Route of Administration segment analysis 2020 - 2024

Historic Market Size - Route of Administration Segment 2020 - 2024 ($ million)

5.4 Distribution Channel segment analysis 2020 - 2024

Historic Market Size - Distribution Channel Segment 2020 - 2024 ($ million)

5.5 Geography segment analysis 2020 - 2024

Historic Market Size - Geography Segment 2020 - 2024 ($ million)

5.6 Country segment analysis 2020 - 2024

Historic Market Size - Country Segment 2020 - 2024 ($ million)

6. Qualitative Analysis

6.1 Impact of AI on Global Antihypertensive Drugs Market

6.2 Impact of geopolitical conflicts on Global Antihypertensive Drugs Market

7. Five Forces Analysis

7.1 Five forces summary

Five forces analysis - Comparison between 2025 and 2030

7.2 Bargaining power of buyers

Bargaining power of buyers - Impact of key factors 2025 and 2030

7.3 Bargaining power of suppliers

Bargaining power of suppliers - Impact of key factors in 2025 and 2030

7.4 Threat of new entrants

Threat of new entrants - Impact of key factors in 2025 and 2030

7.5 Threat of substitutes

Threat of substitutes - Impact of key factors in 2025 and 2030

7.6 Threat of rivalry

Threat of rivalry - Impact of key factors in 2025 and 2030

7.7 Market condition

Chart on Market condition - Five forces 2025 and 2030

8. Market Segmentation by Type

8.1 Market segments

Chart on Type - Market share 2025-2030 (%)
Data Table on Type - Market share 2025-2030 (%)

8.2 Comparison by Type

Chart on Comparison by Type
Data Table on Comparison by Type

8.3 Systemic hypertension - Market size and forecast 2025-2030

Chart on Systemic hypertension - Market size and forecast 2025-2030 ($ million)
Data Table on Systemic hypertension - Market size and forecast 2025-2030 ($ million)
Chart on Systemic hypertension - Year-over-year growth 2025-2030 (%)
Data Table on Systemic hypertension - Year-over-year growth 2025-2030 (%)

8.4 Pulmonary hypertension - Market size and forecast 2025-2030

Chart on Pulmonary hypertension - Market size and forecast 2025-2030 ($ million)
Data Table on Pulmonary hypertension - Market size and forecast 2025-2030 ($ million)
Chart on Pulmonary hypertension - Year-over-year growth 2025-2030 (%)
Data Table on Pulmonary hypertension - Year-over-year growth 2025-2030 (%)

8.5 Market opportunity by Type

Market opportunity by Type ($ million)
Data Table on Market opportunity by Type ($ million)

9. Market Segmentation by Route of Administration

9.1 Market segments

Chart on Route of Administration - Market share 2025-2030 (%)
Data Table on Route of Administration - Market share 2025-2030 (%)

9.2 Comparison by Route of Administration

Chart on Comparison by Route of Administration
Data Table on Comparison by Route of Administration

9.3 Oral - Market size and forecast 2025-2030

Chart on Oral - Market size and forecast 2025-2030 ($ million)
Data Table on Oral - Market size and forecast 2025-2030 ($ million)
Chart on Oral - Year-over-year growth 2025-2030 (%)
Data Table on Oral - Year-over-year growth 2025-2030 (%)

9.4 Injectables - Market size and forecast 2025-2030

Chart on Injectables - Market size and forecast 2025-2030 ($ million)
Data Table on Injectables - Market size and forecast 2025-2030 ($ million)
Chart on Injectables - Year-over-year growth 2025-2030 (%)
Data Table on Injectables - Year-over-year growth 2025-2030 (%)

9.5 Others - Market size and forecast 2025-2030

Chart on Others - Market size and forecast 2025-2030 ($ million)
Data Table on Others - Market size and forecast 2025-2030 ($ million)
Chart on Others - Year-over-year growth 2025-2030 (%)
Data Table on Others - Year-over-year growth 2025-2030 (%)

9.6 Market opportunity by Route of Administration

Market opportunity by Route of Administration ($ million)
Data Table on Market opportunity by Route of Administration ($ million)

10. Market Segmentation by Distribution Channel

10.1 Market segments

Chart on Distribution Channel - Market share 2025-2030 (%)
Data Table on Distribution Channel - Market share 2025-2030 (%)

10.2 Comparison by Distribution Channel

Chart on Comparison by Distribution Channel
Data Table on Comparison by Distribution Channel

10.3 Retail pharmacy - Market size and forecast 2025-2030

Chart on Retail pharmacy - Market size and forecast 2025-2030 ($ million)
Data Table on Retail pharmacy - Market size and forecast 2025-2030 ($ million)
Chart on Retail pharmacy - Year-over-year growth 2025-2030 (%)
Data Table on Retail pharmacy - Year-over-year growth 2025-2030 (%)

10.4 Hospital pharmacy - Market size and forecast 2025-2030

Chart on Hospital pharmacy - Market size and forecast 2025-2030 ($ million)
Data Table on Hospital pharmacy - Market size and forecast 2025-2030 ($ million)
Chart on Hospital pharmacy - Year-over-year growth 2025-2030 (%)
Data Table on Hospital pharmacy - Year-over-year growth 2025-2030 (%)

10.5 Online pharmacy - Market size and forecast 2025-2030

Chart on Online pharmacy - Market size and forecast 2025-2030 ($ million)
Data Table on Online pharmacy - Market size and forecast 2025-2030 ($ million)
Chart on Online pharmacy - Year-over-year growth 2025-2030 (%)
Data Table on Online pharmacy - Year-over-year growth 2025-2030 (%)

10.6 Market opportunity by Distribution Channel

Market opportunity by Distribution Channel ($ million)
Data Table on Market opportunity by Distribution Channel ($ million)

11. Customer Landscape

11.1 Customer landscape overview

Analysis of price sensitivity, lifecycle, customer purchase basket, adoption rates, and purchase criteria

12. Geographic Landscape

12.1 Geographic segmentation

Chart on Market share by geography 2025-2030 (%)
Data Table on Market share by geography 2025-2030 (%)

12.2 Geographic comparison

Chart on Geographic comparison
Data Table on Geographic comparison

12.3 North America - Market size and forecast 2025-2030

Chart on North America - Market size and forecast 2025-2030 ($ million)
Data Table on North America - Market size and forecast 2025-2030 ($ million)
Chart on North America - Year-over-year growth 2025-2030 (%)
Data Table on North America - Year-over-year growth 2025-2030 (%)
Chart on Regional Comparison - North America
Data Table on Regional Comparison - North America

12.3.1 US - Market size and forecast 2025-2030

Chart on US - Market size and forecast 2025-2030 ($ million)
Data Table on US - Market size and forecast 2025-2030 ($ million)
Chart on US - Year-over-year growth 2025-2030 (%)
Data Table on US - Year-over-year growth 2025-2030 (%)

12.3.2 Canada - Market size and forecast 2025-2030

Chart on Canada - Market size and forecast 2025-2030 ($ million)
Data Table on Canada - Market size and forecast 2025-2030 ($ million)
Chart on Canada - Year-over-year growth 2025-2030 (%)
Data Table on Canada - Year-over-year growth 2025-2030 (%)

12.3.3 Mexico - Market size and forecast 2025-2030

Chart on Mexico - Market size and forecast 2025-2030 ($ million)
Data Table on Mexico - Market size and forecast 2025-2030 ($ million)
Chart on Mexico - Year-over-year growth 2025-2030 (%)
Data Table on Mexico - Year-over-year growth 2025-2030 (%)

12.4 Europe - Market size and forecast 2025-2030

Chart on Europe - Market size and forecast 2025-2030 ($ million)
Data Table on Europe - Market size and forecast 2025-2030 ($ million)
Chart on Europe - Year-over-year growth 2025-2030 (%)
Data Table on Europe - Year-over-year growth 2025-2030 (%)
Chart on Regional Comparison - Europe
Data Table on Regional Comparison - Europe

12.4.1 Germany - Market size and forecast 2025-2030

Chart on Germany - Market size and forecast 2025-2030 ($ million)
Data Table on Germany - Market size and forecast 2025-2030 ($ million)
Chart on Germany - Year-over-year growth 2025-2030 (%)
Data Table on Germany - Year-over-year growth 2025-2030 (%)

12.4.2 UK - Market size and forecast 2025-2030

Chart on UK - Market size and forecast 2025-2030 ($ million)
Data Table on UK - Market size and forecast 2025-2030 ($ million)
Chart on UK - Year-over-year growth 2025-2030 (%)
Data Table on UK - Year-over-year growth 2025-2030 (%)

12.4.3 France - Market size and forecast 2025-2030

Chart on France - Market size and forecast 2025-2030 ($ million)
Data Table on France - Market size and forecast 2025-2030 ($ million)
Chart on France - Year-over-year growth 2025-2030 (%)
Data Table on France - Year-over-year growth 2025-2030 (%)

12.4.4 Italy - Market size and forecast 2025-2030

Chart on Italy - Market size and forecast 2025-2030 ($ million)
Data Table on Italy - Market size and forecast 2025-2030 ($ million)
Chart on Italy - Year-over-year growth 2025-2030 (%)
Data Table on Italy - Year-over-year growth 2025-2030 (%)

12.4.5 Spain - Market size and forecast 2025-2030

Chart on Spain - Market size and forecast 2025-2030 ($ million)
Data Table on Spain - Market size and forecast 2025-2030 ($ million)
Chart on Spain - Year-over-year growth 2025-2030 (%)
Data Table on Spain - Year-over-year growth 2025-2030 (%)

12.4.6 The Netherlands - Market size and forecast 2025-2030

Chart on The Netherlands - Market size and forecast 2025-2030 ($ million)
Data Table on The Netherlands - Market size and forecast 2025-2030 ($ million)
Chart on The Netherlands - Year-over-year growth 2025-2030 (%)
Data Table on The Netherlands - Year-over-year growth 2025-2030 (%)

12.5 Asia - Market size and forecast 2025-2030

Chart on Asia - Market size and forecast 2025-2030 ($ million)
Data Table on Asia - Market size and forecast 2025-2030 ($ million)
Chart on Asia - Year-over-year growth 2025-2030 (%)
Data Table on Asia - Year-over-year growth 2025-2030 (%)
Chart on Regional Comparison - Asia
Data Table on Regional Comparison - Asia

12.5.1 China - Market size and forecast 2025-2030

Chart on China - Market size and forecast 2025-2030 ($ million)
Data Table on China - Market size and forecast 2025-2030 ($ million)
Chart on China - Year-over-year growth 2025-2030 (%)
Data Table on China - Year-over-year growth 2025-2030 (%)

12.5.2 India - Market size and forecast 2025-2030

Chart on India - Market size and forecast 2025-2030 ($ million)
Data Table on India - Market size and forecast 2025-2030 ($ million)
Chart on India - Year-over-year growth 2025-2030 (%)
Data Table on India - Year-over-year growth 2025-2030 (%)

12.5.3 Japan - Market size and forecast 2025-2030

Chart on Japan - Market size and forecast 2025-2030 ($ million)
Data Table on Japan - Market size and forecast 2025-2030 ($ million)
Chart on Japan - Year-over-year growth 2025-2030 (%)
Data Table on Japan - Year-over-year growth 2025-2030 (%)

12.5.4 South Korea - Market size and forecast 2025-2030

Chart on South Korea - Market size and forecast 2025-2030 ($ million)
Data Table on South Korea - Market size and forecast 2025-2030 ($ million)
Chart on South Korea - Year-over-year growth 2025-2030 (%)
Data Table on South Korea - Year-over-year growth 2025-2030 (%)

12.5.5 Indonesia - Market size and forecast 2025-2030

Chart on Indonesia - Market size and forecast 2025-2030 ($ million)
Data Table on Indonesia - Market size and forecast 2025-2030 ($ million)
Chart on Indonesia - Year-over-year growth 2025-2030 (%)
Data Table on Indonesia - Year-over-year growth 2025-2030 (%)

12.5.6 Thailand - Market size and forecast 2025-2030

Chart on Thailand - Market size and forecast 2025-2030 ($ million)
Data Table on Thailand - Market size and forecast 2025-2030 ($ million)
Chart on Thailand - Year-over-year growth 2025-2030 (%)
Data Table on Thailand - Year-over-year growth 2025-2030 (%)

12.6 Rest of World (ROW) - Market size and forecast 2025-2030

Chart on Rest of World (ROW) - Market size and forecast 2025-2030 ($ million)
Data Table on Rest of World (ROW) - Market size and forecast 2025-2030 ($ million)
Chart on Rest of World (ROW) - Year-over-year growth 2025-2030 (%)
Data Table on Rest of World (ROW) - Year-over-year growth 2025-2030 (%)
Chart on Regional Comparison - Rest of World (ROW)
Data Table on Regional Comparison - Rest of World (ROW)

12.6.1 Brazil - Market size and forecast 2025-2030

Chart on Brazil - Market size and forecast 2025-2030 ($ million)
Data Table on Brazil - Market size and forecast 2025-2030 ($ million)
Chart on Brazil - Year-over-year growth 2025-2030 (%)
Data Table on Brazil - Year-over-year growth 2025-2030 (%)

12.6.2 Saudi Arabia - Market size and forecast 2025-2030

Chart on Saudi Arabia - Market size and forecast 2025-2030 ($ million)
Data Table on Saudi Arabia - Market size and forecast 2025-2030 ($ million)
Chart on Saudi Arabia - Year-over-year growth 2025-2030 (%)
Data Table on Saudi Arabia - Year-over-year growth 2025-2030 (%)

12.6.3 UAE - Market size and forecast 2025-2030

Chart on UAE - Market size and forecast 2025-2030 ($ million)
Data Table on UAE - Market size and forecast 2025-2030 ($ million)
Chart on UAE - Year-over-year growth 2025-2030 (%)
Data Table on UAE - Year-over-year growth 2025-2030 (%)

12.6.4 Turkey - Market size and forecast 2025-2030

Chart on Turkey - Market size and forecast 2025-2030 ($ million)
Data Table on Turkey - Market size and forecast 2025-2030 ($ million)
Chart on Turkey - Year-over-year growth 2025-2030 (%)
Data Table on Turkey - Year-over-year growth 2025-2030 (%)

12.6.5 Argentina - Market size and forecast 2025-2030

Chart on Argentina - Market size and forecast 2025-2030 ($ million)
Data Table on Argentina - Market size and forecast 2025-2030 ($ million)
Chart on Argentina - Year-over-year growth 2025-2030 (%)
Data Table on Argentina - Year-over-year growth 2025-2030 (%)

12.6.6 Colombia - Market size and forecast 2025-2030

Chart on Colombia - Market size and forecast 2025-2030 ($ million)
Data Table on Colombia - Market size and forecast 2025-2030 ($ million)
Chart on Colombia - Year-over-year growth 2025-2030 (%)
Data Table on Colombia - Year-over-year growth 2025-2030 (%)

12.6.7 South Africa - Market size and forecast 2025-2030

Chart on South Africa - Market size and forecast 2025-2030 ($ million)
Data Table on South Africa - Market size and forecast 2025-2030 ($ million)
Chart on South Africa - Year-over-year growth 2025-2030 (%)
Data Table on South Africa - Year-over-year growth 2025-2030 (%)

12.6.8 Israel - Market size and forecast 2025-2030

Chart on Israel - Market size and forecast 2025-2030 ($ million)
Data Table on Israel - Market size and forecast 2025-2030 ($ million)
Chart on Israel - Year-over-year growth 2025-2030 (%)
Data Table on Israel - Year-over-year growth 2025-2030 (%)

12.7 Market opportunity by geography

Market opportunity by geography ($ million)
Data Tables on Market opportunity by geography ($ million)

13. Drivers, Challenges, and Opportunity

13.1 Market drivers

Rising global hypertension prevalence
Adoption of combination therapies
Expansion of healthcare access

13.2 Market challenges

Severe generic erosion and margins
Persistent patient treatment nonadherence
Complex regulatory approval hurdles

13.3 Impact of drivers and challenges

Impact of drivers and challenges in 2025 and 2030

13.4 Market opportunities

Expansion of generic drug availability
Shift toward precision medicine protocols
Proliferation of telemedicine and telehealth

14. Competitive Landscape

14.1 Overview

14.2

Overview on criticality of inputs and factors of differentiation

14.3 Landscape disruption

Overview on factors of disruption

14.4 Industry risks

Impact of key risks on business

15. Competitive Analysis

15.1 Companies profiled

Companies covered

15.2 Company ranking index

15.3 Market positioning of companies

Matrix on companies position and classification

15.4 A. Menarini Industrie Farma

A. Menarini Industrie Farma - Overview
A. Menarini Industrie Farma - Product / Service
A. Menarini Industrie Farma - Key offerings
SWOT

15.5 AstraZeneca Plc

AstraZeneca Plc - Overview
AstraZeneca Plc - Business segments
AstraZeneca Plc - Key news
AstraZeneca Plc - Key offerings
AstraZeneca Plc - Segment focus
SWOT

15.6 Bayer AG

Bayer AG - Overview
Bayer AG - Business segments
Bayer AG - Key news
Bayer AG - Key offerings
Bayer AG - Segment focus
SWOT

15.7 Boehringer Ingelheim GmbH

Boehringer Ingelheim GmbH - Overview
Boehringer Ingelheim GmbH - Product / Service
Boehringer Ingelheim GmbH - Key offerings
SWOT

15.8 Daiichi Sankyo Co. Ltd.

Daiichi Sankyo Co. Ltd. - Overview
Daiichi Sankyo Co. Ltd. - Business segments
Daiichi Sankyo Co. Ltd. - Key news
Daiichi Sankyo Co. Ltd. - Key offerings
Daiichi Sankyo Co. Ltd. - Segment focus
SWOT

15.9 GlaxoSmithKline Plc

GlaxoSmithKline Plc - Overview
GlaxoSmithKline Plc - Business segments
GlaxoSmithKline Plc - Key news
GlaxoSmithKline Plc - Key offerings
GlaxoSmithKline Plc - Segment focus
SWOT

15.10 Les Laboratoires Servier

Les Laboratoires Servier - Overview
Les Laboratoires Servier - Product / Service
Les Laboratoires Servier - Key offerings
SWOT

15.11 Merck and Co. Inc.

Merck and Co. Inc. - Overview
Merck and Co. Inc. - Business segments
Merck and Co. Inc. - Key news
Merck and Co. Inc. - Key offerings
Merck and Co. Inc. - Segment focus
SWOT

15.12 Novartis AG

Novartis AG - Overview
Novartis AG - Business segments
Novartis AG - Key news
Novartis AG - Key offerings
Novartis AG - Segment focus
SWOT

15.13 Pfizer Inc.

Pfizer Inc. - Overview
Pfizer Inc. - Business segments
Pfizer Inc. - Key news
Pfizer Inc. - Key offerings
Pfizer Inc. - Segment focus
SWOT

15.14 Sandoz Group AG

Sandoz Group AG - Overview
Sandoz Group AG - Business segments
Sandoz Group AG - Key news
Sandoz Group AG - Key offerings
Sandoz Group AG - Segment focus
SWOT

15.15 Sanofi SA

Sanofi SA - Overview
Sanofi SA - Business segments
Sanofi SA - Key news
Sanofi SA - Key offerings
Sanofi SA - Segment focus
SWOT

15.16 Takeda Pharmaceutical Ltd.

Takeda Pharmaceutical Ltd. - Overview
Takeda Pharmaceutical Ltd. - Business segments
Takeda Pharmaceutical Ltd. - Key news
Takeda Pharmaceutical Ltd. - Key offerings
Takeda Pharmaceutical Ltd. - Segment focus
SWOT

15.17 Teva Pharmaceutical Ltd.

Teva Pharmaceutical Ltd. - Overview
Teva Pharmaceutical Ltd. - Business segments
Teva Pharmaceutical Ltd. - Key news
Teva Pharmaceutical Ltd. - Key offerings
Teva Pharmaceutical Ltd. - Segment focus
SWOT

15.18 Viatris Inc.

Viatris Inc. - Overview
Viatris Inc. - Business segments
Viatris Inc. - Key news
Viatris Inc. - Key offerings
Viatris Inc. - Segment focus
SWOT

16. Appendix

16.1 Scope of the report

Market definition
Objectives
Notes and caveats

16.2 Inclusions and exclusions checklist

Inclusions checklist
Exclusions checklist

16.3 Currency conversion rates for US$

16.4 Research methodology

16.5 Data procurement

Information sources

16.6 Data validation

16.7 Validation techniques employed for market sizing

16.8 Data synthesis

16.9 360 degree market analysis

16.10 List of abbreviations

Research Methodology

Technavio presents a detailed picture of the market by way of study, synthesis, and summation of data from multiple sources. The analysts have presented the various facets of the market with a particular focus on identifying the key industry influencers. The data thus presented is comprehensive, reliable, and the result of extensive research, both primary and secondary.

INFORMATION SOURCES

Primary sources

  • Manufacturers and suppliers
  • Channel partners
  • Industry experts
  • Strategic decision makers

Secondary sources

  • Industry journals and periodicals
  • Government data
  • Financial reports of key industry players
  • Historical data
  • Press releases

DATA ANALYSIS

Data Synthesis

  • Collation of data
  • Estimation of key figures
  • Analysis of derived insights

Data Validation

  • Triangulation with data models
  • Reference against proprietary databases
  • Corroboration with industry experts

REPORT WRITING

Qualitative

  • Market drivers
  • Market challenges
  • Market trends
  • Five forces analysis

Quantitative

  • Market size and forecast
  • Market segmentation
  • Geographical insights
  • Competitive landscape

Interested in this report?

Get your sample now to see our research methodology and insights!

Download Now

Frequently Asked Questions

Antihypertensive Drugs market growth will increase by USD 6813.3 million during 2026-2030.

The Antihypertensive Drugs market is expected to grow at a CAGR of 3.4% during 2026-2030.

Antihypertensive Drugs market is segmented by Type (Systemic hypertension, Pulmonary hypertension) Route of administration (Oral, Injectables, Others) Distribution channel (Retail pharmacy, Hospital pharmacy, Online pharmacy)

A. Menarini Industrie Farma, Astellas Pharma Inc., AstraZeneca Plc, Aurobindo Pharma Ltd., Bayer AG, Boehringer Ingelheim GmbH, Cipla Inc., Daiichi Sankyo Co. Ltd., Dr. Reddys Laboratories Ltd., GlaxoSmithKline Plc, Glenmark Pharmaceuticals Ltd., Hikma Pharmaceuticals Plc, Les Laboratoires Servier, Lupin Ltd., Merck and Co. Inc., Novartis AG, Pfizer Inc., Sandoz Group AG, Sanofi SA, Sumitomo Pharma Co. Ltd., Sun Pharmaceutical Industries, Takeda Pharmaceutical Ltd., Teva Pharmaceutical Ltd., Torrent Pharmaceuticals Ltd., Viatris Inc. are a few of the key vendors in the Antihypertensive Drugs market.

North America will register the highest growth rate of 42.7% among the other regions. Therefore, the Antihypertensive Drugs market in North America is expected to garner significant business opportunities for the vendors during the forecast period.

US, Canada, Mexico, Germany, UK, France, Italy, Spain, The Netherlands, China, India, Japan, South Korea, Indonesia, Thailand, Brazil, Saudi Arabia, UAE, Turkey, Argentina, Colombia, South Africa, Israel

  • Rising global hypertension prevalence is the driving factor this market.

The Antihypertensive Drugs market vendors should focus on grabbing business opportunities from the Type segment as it accounted for the largest market share in the base year.
RIA - Research AI Assistant
Ask RIA
