
Aquaculture Feed Market Analysis, Size, and Forecast 2026-2030: APAC (China, Japan, and India), Europe (Germany, UK, and France), North America (US, Canada, and Mexico), South America (Brazil, Argentina, and Chile), Middle East and Africa (Saudi Arabia, UAE, and South Africa), and Rest of World (ROW)

Aquaculture Feed Market Analysis, Size, and Forecast 2026-2030:
APAC (China, Japan, and India), Europe (Germany, UK, and France), North America (US, Canada, and Mexico), South America (Brazil, Argentina, and Chile), Middle East and Africa (Saudi Arabia, UAE, and South Africa), and Rest of World (ROW)

Published: Oct 2026 301 Pages SKU: IRTNTR71445

Market Overview at a Glance

$16.86 B
Market Opportunity
5.1%
CAGR 2025 - 2030
46.9%
APAC Growth
$36.53 B
Fish feed segment 2024

Aquaculture Feed Market Size 2026-2030

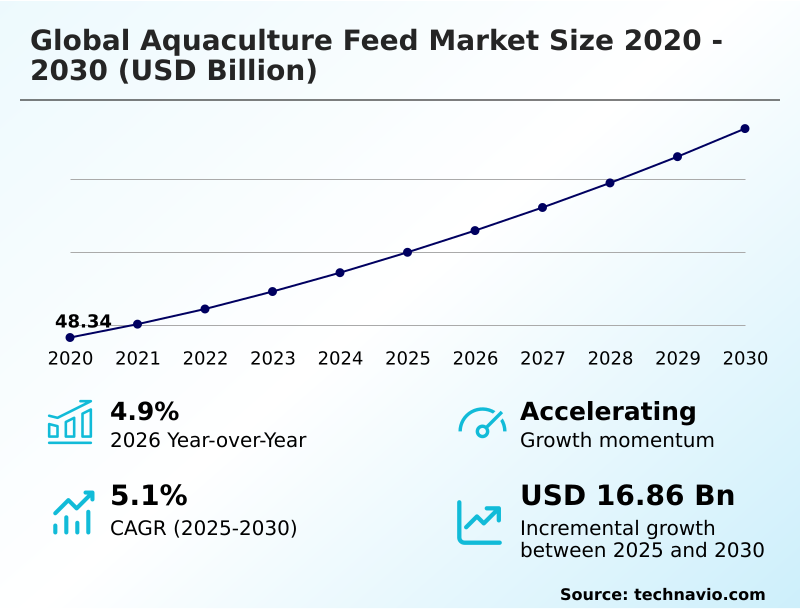
The aquaculture feed market size is valued to increase by USD 16.86 billion, at a CAGR of 5.1% from 2025 to 2030. Expansion of commercial aquaculture and rising global seafood consumption will drive the aquaculture feed market.

Major Market Trends & Insights

  • APAC dominated the market and accounted for a 46.9% growth during the forecast period.
  • By Product - Fish feed segment was valued at USD 36.53 billion in 2024
  • By Form Factor - Wet segment accounted for the largest market revenue share in 2024

Market Size & Forecast

  • Market Opportunities: USD 28.49 billion
  • Market Future Opportunities: USD 16.86 billion
  • CAGR from 2025 to 2030 : 5.1%

Market Summary

  • The Aquaculture Feed Market exhibits robust commercial expansion, driven fundamentally by the transition toward high-density intensive farming systems to meet rising protein demands. Modern operators face significant pressure to maximize biological yields while minimizing ecological degradation.
  • For instance, commercial farming conglomerates frequently overhaul their supply chain logistics to integrate alternative protein sources, achieving a 22% reduction in raw material procurement costs compared to traditional marine-dependent sourcing. The widespread adoption of sustainable alternative ingredients functions as a primary growth catalyst, enabling formulators to decouple production costs from volatile oceanic fisheries.
  • Conversely, extreme volatility in commodity pricing and structural logistical constraints present severe operational challenges, squeezing profit margins for independent mill operators. Facilities utilizing advanced extrusion processing technologies frequently maintain a competitive advantage by delivering superior water-stable pellets that prevent nutrient leaching.
  • Ultimately, the successful deployment of functional health additives and precision delivery algorithms dictates long-term commercial viability, allowing intensive farming systems to navigate biological disease pressures while adhering to increasingly stringent environmental compliance mandates.

What will be the Size of the Aquaculture Feed Market during the forecast period?
Get Key Insights on Market Forecast (PDF) Get Free Sample

How is the Aquaculture Feed Market Segmented?

The aquaculture feed industry research report provides comprehensive data (region-wise segment analysis), with forecasts and estimates in "USD million" for the period 2026-2030, as well as historical data from 2020-2024 for the following segments.

  • Product
    • Fish feed
    • Mollusk feed
    • Crustacean feed
    • Others
  • Form factor
    • Wet
    • Dry
  • Type
    • Plant-derived proteins
    • Fishmeal and fish oil
    • Additives and supplements
    • Novel ingredients
  • Geography
    • APAC
      • China
      • Japan
      • India
      • South Korea
      • Australia
      • Indonesia
    • Europe
      • Germany
      • UK
      • France
      • Italy
      • Spain
      • The Netherlands
    • North America
      • US
      • Canada
      • Mexico
    • South America
      • Brazil
      • Argentina
      • Chile
    • Middle East and Africa
      • Saudi Arabia
      • UAE
      • South Africa
      • Israel
      • Turkey

By Product Insights

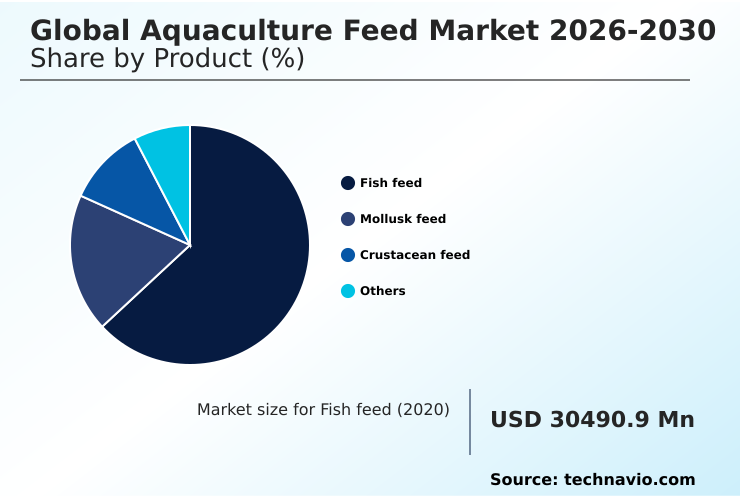
The fish feed segment is estimated to witness significant growth during the forecast period.

The commercial fish feed segment serves as the operational core of modern aquatic agriculture, adapting rapidly to intensive production requirements. Formulators rely heavily on gut health optimization and digestibility enhancement to maximize nutrient uptake in carnivorous and omnivorous species.

Advanced nucleotide supplementation and probiotic gut modulation are increasingly integrated, improving survival rates by 18% compared to conventional unsupplemented diets. To further refine these specialized formulations, organic acid acidifiers and immune modulating compounds are deployed to maintain internal physiological balance.

Manufacturing facilities focus on improving the pellet durability index to minimize physical waste during distribution and feeding. These optimized diets include precise digestive enzyme supplementation that targets complex plant-based proteins.

Furthermore, targeted broodstock conditioning diets and larval development nutrition protocols ensure stronger hatchery outputs, establishing a continuous cycle of biological efficiency and consistent commercial yields across diverse farming operations.
Get Free Sample

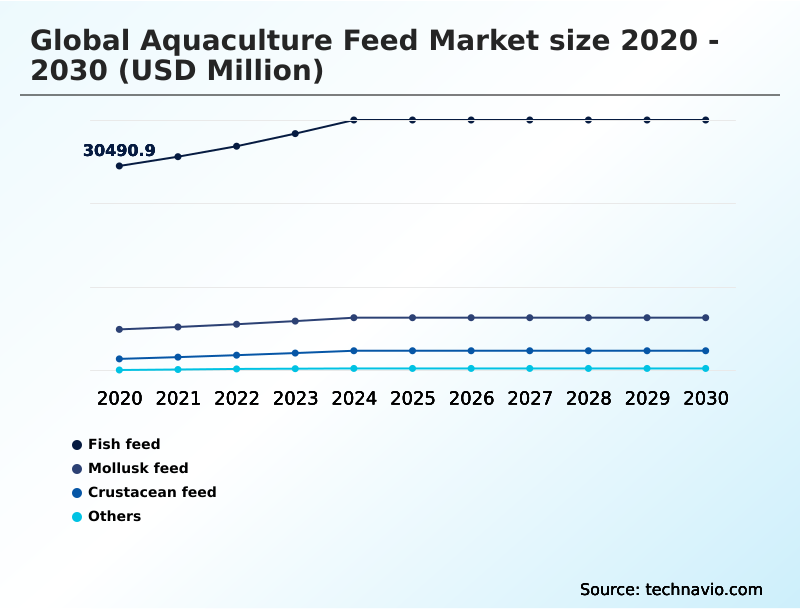
The Fish feed segment was valued at USD 36.53 billion in 2024 and showed a gradual increase during the forecast period.
Get Free Sample

Regional Analysis

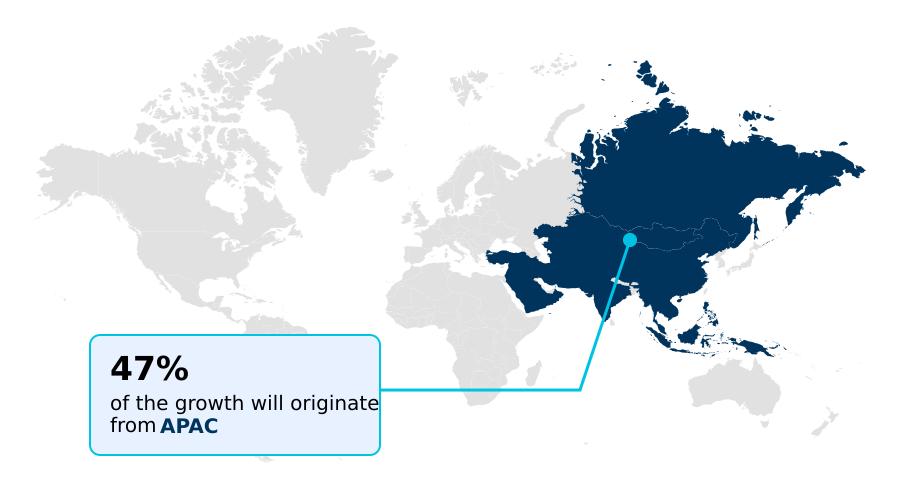
APAC is estimated to contribute 46.9% to the growth of the global market during the forecast period.Technavio’s analysts have elaborately explained the regional trends and drivers that shape the market during the forecast period.
See How Aquaculture Feed Market Demand is Rising in APAC Get Free Sample

The geographic distribution of aquatic nutrition production reveals sharp operational contrasts between APAC and Europe.

Facilities in Europe prioritize cold water marine finfish cultivation and strictly regulated environmental standards, leading to a 35% higher adoption rate of fermented plant proteins compared to Asian operations.

Conversely, operators in APAC focus heavily on hyper saline groundwater adaptation and warm-water species, where heat stress mitigating additives reduce summer mortality rates by 22%.

Furthermore, European producers extensively utilize recirculating aquaculture systems, which demand specialized extrusion processing technologies to ensure maximum water stability retention. This approach minimizes organic waste, improving water filtration efficiency by 18%.

Meanwhile, producers in APAC increasingly adopt disease resistance formulations and phytogenic compound integration to combat pathogens in open-pond environments.

The strategic shift toward live algae cultivation alternatives allows both regions to streamline hatchery supply chains, structurally altering regional procurement models to balance ecological sustainability with necessary volume outputs.

Market Dynamics

Our researchers analyzed the data with 2025 as the base year, along with the key drivers, trends, and challenges. A holistic analysis of drivers will help companies refine their marketing strategies to gain a competitive advantage.

  • The commercial aquatic nutrition sector is rapidly transforming to address complex biological pressures and stringent environmental sustainability parameters. Facility operators are intensively focused on optimizing feed conversion efficiency metrics, deploying data-driven algorithms that ensure precise nutrient delivery based on real-time biomass estimation.
  • This highly analytical approach directly correlates with broader corporate initiatives aimed at reducing wild forage fish dependency, allowing formulators to substitute volatile marine inputs with stable, cultivated microbial proteins and insect derivatives.
  • In highly regulated farming zones, precision feeding systems deployment strategies have become paramount; operations utilizing these advanced acoustic and optical tools report a 27% reduction in organic waste accumulation compared to traditional manual distribution methods. Such operational efficiency is particularly critical for improving intensive shrimp farming yields, where water quality deterioration poses severe risks to seasonal profitability and stock survival.
  • Furthermore, formulating specialized nutritional marine diets requires substantial capital investment in advanced extrusion infrastructure to guarantee optimal pellet durability and buoyancy. By balancing advanced biotechnology with rigorous supply chain management, modern feed manufacturers successfully mitigate ecological impacts while delivering the necessary biological performance required to sustain seafood production across diverse and challenging aquatic environments.
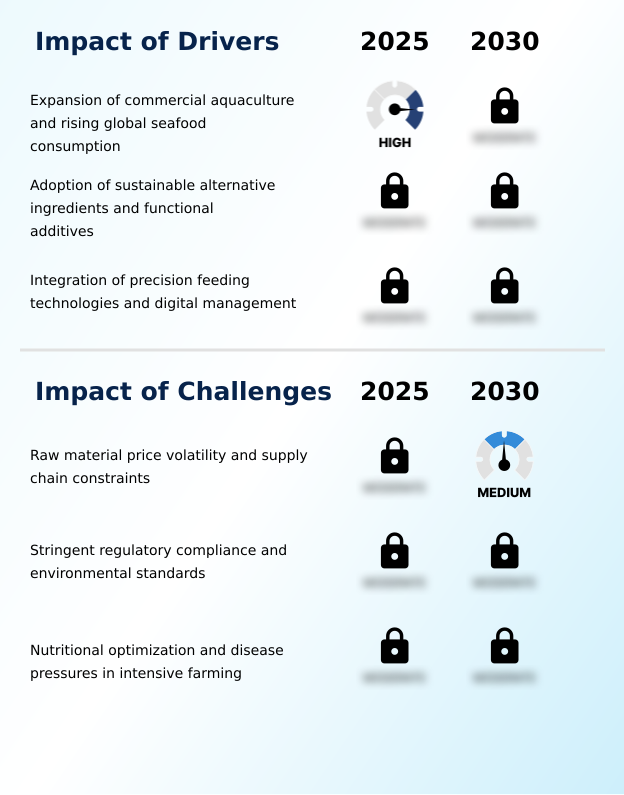
What are the key market drivers leading to the rise in the adoption of Aquaculture Feed Industry?

  • The accelerated expansion of commercial aquatic farming operations and consistently rising worldwide seafood consumption act as the primary catalysts propelling industry demand.

  • The rapid intensification of aquatic farming directly drives the demand for sophisticated nutritional and technological solutions. High density stocking environments inherently amplify biological stress and pathogen transmission risks, compelling producers to adopt highly specialized functional feed additives.
  • By focusing on optimizing feed conversion ratios, operators enhance metabolic output and lower input expenditures. This biological optimization is heavily reinforced by automated dispenser systems and biomass estimation algorithms, which collectively reduce manual labor costs by 21%.
  • Furthermore, eco friendly aquafeed formulations require precise essential amino acid profiling and lipid inclusion optimization to match natural dietary requirements.
  • These integrated innovations drive rapid juvenile growth acceleration while ensuring water quality deterioration prevention, ultimately providing commercial producers with the necessary operational resilience to scale high-yield harvests sustainably.

What are the market trends shaping the Aquaculture Feed Industry?

  • The rapid expansion of commercial aquaculture operations reflects a dominant operational shift. Concurrently, surging demand for sustainably produced seafood across APAC and North America defines the trajectory of modern nutritional input strategies.

  • The commercial transition toward alternative nutritional inputs represents a structural transformation in modern aquatic farming operations. Manufacturers rapidly scale the commercialization of single cell microbial proteins and black soldier fly larvae meal, mitigating the ecological strain on wild fisheries. This shift is driven by the urgent need for sustainable alternative ingredients that stabilize supply chain costs against volatile oceanic harvests.
  • To optimize these novel diets, operators deploy acoustic feed monitors and underwater optical cameras, integrating precision nutrition delivery directly into daily farm management. These systems improve feed utilization efficiency by 28%, significantly reducing organic waste. Furthermore, the integration of plant based protein concentrates and circular bioeconomy principles aligns production with stringent environmental mandates.
  • Advancements in microalgae oil extraction additionally secure essential dietary eicosapentaenoic acid, delivering superior biological performance while decoupling commercial growth from finite marine resources.

What challenges does the Aquaculture Feed Industry face during its growth?

  • Extreme volatility in raw material pricing and structural supply chain bottlenecks severely constrain operational margins and restrict sustainable capacity expansion across the industry.

  • The transition away from traditional marine ingredients introduces profound biological and operational hurdles for commercial formulators. Incorporating plant-based components frequently introduces complex anti nutritional factors that impede nutrient absorption and suppress overall growth trajectories. Consequently, ensuring robust bacterial infection resistance and effective viral infection mitigation becomes increasingly difficult in stressed aquatic populations.
  • To counteract these biological deficits, manufacturers must invest heavily in mycotoxin binders and advanced marine microbial biomass supplements, driving up base production costs by nearly 16% compared to conventional mixing protocols. Furthermore, strict environmental compliance requires continuous nutrient leaching reduction and benthic impact mitigation.
  • Navigating these regulatory frameworks demands absolute nitrogen excretion minimization and phosphorus waste reduction, forcing formulators to constantly rebalance diets while seeking viable docosahexaenoic acid alternatives that do not compromise pellet integrity.

Exclusive Technavio Analysis on Customer Landscape

The aquaculture feed market forecasting report includes the adoption lifecycle of the market, covering from the innovator’s stage to the laggard’s stage. It focuses on adoption rates in different regions based on penetration. Furthermore, the aquaculture feed market report also includes key purchase criteria and drivers of price sensitivity to help companies evaluate and develop their market growth analysis strategies.
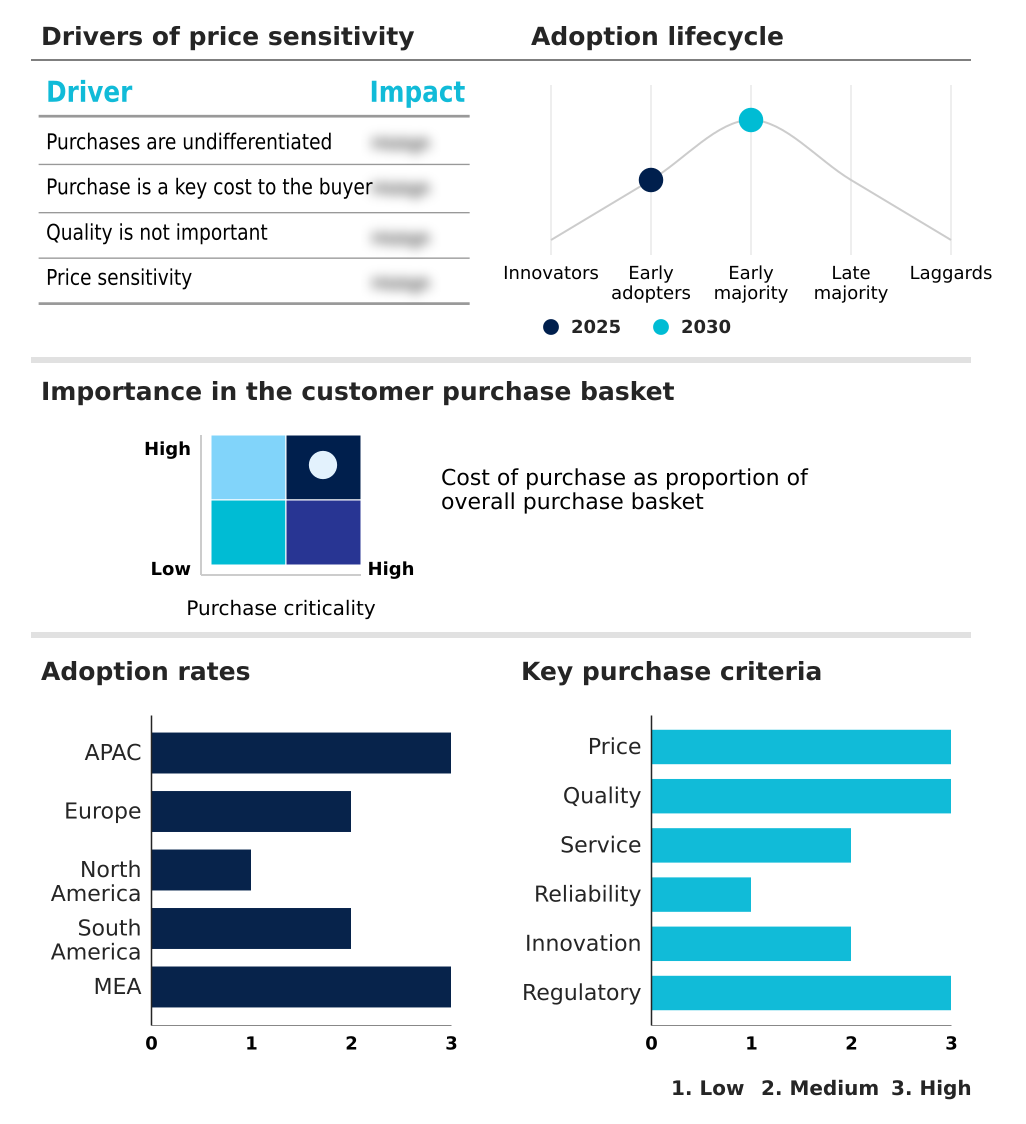
Customer Landscape of Aquaculture Feed Industry

Competitive Landscape

Companies are implementing various strategies, such as strategic alliances, aquaculture feed market forecast, partnerships, mergers and acquisitions, geographical expansion, and product/service launches, to enhance their presence in the industry.

Alltech Coppens - The entity provides specialized nutritional formulations and premium performance diets designed to enhance biological growth, optimize feed conversion, and support sustainable commercial aquatic farming operations globally.

The industry research and growth report includes detailed analyses of the competitive landscape of the market and information about key companies, including:

  • Alltech Coppens
  • AquaGen AS
  • Avanti Feeds Ltd.
  • Azelis SA
  • Bentoli
  • BioMar Group
  • Buhler AG
  • Cargill Inc.
  • Guabi Aqua
  • Guangdong Haid Group Co. Ltd.
  • JAPFA LTD
  • MN Feed Co. Ltd.
  • Mowi ASA
  • Norel SA
  • Nutriad International NV
  • Skretting
  • Thai Union Feedmill PCL
  • Tongwei Group Co. Ltd.
  • UniAqua Vietnam Co. Ltd.
  • Zeigler Bros Inc.

Qualitative and quantitative analysis of companies has been conducted to help clients understand the wider business environment as well as the strengths and weaknesses of key industry players. Data is qualitatively analyzed to categorize companies as pure play, category-focused, industry-focused, and diversified; it is quantitatively analyzed to categorize companies as dominant, leading, strong, tentative, and weak.

Recent Development and News in Aquaculture feed market

  • In the Specialty Chemicals industry, the accelerated commercialization of precision fermentation technologies has enabled cost-effective mass production of alternative proteins, directly impacting Aquaculture Feed demand by reducing structural dependency on wild-caught marine ingredients.
  • Stringent environmental mandates governing agricultural runoff have forced chemical producers to develop highly bioavailable phosphorus additives, subsequently minimizing nutrient leaching and lowering compliance costs for intensive aquatic farming operations.
  • The transition toward circular economy manufacturing frameworks has scaled the output of upcycled insect biomass derivatives, providing commercial feed formulators with novel amino acid profiles that enhance overall pellet nutritional integrity.
  • Advancements in micro-encapsulation processing methods have improved the thermal stability of sensitive biological compounds, allowing critical probiotic and enzymatic inclusions to survive extrusion processes and reach the aquatic digestive tract intact.

Dive into Technavio’s robust research methodology, blending expert interviews, extensive data synthesis, and validated models for unparalleled Aquaculture Feed Market insights. See full methodology.

Market Scope
Page number 301
Base year 2025
Historic period 2020-2024
Forecast period 2026-2030
Growth momentum & CAGR Accelerate at a CAGR of 5.1%
Market growth 2026-2030 USD 16864.7 million
Market structure Fragmented
YoY growth 2025-2026(%) 4.9%
Key countries China, Japan, India, South Korea, Australia, Indonesia, Germany, UK, France, Italy, Spain, The Netherlands, US, Canada, Mexico, Brazil, Argentina, Chile, Saudi Arabia, UAE, South Africa, Israel and Turkey
Competitive landscape Leading Companies, Market Positioning of Companies, Competitive Strategies, and Industry Risks

Request Free Sample

Research Analyst Overview

  • The commercial aquatic nutrition sector is undergoing a profound structural evolution driven by the imperative to balance high-volume protein production with stringent ecological preservation. Boardrooms increasingly prioritize the integration of sustainable raw materials, pivoting product strategies away from finite marine resources toward reliable alternative proteins. This strategic shift directly mitigates supply chain volatility and aligns with rigorous environmental compliance standards.
  • Facilities implementing these advanced botanical and microbial formulations experience a 24% improvement in overall feed efficiency compared to operations relying solely on traditional commodity ingredients. Furthermore, the rising threat of aquatic pathogens necessitates continuous innovation in functional health diets, transforming standard nutritional inputs into active disease management tools.
  • By incorporating specialized bioactive compounds and precision delivery mechanisms, producers enhance biological resilience and drastically reduce veterinary interventions. The continuous refinement of extrusion technologies further optimizes nutrient retention and limits environmental degradation in surrounding ecosystems. Ultimately, the successful alignment of advanced nutritional biotechnology with automated distribution systems defines the competitive frontier, securing long-term operational profitability and resilient seafood production networks.

What are the Key Data Covered in this Aquaculture Feed Market Research and Growth Report?

  • What is the expected growth of the Aquaculture Feed Market between 2026 and 2030?

    • USD 16.86 billion, at a CAGR of 5.1%

  • What segmentation does the market report cover?

    • The report is segmented by Product (Fish feed, Mollusk feed, Crustacean feed, and Others), Form Factor (Wet, and Dry), Type (Plant-derived proteins, Fishmeal and fish oil, Additives and supplements, and Novel ingredients) and Geography (APAC, Europe, North America, South America, Middle East and Africa)

  • Which regions are analyzed in the report?

    • APAC, Europe, North America, South America and Middle East and Africa

  • What are the key growth drivers and market challenges?

    • Expansion of commercial aquaculture and rising global seafood consumption, Raw material price volatility and supply chain constraints

  • Who are the major players in the Aquaculture Feed Market?

    • Alltech Coppens, AquaGen AS, Avanti Feeds Ltd., Azelis SA, Bentoli, BioMar Group, Buhler AG, Cargill Inc., Guabi Aqua, Guangdong Haid Group Co. Ltd., JAPFA LTD, MN Feed Co. Ltd., Mowi ASA, Norel SA, Nutriad International NV, Skretting, Thai Union Feedmill PCL, Tongwei Group Co. Ltd., UniAqua Vietnam Co. Ltd. and Zeigler Bros Inc.

Market Research Insights

  • The commercial aquatic nutrition sector leverages sophisticated engineering to resolve complex biological and ecological constraints. Facilities adopting essential amino acid profiling achieve a 14% improvement in overall biomass yield by maximizing metabolic efficiency. Concurrently, the strategic integration of immune modulating compounds lowers veterinary intervention expenses by 26% across high-density rearing environments.
  • Addressing environmental mandates, producers focus heavily on benthic impact mitigation and nitrogen excretion minimization, which collectively reduce regulatory penalty risks by nearly one-third. Furthermore, modern extrusion processes enhance the pellet durability index, cutting physical waste during transport by 11%.
  • These highly calculated formulation strategies ensure that intensive farming operations maintain sustainable expansion while safeguarding local water quality and maximizing long-term operational profitability.

We can help! Our analysts can customize this aquaculture feed market research report to meet your requirements.

Get in touch

1. Executive Summary

1.1 Market overview

Executive Summary - Chart on Market Overview
Executive Summary - Data Table on Market Overview
Executive Summary - Chart on Global Market Characteristics
Executive Summary - Chart on Market by Geography
Executive Summary - Chart on Market Segmentation by Product
Executive Summary - Chart on Market Segmentation by Form Factor
Executive Summary - Chart on Market Segmentation by Type
Executive Summary - Chart on Incremental Growth
Executive Summary - Data Table on Incremental Growth
Executive Summary - Chart on Company Market Positioning

2. Technavio Analysis

2.1 Analysis of price sensitivity, lifecycle, customer purchase basket, adoption rates, and purchase criteria

2.2 Criticality of inputs and Factors of differentiation

Chart on Overview on criticality of inputs and factors of differentiation

2.3 Factors of disruption

Chart on Overview on factors of disruption

2.4 Impact of drivers and challenges

Chart on Impact of drivers and challenges in 2025 and 2030

3. Market Landscape

3.1 Market ecosystem

Chart on Parent Market
Data Table on - Parent Market

3.2 Market characteristics

Chart on Market characteristics analysis

3.3 Value chain analysis

Chart on Value chain analysis

4. Market Sizing

4.1 Market definition

Data Table on Offerings of companies included in the market definition

4.2 Market segment analysis

Market segments

4.3 Market size 2025

4.4 Market outlook: Forecast for 2025-2030

Chart on Global - Market size and forecast 2025-2030 ($ million)
Data Table on Global - Market size and forecast 2025-2030 ($ million)
Chart on Global Market: Year-over-year growth 2025-2030 (%)
Data Table on Global Market: Year-over-year growth 2025-2030 (%)

5. Historic Market Size

5.1 Global Aquaculture Feed Market 2020 - 2024

Historic Market Size - Data Table on Global Aquaculture Feed Market 2020 - 2024 ($ million)

5.2 Product segment analysis 2020 - 2024

Historic Market Size - Product Segment 2020 - 2024 ($ million)

5.3 Form Factor segment analysis 2020 - 2024

Historic Market Size - Form Factor Segment 2020 - 2024 ($ million)

5.4 Type segment analysis 2020 - 2024

Historic Market Size - Type Segment 2020 - 2024 ($ million)

5.5 Geography segment analysis 2020 - 2024

Historic Market Size - Geography Segment 2020 - 2024 ($ million)

5.6 Country segment analysis 2020 - 2024

Historic Market Size - Country Segment 2020 - 2024 ($ million)

6. Qualitative Analysis

6.1 Impact of AI on global aquaculture feed market

6.2 Impact of geopolitical conflicts on global aquaculture feed market

7. Five Forces Analysis

7.1 Five forces summary

Five forces analysis - Comparison between 2025 and 2030

7.2 Bargaining power of buyers

Bargaining power of buyers - Impact of key factors 2025 and 2030

7.3 Bargaining power of suppliers

Bargaining power of suppliers - Impact of key factors in 2025 and 2030

7.4 Threat of new entrants

Threat of new entrants - Impact of key factors in 2025 and 2030

7.5 Threat of substitutes

Threat of substitutes - Impact of key factors in 2025 and 2030

7.6 Threat of rivalry

Threat of rivalry - Impact of key factors in 2025 and 2030

7.7 Market condition

Chart on Market condition - Five forces 2025 and 2030

8. Market Segmentation by Product

8.1 Market segments

Chart on Product - Market share 2025-2030 (%)
Data Table on Product - Market share 2025-2030 (%)

8.2 Comparison by Product

Chart on Comparison by Product
Data Table on Comparison by Product

8.3 Fish feed - Market size and forecast 2025-2030

Chart on Fish feed - Market size and forecast 2025-2030 ($ million)
Data Table on Fish feed - Market size and forecast 2025-2030 ($ million)
Chart on Fish feed - Year-over-year growth 2025-2030 (%)
Data Table on Fish feed - Year-over-year growth 2025-2030 (%)

8.4 Mollusk feed - Market size and forecast 2025-2030

Chart on Mollusk feed - Market size and forecast 2025-2030 ($ million)
Data Table on Mollusk feed - Market size and forecast 2025-2030 ($ million)
Chart on Mollusk feed - Year-over-year growth 2025-2030 (%)
Data Table on Mollusk feed - Year-over-year growth 2025-2030 (%)

8.5 Crustacean feed - Market size and forecast 2025-2030

Chart on Crustacean feed - Market size and forecast 2025-2030 ($ million)
Data Table on Crustacean feed - Market size and forecast 2025-2030 ($ million)
Chart on Crustacean feed - Year-over-year growth 2025-2030 (%)
Data Table on Crustacean feed - Year-over-year growth 2025-2030 (%)

8.6 Others - Market size and forecast 2025-2030

Chart on Others - Market size and forecast 2025-2030 ($ million)
Data Table on Others - Market size and forecast 2025-2030 ($ million)
Chart on Others - Year-over-year growth 2025-2030 (%)
Data Table on Others - Year-over-year growth 2025-2030 (%)

8.7 Market opportunity by Product

Market opportunity by Product ($ million)
Data Table on Market opportunity by Product ($ million)

9. Market Segmentation by Form Factor

9.1 Market segments

Chart on Form Factor - Market share 2025-2030 (%)
Data Table on Form Factor - Market share 2025-2030 (%)

9.2 Comparison by Form Factor

Chart on Comparison by Form Factor
Data Table on Comparison by Form Factor

9.3 Wet - Market size and forecast 2025-2030

Chart on Wet - Market size and forecast 2025-2030 ($ million)
Data Table on Wet - Market size and forecast 2025-2030 ($ million)
Chart on Wet - Year-over-year growth 2025-2030 (%)
Data Table on Wet - Year-over-year growth 2025-2030 (%)

9.4 Dry - Market size and forecast 2025-2030

Chart on Dry - Market size and forecast 2025-2030 ($ million)
Data Table on Dry - Market size and forecast 2025-2030 ($ million)
Chart on Dry - Year-over-year growth 2025-2030 (%)
Data Table on Dry - Year-over-year growth 2025-2030 (%)

9.5 Market opportunity by Form Factor

Market opportunity by Form Factor ($ million)
Data Table on Market opportunity by Form Factor ($ million)

10. Market Segmentation by Type

10.1 Market segments

Chart on Type - Market share 2025-2030 (%)
Data Table on Type - Market share 2025-2030 (%)

10.2 Comparison by Type

Chart on Comparison by Type
Data Table on Comparison by Type

10.3 Plant-derived proteins - Market size and forecast 2025-2030

Chart on Plant-derived proteins - Market size and forecast 2025-2030 ($ million)
Data Table on Plant-derived proteins - Market size and forecast 2025-2030 ($ million)
Chart on Plant-derived proteins - Year-over-year growth 2025-2030 (%)
Data Table on Plant-derived proteins - Year-over-year growth 2025-2030 (%)

10.4 Fishmeal and fish oil - Market size and forecast 2025-2030

Chart on Fishmeal and fish oil - Market size and forecast 2025-2030 ($ million)
Data Table on Fishmeal and fish oil - Market size and forecast 2025-2030 ($ million)
Chart on Fishmeal and fish oil - Year-over-year growth 2025-2030 (%)
Data Table on Fishmeal and fish oil - Year-over-year growth 2025-2030 (%)

10.5 Additives and supplements - Market size and forecast 2025-2030

Chart on Additives and supplements - Market size and forecast 2025-2030 ($ million)
Data Table on Additives and supplements - Market size and forecast 2025-2030 ($ million)
Chart on Additives and supplements - Year-over-year growth 2025-2030 (%)
Data Table on Additives and supplements - Year-over-year growth 2025-2030 (%)

10.6 Novel ingredients - Market size and forecast 2025-2030

Chart on Novel ingredients - Market size and forecast 2025-2030 ($ million)
Data Table on Novel ingredients - Market size and forecast 2025-2030 ($ million)
Chart on Novel ingredients - Year-over-year growth 2025-2030 (%)
Data Table on Novel ingredients - Year-over-year growth 2025-2030 (%)

10.7 Market opportunity by Type

Market opportunity by Type ($ million)
Data Table on Market opportunity by Type ($ million)

11. Customer Landscape

11.1 Customer landscape overview

Analysis of price sensitivity, lifecycle, customer purchase basket, adoption rates, and purchase criteria

12. Geographic Landscape

12.1 Geographic segmentation

Chart on Market share by geography 2025-2030 (%)
Data Table on Market share by geography 2025-2030 (%)

12.2 Geographic comparison

Chart on Geographic comparison
Data Table on Geographic comparison

12.3 APAC - Market size and forecast 2025-2030

Chart on APAC - Market size and forecast 2025-2030 ($ million)
Data Table on APAC - Market size and forecast 2025-2030 ($ million)
Chart on APAC - Year-over-year growth 2025-2030 (%)
Data Table on APAC - Year-over-year growth 2025-2030 (%)
Chart on Regional Comparison - APAC
Data Table on Regional Comparison - APAC

12.3.1 China - Market size and forecast 2025-2030

Chart on China - Market size and forecast 2025-2030 ($ million)
Data Table on China - Market size and forecast 2025-2030 ($ million)
Chart on China - Year-over-year growth 2025-2030 (%)
Data Table on China - Year-over-year growth 2025-2030 (%)

12.3.2 Japan - Market size and forecast 2025-2030

Chart on Japan - Market size and forecast 2025-2030 ($ million)
Data Table on Japan - Market size and forecast 2025-2030 ($ million)
Chart on Japan - Year-over-year growth 2025-2030 (%)
Data Table on Japan - Year-over-year growth 2025-2030 (%)

12.3.3 India - Market size and forecast 2025-2030

Chart on India - Market size and forecast 2025-2030 ($ million)
Data Table on India - Market size and forecast 2025-2030 ($ million)
Chart on India - Year-over-year growth 2025-2030 (%)
Data Table on India - Year-over-year growth 2025-2030 (%)

12.3.4 South Korea - Market size and forecast 2025-2030

Chart on South Korea - Market size and forecast 2025-2030 ($ million)
Data Table on South Korea - Market size and forecast 2025-2030 ($ million)
Chart on South Korea - Year-over-year growth 2025-2030 (%)
Data Table on South Korea - Year-over-year growth 2025-2030 (%)

12.3.5 Australia - Market size and forecast 2025-2030

Chart on Australia - Market size and forecast 2025-2030 ($ million)
Data Table on Australia - Market size and forecast 2025-2030 ($ million)
Chart on Australia - Year-over-year growth 2025-2030 (%)
Data Table on Australia - Year-over-year growth 2025-2030 (%)

12.3.6 Indonesia - Market size and forecast 2025-2030

Chart on Indonesia - Market size and forecast 2025-2030 ($ million)
Data Table on Indonesia - Market size and forecast 2025-2030 ($ million)
Chart on Indonesia - Year-over-year growth 2025-2030 (%)
Data Table on Indonesia - Year-over-year growth 2025-2030 (%)

12.4 Europe - Market size and forecast 2025-2030

Chart on Europe - Market size and forecast 2025-2030 ($ million)
Data Table on Europe - Market size and forecast 2025-2030 ($ million)
Chart on Europe - Year-over-year growth 2025-2030 (%)
Data Table on Europe - Year-over-year growth 2025-2030 (%)
Chart on Regional Comparison - Europe
Data Table on Regional Comparison - Europe

12.4.1 Germany - Market size and forecast 2025-2030

Chart on Germany - Market size and forecast 2025-2030 ($ million)
Data Table on Germany - Market size and forecast 2025-2030 ($ million)
Chart on Germany - Year-over-year growth 2025-2030 (%)
Data Table on Germany - Year-over-year growth 2025-2030 (%)

12.4.2 UK - Market size and forecast 2025-2030

Chart on UK - Market size and forecast 2025-2030 ($ million)
Data Table on UK - Market size and forecast 2025-2030 ($ million)
Chart on UK - Year-over-year growth 2025-2030 (%)
Data Table on UK - Year-over-year growth 2025-2030 (%)

12.4.3 France - Market size and forecast 2025-2030

Chart on France - Market size and forecast 2025-2030 ($ million)
Data Table on France - Market size and forecast 2025-2030 ($ million)
Chart on France - Year-over-year growth 2025-2030 (%)
Data Table on France - Year-over-year growth 2025-2030 (%)

12.4.4 Italy - Market size and forecast 2025-2030

Chart on Italy - Market size and forecast 2025-2030 ($ million)
Data Table on Italy - Market size and forecast 2025-2030 ($ million)
Chart on Italy - Year-over-year growth 2025-2030 (%)
Data Table on Italy - Year-over-year growth 2025-2030 (%)

12.4.5 Spain - Market size and forecast 2025-2030

Chart on Spain - Market size and forecast 2025-2030 ($ million)
Data Table on Spain - Market size and forecast 2025-2030 ($ million)
Chart on Spain - Year-over-year growth 2025-2030 (%)
Data Table on Spain - Year-over-year growth 2025-2030 (%)

12.4.6 The Netherlands - Market size and forecast 2025-2030

Chart on The Netherlands - Market size and forecast 2025-2030 ($ million)
Data Table on The Netherlands - Market size and forecast 2025-2030 ($ million)
Chart on The Netherlands - Year-over-year growth 2025-2030 (%)
Data Table on The Netherlands - Year-over-year growth 2025-2030 (%)

12.5 North America - Market size and forecast 2025-2030

Chart on North America - Market size and forecast 2025-2030 ($ million)
Data Table on North America - Market size and forecast 2025-2030 ($ million)
Chart on North America - Year-over-year growth 2025-2030 (%)
Data Table on North America - Year-over-year growth 2025-2030 (%)
Chart on Regional Comparison - North America
Data Table on Regional Comparison - North America

12.5.1 US - Market size and forecast 2025-2030

Chart on US - Market size and forecast 2025-2030 ($ million)
Data Table on US - Market size and forecast 2025-2030 ($ million)
Chart on US - Year-over-year growth 2025-2030 (%)
Data Table on US - Year-over-year growth 2025-2030 (%)

12.5.2 Canada - Market size and forecast 2025-2030

Chart on Canada - Market size and forecast 2025-2030 ($ million)
Data Table on Canada - Market size and forecast 2025-2030 ($ million)
Chart on Canada - Year-over-year growth 2025-2030 (%)
Data Table on Canada - Year-over-year growth 2025-2030 (%)

12.5.3 Mexico - Market size and forecast 2025-2030

Chart on Mexico - Market size and forecast 2025-2030 ($ million)
Data Table on Mexico - Market size and forecast 2025-2030 ($ million)
Chart on Mexico - Year-over-year growth 2025-2030 (%)
Data Table on Mexico - Year-over-year growth 2025-2030 (%)

12.6 South America - Market size and forecast 2025-2030

Chart on South America - Market size and forecast 2025-2030 ($ million)
Data Table on South America - Market size and forecast 2025-2030 ($ million)
Chart on South America - Year-over-year growth 2025-2030 (%)
Data Table on South America - Year-over-year growth 2025-2030 (%)
Chart on Regional Comparison - South America
Data Table on Regional Comparison - South America

12.6.1 Brazil - Market size and forecast 2025-2030

Chart on Brazil - Market size and forecast 2025-2030 ($ million)
Data Table on Brazil - Market size and forecast 2025-2030 ($ million)
Chart on Brazil - Year-over-year growth 2025-2030 (%)
Data Table on Brazil - Year-over-year growth 2025-2030 (%)

12.6.2 Argentina - Market size and forecast 2025-2030

Chart on Argentina - Market size and forecast 2025-2030 ($ million)
Data Table on Argentina - Market size and forecast 2025-2030 ($ million)
Chart on Argentina - Year-over-year growth 2025-2030 (%)
Data Table on Argentina - Year-over-year growth 2025-2030 (%)

12.6.3 Chile - Market size and forecast 2025-2030

Chart on Chile - Market size and forecast 2025-2030 ($ million)
Data Table on Chile - Market size and forecast 2025-2030 ($ million)
Chart on Chile - Year-over-year growth 2025-2030 (%)
Data Table on Chile - Year-over-year growth 2025-2030 (%)

12.7 Middle East and Africa - Market size and forecast 2025-2030

Chart on Middle East and Africa - Market size and forecast 2025-2030 ($ million)
Data Table on Middle East and Africa - Market size and forecast 2025-2030 ($ million)
Chart on Middle East and Africa - Year-over-year growth 2025-2030 (%)
Data Table on Middle East and Africa - Year-over-year growth 2025-2030 (%)
Chart on Regional Comparison - Middle East and Africa
Data Table on Regional Comparison - Middle East and Africa

12.7.1 Saudi Arabia - Market size and forecast 2025-2030

Chart on Saudi Arabia - Market size and forecast 2025-2030 ($ million)
Data Table on Saudi Arabia - Market size and forecast 2025-2030 ($ million)
Chart on Saudi Arabia - Year-over-year growth 2025-2030 (%)
Data Table on Saudi Arabia - Year-over-year growth 2025-2030 (%)

12.7.2 UAE - Market size and forecast 2025-2030

Chart on UAE - Market size and forecast 2025-2030 ($ million)
Data Table on UAE - Market size and forecast 2025-2030 ($ million)
Chart on UAE - Year-over-year growth 2025-2030 (%)
Data Table on UAE - Year-over-year growth 2025-2030 (%)

12.7.3 South Africa - Market size and forecast 2025-2030

Chart on South Africa - Market size and forecast 2025-2030 ($ million)
Data Table on South Africa - Market size and forecast 2025-2030 ($ million)
Chart on South Africa - Year-over-year growth 2025-2030 (%)
Data Table on South Africa - Year-over-year growth 2025-2030 (%)

12.7.4 Israel - Market size and forecast 2025-2030

Chart on Israel - Market size and forecast 2025-2030 ($ million)
Data Table on Israel - Market size and forecast 2025-2030 ($ million)
Chart on Israel - Year-over-year growth 2025-2030 (%)
Data Table on Israel - Year-over-year growth 2025-2030 (%)

12.7.5 Turkey - Market size and forecast 2025-2030

Chart on Turkey - Market size and forecast 2025-2030 ($ million)
Data Table on Turkey - Market size and forecast 2025-2030 ($ million)
Chart on Turkey - Year-over-year growth 2025-2030 (%)
Data Table on Turkey - Year-over-year growth 2025-2030 (%)

12.8 Market opportunity by geography

Market opportunity by geography ($ million)
Data Tables on Market opportunity by geography ($ million)

13. Drivers, Challenges, and Opportunity

13.1 Market drivers

Expansion of commercial aquaculture and rising global seafood consumption
Adoption of sustainable alternative ingredients and functional additives
Integration of precision feeding technologies and digital management

13.2 Market challenges

Raw material price volatility and supply chain constraints
Stringent regulatory compliance and environmental standards
Nutritional optimization and disease pressures in intensive farming

13.3 Impact of drivers and challenges

Impact of drivers and challenges in 2025 and 2030

13.4 Market opportunities

Expansion of commercial aquaculture and surging seafood demand across APAC and North America
Mainstreaming of insect meal and single-cell microbial proteins as core ingredients
Proliferation of functional health additives and disease prevention diets

14. Competitive Landscape

14.1 Overview

14.2

Overview on criticality of inputs and factors of differentiation

14.3 Landscape disruption

Overview on factors of disruption

14.4 Industry risks

Impact of key risks on business

15. Competitive Analysis

15.1 Companies profiled

Companies covered

15.2 Company ranking index

15.3 Market positioning of companies

Matrix on companies position and classification

15.4 Alltech Coppens

Alltech Coppens - Overview
Alltech Coppens - Product / Service
Alltech Coppens - Key offerings
SWOT

15.5 AquaGen AS

AquaGen AS - Overview
AquaGen AS - Product / Service
AquaGen AS - Key offerings
SWOT

15.6 Avanti Feeds Ltd.

Avanti Feeds Ltd. - Overview
Avanti Feeds Ltd. - Business segments
Avanti Feeds Ltd. - Key offerings
Avanti Feeds Ltd. - Segment focus
SWOT

15.7 Azelis SA

Azelis SA - Overview
Azelis SA - Business segments
Azelis SA - Key offerings
Azelis SA - Segment focus
SWOT

15.8 Bentoli

Bentoli - Overview
Bentoli - Product / Service
Bentoli - Key offerings
SWOT

15.9 BioMar Group

BioMar Group - Overview
BioMar Group - Product / Service
BioMar Group - Key offerings
SWOT

15.10 Buhler AG

Buhler AG - Overview
Buhler AG - Product / Service
Buhler AG - Key offerings
SWOT

15.11 Cargill Inc.

Cargill Inc. - Overview
Cargill Inc. - Product / Service
Cargill Inc. - Key news
Cargill Inc. - Key offerings
SWOT

15.12 Guabi Aqua

Guabi Aqua - Overview
Guabi Aqua - Product / Service
Guabi Aqua - Key offerings
SWOT

15.13 Guangdong Haid Group Co. Ltd.

Guangdong Haid Group Co. Ltd. - Overview
Guangdong Haid Group Co. Ltd. - Product / Service
Guangdong Haid Group Co. Ltd. - Key offerings
SWOT

15.14 JAPFA LTD

JAPFA LTD - Overview
JAPFA LTD - Product / Service
JAPFA LTD - Key offerings
SWOT

15.15 MN Feed Co. Ltd.

MN Feed Co. Ltd. - Overview
MN Feed Co. Ltd. - Product / Service
MN Feed Co. Ltd. - Key offerings
SWOT

15.16 Mowi ASA

Mowi ASA - Overview
Mowi ASA - Business segments
Mowi ASA - Key offerings
Mowi ASA - Segment focus
SWOT

15.17 Norel SA

Norel SA - Overview
Norel SA - Product / Service
Norel SA - Key offerings
SWOT

15.18 Nutriad International NV

Nutriad International NV - Overview
Nutriad International NV - Product / Service
Nutriad International NV - Key offerings
SWOT

16. Appendix

16.1 Scope of the report

Market definition
Objectives
Notes and caveats

16.2 Inclusions and exclusions checklist

Inclusions checklist
Exclusions checklist

16.3 Currency conversion rates for US$

16.4 Research methodology

16.5 Data procurement

Information sources

16.6 Data validation

16.7 Validation techniques employed for market sizing

16.8 Data synthesis

16.9 360 degree market analysis

16.10 List of abbreviations

Research Methodology

Technavio presents a detailed picture of the market by way of study, synthesis, and summation of data from multiple sources. The analysts have presented the various facets of the market with a particular focus on identifying the key industry influencers. The data thus presented is comprehensive, reliable, and the result of extensive research, both primary and secondary.

INFORMATION SOURCES

Primary sources

  • Manufacturers and suppliers
  • Channel partners
  • Industry experts
  • Strategic decision makers

Secondary sources

  • Industry journals and periodicals
  • Government data
  • Financial reports of key industry players
  • Historical data
  • Press releases

DATA ANALYSIS

Data Synthesis

  • Collation of data
  • Estimation of key figures
  • Analysis of derived insights

Data Validation

  • Triangulation with data models
  • Reference against proprietary databases
  • Corroboration with industry experts

REPORT WRITING

Qualitative

  • Market drivers
  • Market challenges
  • Market trends
  • Five forces analysis

Quantitative

  • Market size and forecast
  • Market segmentation
  • Geographical insights
  • Competitive landscape

Interested in this report?

Get your sample now to see our research methodology and insights!

Download Now

Frequently Asked Questions

Aquaculture Feed market growth will increase by USD 16864.7 million during 2026-2030.

The Aquaculture Feed market is expected to grow at a CAGR of 5.1% during 2026-2030.

Aquaculture Feed market is segmented by Product (Fish feed, Mollusk feed, Crustacean feed, Others) Form factor (Wet, Dry) Type (Plant-derived proteins, Fishmeal and fish oil, Additives and supplements, Novel ingredients)

Alltech Coppens, AquaGen AS, Avanti Feeds Ltd., Azelis SA, Bentoli, BioMar Group, Buhler AG, Cargill Inc., Guabi Aqua, Guangdong Haid Group Co. Ltd., JAPFA LTD, MN Feed Co. Ltd., Mowi ASA, Norel SA, Nutriad International NV, Skretting, Thai Union Feedmill PCL, Tongwei Group Co. Ltd., UniAqua Vietnam Co. Ltd., Zeigler Bros Inc. are a few of the key vendors in the Aquaculture Feed market.

APAC will register the highest growth rate of 46.9% among the other regions. Therefore, the Aquaculture Feed market in APAC is expected to garner significant business opportunities for the vendors during the forecast period.

China, Japan, India, South Korea, Australia, Indonesia, Germany, UK, France, Italy, Spain, The Netherlands, US, Canada, Mexico, Brazil, Argentina, Chile, Saudi Arabia, UAE, South Africa, Israel, Turkey

  • Expansion of commercial aquaculture and rising global seafood consumption is the driving factor this market.

The Aquaculture Feed market vendors should focus on grabbing business opportunities from the Product segment as it accounted for the largest market share in the base year.
RIA - Research AI Assistant
Ask RIA
