Arcade Gaming Market Analysis, Size, and Forecast 2026-2030: APAC (Japan, China, and South Korea), North America (US, Canada, and Mexico), Europe (UK, Germany, and France), Middle East and Africa (UAE, South Africa, and Saudi Arabia), South America (Brazil, Argentina, and Colombia), and Rest of World (ROW)

Arcade Gaming Market Analysis, Size, and Forecast 2026-2030:
APAC (Japan, China, and South Korea), North America (US, Canada, and Mexico), Europe (UK, Germany, and France), Middle East and Africa (UAE, South Africa, and Saudi Arabia), South America (Brazil, Argentina, and Colombia), and Rest of World (ROW)

Published: May 2026 292 Pages SKU: IRTNTR43930

Market Overview at a Glance

$2.07 B
Market Opportunity
2%
CAGR 2025 - 2030
60.4%
APAC Growth
$15.95 B
Gaming hubs segment 2024

Arcade Gaming Market Size 2026-2030

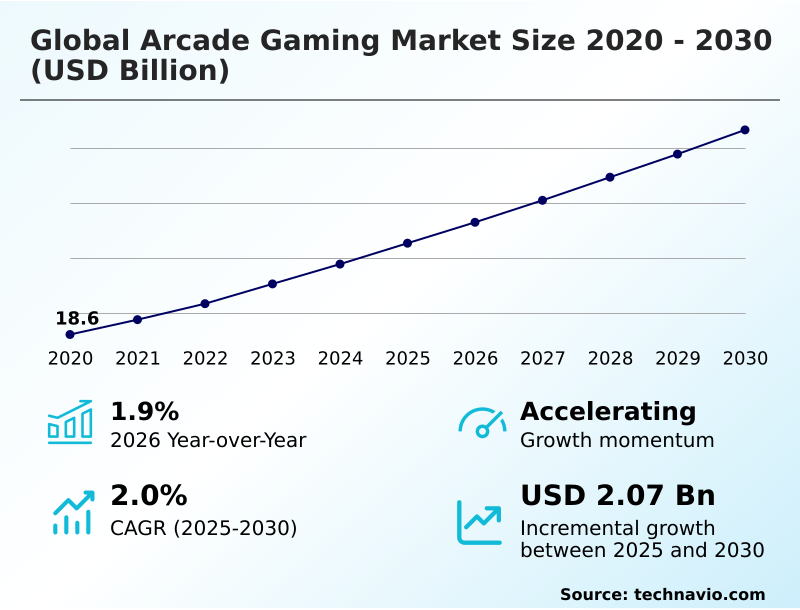
The arcade gaming market size is valued to increase by USD 2.07 billion, at a CAGR of 2% from 2025 to 2030. Rise of immersive and competitive socializing hubs will drive the arcade gaming market.

Major Market Trends & Insights

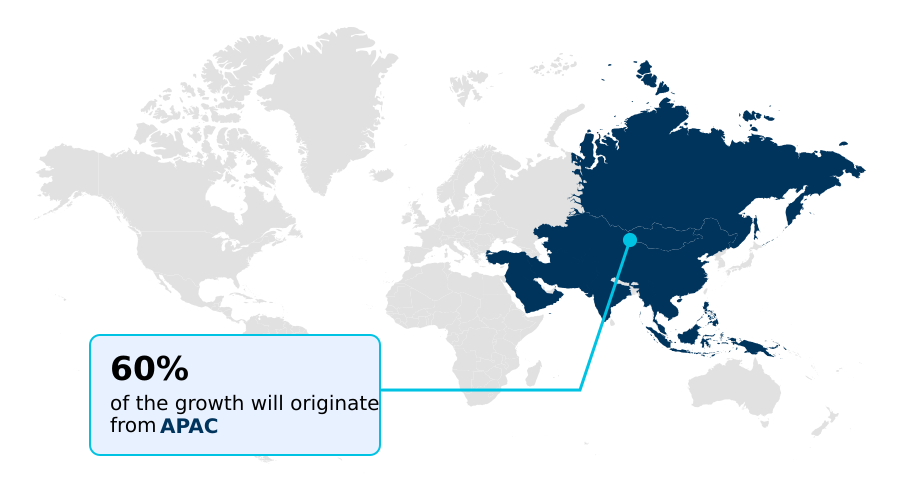
  • APAC dominated the market and accounted for a 60.4% growth during the forecast period.
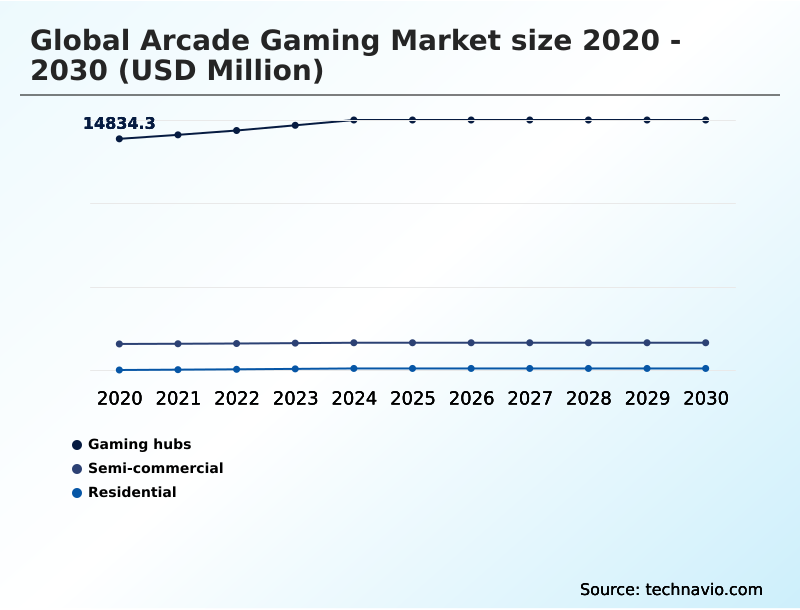
  • By End-user - Gaming hubs segment was valued at USD 15.95 billion in 2024
  • By Genre - Racing segment accounted for the largest market revenue share in 2024

Market Size & Forecast

  • Market Opportunities: USD 3.72 billion
  • Market Future Opportunities: USD 2.07 billion
  • CAGR from 2025 to 2030 : 2%

Market Summary

  • The arcade gaming market is defined by the ecosystem of pay-per-play entertainment hardware and software designed for out-of-home public venues. This industry encompasses traditional video cabinets, electromechanical games, and high-fidelity attractions like virtual reality platforms and motion simulators. These systems are engineered for durability in high-traffic environments, utilizing specialized hardware and cashless payment systems.
  • The sector's relevance is maintained by offering unique physical interactions and high-end technological experiences that are difficult to replicate in a domestic setting, making it a vital component of the broader location-based entertainment industry. A key business scenario involves operators leveraging player behavior analytics from these connected machines to optimize game floor layouts and maintenance schedules, directly impacting profitability.
  • However, the industry grapples with intense competition from home and mobile gaming, requiring continuous innovation in high-throughput attractions and social gameplay to retain a diverse demographic.

What will be the Size of the Arcade Gaming Market during the forecast period?

Get Key Insights on Market Forecast (PDF) Request Free Sample

How is the Arcade Gaming Market Segmented?

The arcade gaming industry research report provides comprehensive data (region-wise segment analysis), with forecasts and estimates in "USD million" for the period 2026-2030, as well as historical data from 2020-2024 for the following segments.

  • End-user
    • Gaming hubs
    • Semi-commercial
    • Residential
  • Genre
    • Racing
    • Shooting
    • Sports
    • Action
  • Type
    • Video games
    • Simulation games
    • Mechanical games
  • Geography
    • APAC
      • Japan
      • China
      • South Korea
    • North America
      • US
      • Canada
      • Mexico
    • Europe
      • UK
      • Germany
      • France
    • Middle East and Africa
      • UAE
      • South Africa
      • Saudi Arabia
    • South America
      • Brazil
      • Argentina
      • Colombia
    • Rest of World (ROW)

By End-user Insights

The gaming hubs segment is estimated to witness significant growth during the forecast period.

Gaming hubs, including family entertainment centers and dedicated amusement arcades, are the primary end-user segment.

These high-traffic destinations for shared social experiences are shifting toward competitive socializing, integrating coin-operated entertainment with boutique bowling and upscale dining to attract a broader demographic. This pivot requires sophisticated redemption arcade games and immersive virtual reality platforms.

Venues are leveraging digital card readers and cashless systems for frictionless transactions, enhancing operational efficiency and guest retention.

The focus is on offering high-performance hardware and large-scale motion-based racing simulators that are not replicable at home, maintaining their role as the location-based entertainment industry.

While this model drives engagement, some large-scale operators have reported a 5.0% decline in comparable store sales amid rising operational costs.

Request Free Sample

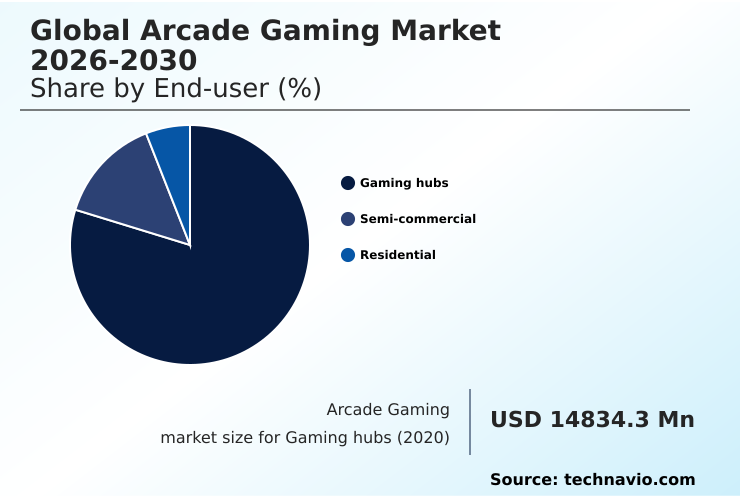
The Gaming hubs segment was valued at USD 15.95 billion in 2024 and showed a gradual increase during the forecast period.

Request Free Sample

Regional Analysis

APAC is estimated to contribute 60.4% to the growth of the global market during the forecast period.Technavio’s analysts have elaborately explained the regional trends and drivers that shape the market during the forecast period.

See How Arcade Gaming Market Demand is Rising in APAC Request Free Sample

The geographic landscape is dominated by the APAC region, which serves as a primary engine for both hardware production and software innovation, driven by a deep-rooted amusement culture.

Japan continues to lead in technological advancement with gesture-based arcade games and AI town systems, while China's massive manufacturing base supports the development of high-fidelity simulation hardware and interactive therapy gaming.

North America is characterized by a transition to large-scale entertainment models, although operators face significant overheads; in certain US urban hubs, data center expansion has pushed local power prices up by as much as 267%.

Europe is seeing a renaissance in competitive socializing venues, integrating augmented reality overlays and eco-friendly modular hardware design to meet regional standards.

Market Dynamics

Our researchers analyzed the data with 2025 as the base year, along with the key drivers, trends, and challenges. A holistic analysis of drivers will help companies refine their marketing strategies to gain a competitive advantage.

  • Strategic planning in the arcade gaming market necessitates a deep understanding of evolving technologies and operational efficiencies. The impact of AI on arcade cabinet design is profound, enabling dynamic difficulty and personalized experiences. Concurrently, VR motion simulator latency reduction techniques are critical for creating immersive, comfortable attractions that justify premium pricing.
  • The shift to cashless payment system integration for arcades is no longer optional, with security measures for unattended payment kiosks becoming a key investment area. Operationally, predictive maintenance for amusement machines is essential for maximizing uptime, directly influencing the ROI of high-fidelity arcade attractions.
  • Operators use data analytics for player engagement optimization and develop player retention strategies in arcade gaming to build a loyal customer base. The future of electromechanical games in arcades depends on successful retro arcade cabinet restoration and modernization, often blending classic mechanics with digital enhancements. This is part of a broader digital ecosystem strategy for entertainment centers.
  • On the hardware side, firms are constantly comparing haptic feedback in arcade games and refining designs for high-throughput redemption games. The competitive analysis of arcade racing simulators informs R&D, while the industry also explores integrating AR into traditional arcade games.
  • The entire value chain is affected by supply chain risks for electronic amusement equipment, which have increased operational costs by over 10% in some cases, and the need for regulatory compliance for arcade gaming hardware. Developing successful social immersive entertainment business models and adapting console IPs for arcade cabinets are key growth strategies, ensuring both innovation and market relevance.
  • Finally, a focus on energy efficiency in family entertainment centers is becoming a crucial factor for long-term sustainability.

What are the key market drivers leading to the rise in the adoption of Arcade Gaming Industry?

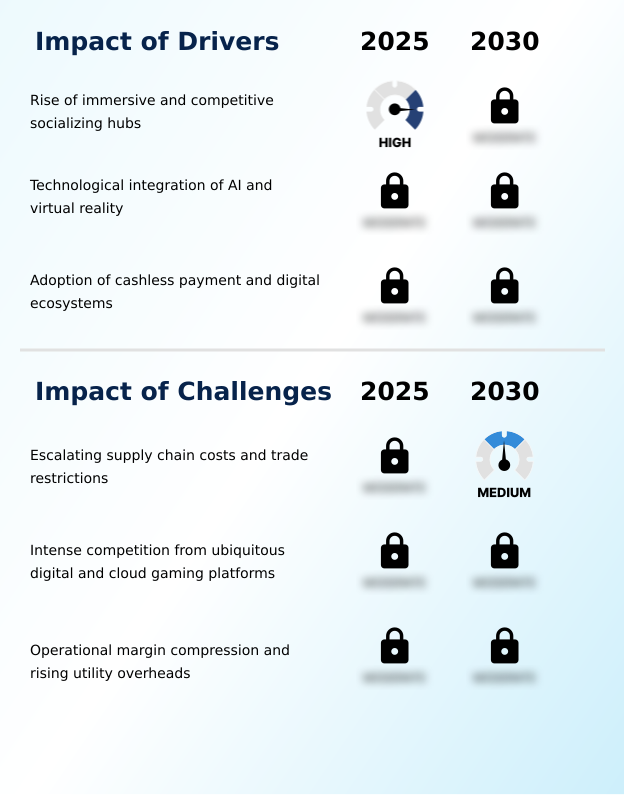
  • The rise of immersive and competitive socializing hubs serves as a key driver for market growth by creating destination venues.

  • Technological innovation, particularly the convergence of AI with high-fidelity motion simulation, serves as a significant driver, enhancing the value of modern arcade cabinets.
  • Manufacturers are focused on creating superior sensory experiences, exemplified by the debut of VR platforms with advanced haptic feedback technology.
  • The widespread adoption of cashless payment systems and unified digital ecosystems is another critical driver, streamlining operations and improving the user experience.
  • These systems facilitate frictionless transactions and loyalty rewards, with implementations showing a potential to boost repeat visits by up to 25%.
  • Furthermore, the use of predictive maintenance and real-time performance analytics helps operators reduce machine downtime, which can improve overall revenue capture by 5% in high-traffic venues.

What are the market trends shaping the Arcade Gaming Industry?

  • The expansion of hybrid family entertainment centers and integrated social amusement hubs represents a primary upcoming market trend. This shift caters to a growing consumer demand for comprehensive and varied leisure experiences.

  • A dominant trend is the integration of traditional amusement machines into multifaceted social amusement hubs and hybrid family entertainment centers, extending guest dwell time. This model prioritizes high-throughput attractions and unattended systems to maximize peak-period efficiency.
  • The focus on premium interactive experiences is evident in the adoption of high-fidelity virtual reality platforms and sophisticated motion simulation, which deliver sensory interactions impossible to replicate at home. In some venues, this has led to a 15% increase in average spend per visit.
  • The adoption of digital wallet integration and other unattended payment solutions is also reshaping backend efficiency, with cloud-based operations providing real-time visibility into machine use, which has been shown to reduce hardware downtime by over 20%.

What challenges does the Arcade Gaming Industry face during its growth?

  • Escalating supply chain costs and international trade restrictions represent a key challenge affecting the industry's growth and hardware procurement.

  • A primary challenge is the intense competition from ubiquitous home console and cloud gaming platforms, which have narrowed the technical advantage of arcade cabinets. The convenience of subscription services also presents a difficult value proposition for location-based entertainment centers to match. Furthermore, operators face severe margin compression from rising operational costs.
  • Electricity prices in some markets have surged by more than 12%, while tariffs on imported electronic components, such as those used in force feedback systems and prize redemption games, add significant financial pressure.
  • These trade restrictions on amusement equipment have forced companies to seek more expensive alternative suppliers, increasing capital expenditure for new installations and limiting the ability of operators to refresh their coin pusher machines and other hardware.

Exclusive Technavio Analysis on Customer Landscape

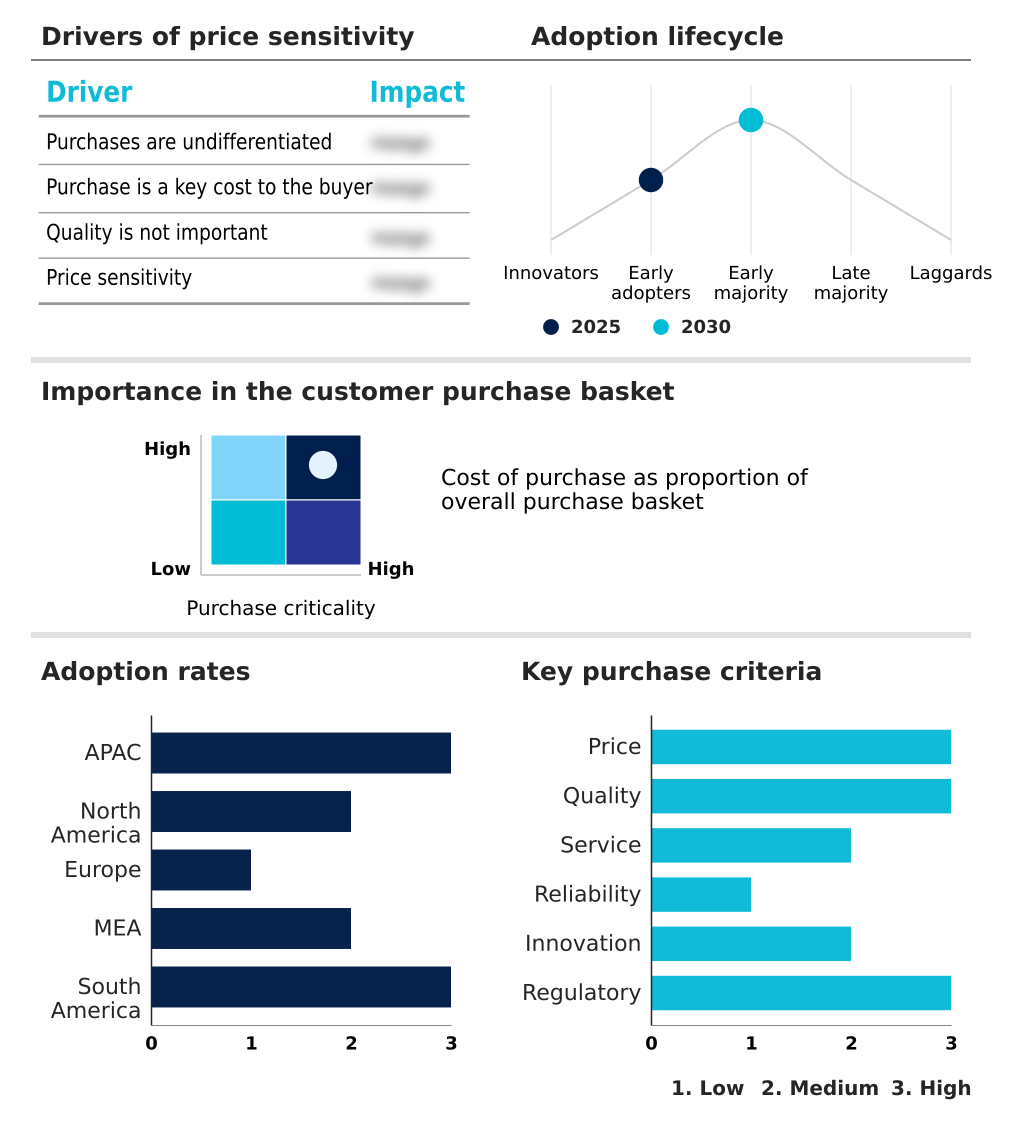
The arcade gaming market forecasting report includes the adoption lifecycle of the market, covering from the innovator’s stage to the laggard’s stage. It focuses on adoption rates in different regions based on penetration. Furthermore, the arcade gaming market report also includes key purchase criteria and drivers of price sensitivity to help companies evaluate and develop their market growth analysis strategies.

Customer Landscape of Arcade Gaming Industry

Competitive Landscape

Companies are implementing various strategies, such as strategic alliances, arcade gaming market forecast, partnerships, mergers and acquisitions, geographical expansion, and product/service launches, to enhance their presence in the industry.

Adrenaline Amusements Inc. - Analysis focuses on high-fidelity arcade systems, including immersive simulators and redemption games, designed for out-of-home entertainment venues.

The industry research and growth report includes detailed analyses of the competitive landscape of the market and information about key companies, including:

  • Adrenaline Amusements Inc.
  • Andamiro Co. Ltd.
  • Bandai Namco Amusement Inc.
  • Barron Games International
  • Bay Tek Entertainment Inc.
  • Benchmark Games Inc.
  • Bobs Space Racers Inc.
  • Chicago Gaming Co.
  • Coastal Amusements Inc.
  • Elaut Group
  • Incredible Technologies Inc.
  • Jersey Jack Pinball Inc.
  • LAI Games
  • Play Mechanix Inc.
  • Raw Thrills Inc.
  • Sega Amusements International
  • Smart Industries Corporation
  • Stern Pinball Inc.
  • TouchMagix Media Pvt. Ltd.
  • UNIS Technology Ltd.

Qualitative and quantitative analysis of companies has been conducted to help clients understand the wider business environment as well as the strengths and weaknesses of key industry players. Data is qualitatively analyzed to categorize companies as pure play, category-focused, industry-focused, and diversified; it is quantitatively analyzed to categorize companies as dominant, leading, strong, tentative, and weak.

Recent Development and News in Arcade gaming market

  • In May, 2025, Konami established a dedicated subsidiary, Konami Arcade Games, to focus exclusively on amusement operations and enhance responsiveness to market trends.
  • In September, 2025, the entertainment brand Brass Monkey announced its expansion into Abu Dhabi with a planned opening at The Galleria Al Maryah Island, integrating arcade classics with social activities.
  • In January, 2026, Raw Thrills Inc. released a significant content update for its popular videmption titles, illustrating a move toward the games-as-a-service model within the arcade space.
  • In March, 2026, Adrenaline Amusements Inc. launched Disney Speedstorm Arcade at the Amusement Expo International, successfully converting a popular digital racing title into a dedicated cabinet experience.

Dive into Technavio’s robust research methodology, blending expert interviews, extensive data synthesis, and validated models for unparalleled Arcade Gaming Market insights. See full methodology.

Market Scope
Page number 292
Base year 2025
Historic period 2020-2024
Forecast period 2026-2030
Growth momentum & CAGR Accelerate at a CAGR of 2%
Market growth 2026-2030 USD 2066.7 million
Market structure Fragmented
YoY growth 2025-2026(%) 1.9%
Key countries Japan, China, South Korea, India, Australia, Indonesia, US, Canada, Mexico, UK, Germany, France, Italy, Spain, The Netherlands, UAE, South Africa, Saudi Arabia, Turkey, Israel, Brazil, Argentina and Colombia
Competitive landscape Leading Companies, Market Positioning of Companies, Competitive Strategies, and Industry Risks

Request Free Sample

Research Analyst Overview

  • The arcade gaming market is evolving from a model based on standalone machines to integrated social ecosystems. This transition is driven by the need to create unique, non-replicable out-of-home experiences. Core to this shift is the deployment of coin-operated entertainment within larger competitive socializing venues that combine gameplay with hospitality.
  • The technological backbone of these modern centers relies on high-fidelity motion simulation, advanced virtual reality platforms, and networked systems for cross-platform connectivity. Boardroom decisions are now heavily influenced by the need to invest in infrastructure that supports data-driven operational management, including cloud-based operations hubs and real-time performance analytics.
  • These systems are critical for optimizing revenue and managing costs, with some operators achieving a 15% improvement in machine rotation efficiency. The focus is on leveraging player behavior analytics to enhance the guest journey and drive repeat business, ensuring the continued relevance and profitability of physical arcade installations.

What are the Key Data Covered in this Arcade Gaming Market Research and Growth Report?

  • What is the expected growth of the Arcade Gaming Market between 2026 and 2030?

    • USD 2.07 billion, at a CAGR of 2%

  • What segmentation does the market report cover?

    • The report is segmented by End-user (Gaming hubs, Semi-commercial, and Residential), Genre (Racing, Shooting, Sports, and Action), Type (Video games, Simulation games, and Mechanical games) and Geography (APAC, North America, Europe, Middle East and Africa, South America)

  • Which regions are analyzed in the report?

    • APAC, North America, Europe, Middle East and Africa and South America

  • What are the key growth drivers and market challenges?

    • Rise of immersive and competitive socializing hubs, Escalating supply chain costs and trade restrictions

  • Who are the major players in the Arcade Gaming Market?

    • Adrenaline Amusements Inc., Andamiro Co. Ltd., Bandai Namco Amusement Inc., Barron Games International, Bay Tek Entertainment Inc., Benchmark Games Inc., Bobs Space Racers Inc., Chicago Gaming Co., Coastal Amusements Inc., Elaut Group, Incredible Technologies Inc., Jersey Jack Pinball Inc., LAI Games, Play Mechanix Inc., Raw Thrills Inc., Sega Amusements International, Smart Industries Corporation, Stern Pinball Inc., TouchMagix Media Pvt. Ltd. and UNIS Technology Ltd.

Market Research Insights

  • The market's dynamics are shaped by a strategic pivot towards high-value premium interactive experiences within multi-attraction facilities. This shift is essential to counter rising operational costs, with electricity expenses in some regions increasing by 12.7%, significantly outpacing general inflation. Operators are implementing advanced data-driven operational management and loyalty reward programs to improve margins and enhance guest journey optimization.
  • The adoption of cloud infrastructure services for live service architectures enables dynamic content updates and centralized monitoring. This digital transformation is critical, as a focus on creating unique social amusement hubs is the primary strategy for competing against the convenience of at-home entertainment, where an improved ROI is now a key performance metric for venue operators.

We can help! Our analysts can customize this arcade gaming market research report to meet your requirements.

Get in touch

1. Executive Summary

1.1 Market overview

Executive Summary - Chart on Market Overview
Executive Summary - Data Table on Market Overview
Executive Summary - Chart on Global Market Characteristics
Executive Summary - Chart on Market by Geography
Executive Summary - Chart on Market Segmentation by End-user
Executive Summary - Chart on Market Segmentation by Genre
Executive Summary - Chart on Market Segmentation by Type
Executive Summary - Chart on Incremental Growth
Executive Summary - Data Table on Incremental Growth
Executive Summary - Chart on Company Market Positioning

2. Technavio Analysis

2.1 Analysis of price sensitivity, lifecycle, customer purchase basket, adoption rates, and purchase criteria

2.2 Criticality of inputs and Factors of differentiation

Chart on Overview on criticality of inputs and factors of differentiation

2.3 Factors of disruption

Chart on Overview on factors of disruption

2.4 Impact of drivers and challenges

Chart on Impact of drivers and challenges in 2025 and 2030

3. Market Landscape

3.1 Market ecosystem

Chart on Parent Market
Data Table on - Parent Market

3.2 Market characteristics

Chart on Market characteristics analysis

3.3 Value chain analysis

Chart on Value chain analysis

4. Market Sizing

4.1 Market definition

Data Table on Offerings of companies included in the market definition

4.2 Market segment analysis

Market segments

4.3 Market size 2025

4.4 Market outlook: Forecast for 2025-2030

Chart on Global - Market size and forecast 2025-2030 ($ million)
Data Table on Global - Market size and forecast 2025-2030 ($ million)
Chart on Global Market: Year-over-year growth 2025-2030 (%)
Data Table on Global Market: Year-over-year growth 2025-2030 (%)

5. Historic Market Size

5.1 Global Arcade Gaming Market 2020 - 2024

Historic Market Size - Data Table on Global Arcade Gaming Market 2020 - 2024 ($ million)

5.2 End-user segment analysis 2020 - 2024

Historic Market Size - End-user Segment 2020 - 2024 ($ million)

5.3 Genre segment analysis 2020 - 2024

Historic Market Size - Genre Segment 2020 - 2024 ($ million)

5.4 Type segment analysis 2020 - 2024

Historic Market Size - Type Segment 2020 - 2024 ($ million)

5.5 Geography segment analysis 2020 - 2024

Historic Market Size - Geography Segment 2020 - 2024 ($ million)

5.6 Country segment analysis 2020 - 2024

Historic Market Size - Country Segment 2020 - 2024 ($ million)

6. Qualitative Analysis

6.1 Impact of AI on global arcade gaming market

6.2 Impact of geopolitical conflicts on global arcade gaming market

7. Five Forces Analysis

7.1 Five forces summary

Five forces analysis - Comparison between 2025 and 2030

7.2 Bargaining power of buyers

Bargaining power of buyers - Impact of key factors 2025 and 2030

7.3 Bargaining power of suppliers

Bargaining power of suppliers - Impact of key factors in 2025 and 2030

7.4 Threat of new entrants

Threat of new entrants - Impact of key factors in 2025 and 2030

7.5 Threat of substitutes

Threat of substitutes - Impact of key factors in 2025 and 2030

7.6 Threat of rivalry

Threat of rivalry - Impact of key factors in 2025 and 2030

7.7 Market condition

Chart on Market condition - Five forces 2025 and 2030

8. Market Segmentation by End-user

8.1 Market segments

Chart on End-user - Market share 2025-2030 (%)
Data Table on End-user - Market share 2025-2030 (%)

8.2 Comparison by End-user

Chart on Comparison by End-user
Data Table on Comparison by End-user

8.3 Gaming hubs - Market size and forecast 2025-2030

Chart on Gaming hubs - Market size and forecast 2025-2030 ($ million)
Data Table on Gaming hubs - Market size and forecast 2025-2030 ($ million)
Chart on Gaming hubs - Year-over-year growth 2025-2030 (%)
Data Table on Gaming hubs - Year-over-year growth 2025-2030 (%)

8.4 Semi-commercial - Market size and forecast 2025-2030

Chart on Semi-commercial - Market size and forecast 2025-2030 ($ million)
Data Table on Semi-commercial - Market size and forecast 2025-2030 ($ million)
Chart on Semi-commercial - Year-over-year growth 2025-2030 (%)
Data Table on Semi-commercial - Year-over-year growth 2025-2030 (%)

8.5 Residential - Market size and forecast 2025-2030

Chart on Residential - Market size and forecast 2025-2030 ($ million)
Data Table on Residential - Market size and forecast 2025-2030 ($ million)
Chart on Residential - Year-over-year growth 2025-2030 (%)
Data Table on Residential - Year-over-year growth 2025-2030 (%)

8.6 Market opportunity by End-user

Market opportunity by End-user ($ million)
Data Table on Market opportunity by End-user ($ million)

9. Market Segmentation by Genre

9.1 Market segments

Chart on Genre - Market share 2025-2030 (%)
Data Table on Genre - Market share 2025-2030 (%)

9.2 Comparison by Genre

Chart on Comparison by Genre
Data Table on Comparison by Genre

9.3 Racing - Market size and forecast 2025-2030

Chart on Racing - Market size and forecast 2025-2030 ($ million)
Data Table on Racing - Market size and forecast 2025-2030 ($ million)
Chart on Racing - Year-over-year growth 2025-2030 (%)
Data Table on Racing - Year-over-year growth 2025-2030 (%)

9.4 Shooting - Market size and forecast 2025-2030

Chart on Shooting - Market size and forecast 2025-2030 ($ million)
Data Table on Shooting - Market size and forecast 2025-2030 ($ million)
Chart on Shooting - Year-over-year growth 2025-2030 (%)
Data Table on Shooting - Year-over-year growth 2025-2030 (%)

9.5 Sports - Market size and forecast 2025-2030

Chart on Sports - Market size and forecast 2025-2030 ($ million)
Data Table on Sports - Market size and forecast 2025-2030 ($ million)
Chart on Sports - Year-over-year growth 2025-2030 (%)
Data Table on Sports - Year-over-year growth 2025-2030 (%)

9.6 Action - Market size and forecast 2025-2030

Chart on Action - Market size and forecast 2025-2030 ($ million)
Data Table on Action - Market size and forecast 2025-2030 ($ million)
Chart on Action - Year-over-year growth 2025-2030 (%)
Data Table on Action - Year-over-year growth 2025-2030 (%)

9.7 Market opportunity by Genre

Market opportunity by Genre ($ million)
Data Table on Market opportunity by Genre ($ million)

10. Market Segmentation by Type

10.1 Market segments

Chart on Type - Market share 2025-2030 (%)
Data Table on Type - Market share 2025-2030 (%)

10.2 Comparison by Type

Chart on Comparison by Type
Data Table on Comparison by Type

10.3 Video games - Market size and forecast 2025-2030

Chart on Video games - Market size and forecast 2025-2030 ($ million)
Data Table on Video games - Market size and forecast 2025-2030 ($ million)
Chart on Video games - Year-over-year growth 2025-2030 (%)
Data Table on Video games - Year-over-year growth 2025-2030 (%)

10.4 Simulation games - Market size and forecast 2025-2030

Chart on Simulation games - Market size and forecast 2025-2030 ($ million)
Data Table on Simulation games - Market size and forecast 2025-2030 ($ million)
Chart on Simulation games - Year-over-year growth 2025-2030 (%)
Data Table on Simulation games - Year-over-year growth 2025-2030 (%)

10.5 Mechanical games - Market size and forecast 2025-2030

Chart on Mechanical games - Market size and forecast 2025-2030 ($ million)
Data Table on Mechanical games - Market size and forecast 2025-2030 ($ million)
Chart on Mechanical games - Year-over-year growth 2025-2030 (%)
Data Table on Mechanical games - Year-over-year growth 2025-2030 (%)

10.6 Market opportunity by Type

Market opportunity by Type ($ million)
Data Table on Market opportunity by Type ($ million)

11. Customer Landscape

11.1 Customer landscape overview

Analysis of price sensitivity, lifecycle, customer purchase basket, adoption rates, and purchase criteria

12. Geographic Landscape

12.1 Geographic segmentation

Chart on Market share by geography 2025-2030 (%)
Data Table on Market share by geography 2025-2030 (%)

12.2 Geographic comparison

Chart on Geographic comparison
Data Table on Geographic comparison

12.3 APAC - Market size and forecast 2025-2030

Chart on APAC - Market size and forecast 2025-2030 ($ million)
Data Table on APAC - Market size and forecast 2025-2030 ($ million)
Chart on APAC - Year-over-year growth 2025-2030 (%)
Data Table on APAC - Year-over-year growth 2025-2030 (%)
Chart on Regional Comparison - APAC
Data Table on Regional Comparison - APAC

12.3.1 Japan - Market size and forecast 2025-2030

Chart on Japan - Market size and forecast 2025-2030 ($ million)
Data Table on Japan - Market size and forecast 2025-2030 ($ million)
Chart on Japan - Year-over-year growth 2025-2030 (%)
Data Table on Japan - Year-over-year growth 2025-2030 (%)

12.3.2 China - Market size and forecast 2025-2030

Chart on China - Market size and forecast 2025-2030 ($ million)
Data Table on China - Market size and forecast 2025-2030 ($ million)
Chart on China - Year-over-year growth 2025-2030 (%)
Data Table on China - Year-over-year growth 2025-2030 (%)

12.3.3 South Korea - Market size and forecast 2025-2030

Chart on South Korea - Market size and forecast 2025-2030 ($ million)
Data Table on South Korea - Market size and forecast 2025-2030 ($ million)
Chart on South Korea - Year-over-year growth 2025-2030 (%)
Data Table on South Korea - Year-over-year growth 2025-2030 (%)

12.3.4 India - Market size and forecast 2025-2030

Chart on India - Market size and forecast 2025-2030 ($ million)
Data Table on India - Market size and forecast 2025-2030 ($ million)
Chart on India - Year-over-year growth 2025-2030 (%)
Data Table on India - Year-over-year growth 2025-2030 (%)

12.3.5 Australia - Market size and forecast 2025-2030

Chart on Australia - Market size and forecast 2025-2030 ($ million)
Data Table on Australia - Market size and forecast 2025-2030 ($ million)
Chart on Australia - Year-over-year growth 2025-2030 (%)
Data Table on Australia - Year-over-year growth 2025-2030 (%)

12.3.6 Indonesia - Market size and forecast 2025-2030

Chart on Indonesia - Market size and forecast 2025-2030 ($ million)
Data Table on Indonesia - Market size and forecast 2025-2030 ($ million)
Chart on Indonesia - Year-over-year growth 2025-2030 (%)
Data Table on Indonesia - Year-over-year growth 2025-2030 (%)

12.4 North America - Market size and forecast 2025-2030

Chart on North America - Market size and forecast 2025-2030 ($ million)
Data Table on North America - Market size and forecast 2025-2030 ($ million)
Chart on North America - Year-over-year growth 2025-2030 (%)
Data Table on North America - Year-over-year growth 2025-2030 (%)
Chart on Regional Comparison - North America
Data Table on Regional Comparison - North America

12.4.1 US - Market size and forecast 2025-2030

Chart on US - Market size and forecast 2025-2030 ($ million)
Data Table on US - Market size and forecast 2025-2030 ($ million)
Chart on US - Year-over-year growth 2025-2030 (%)
Data Table on US - Year-over-year growth 2025-2030 (%)

12.4.2 Canada - Market size and forecast 2025-2030

Chart on Canada - Market size and forecast 2025-2030 ($ million)
Data Table on Canada - Market size and forecast 2025-2030 ($ million)
Chart on Canada - Year-over-year growth 2025-2030 (%)
Data Table on Canada - Year-over-year growth 2025-2030 (%)

12.4.3 Mexico - Market size and forecast 2025-2030

Chart on Mexico - Market size and forecast 2025-2030 ($ million)
Data Table on Mexico - Market size and forecast 2025-2030 ($ million)
Chart on Mexico - Year-over-year growth 2025-2030 (%)
Data Table on Mexico - Year-over-year growth 2025-2030 (%)

12.5 Europe - Market size and forecast 2025-2030

Chart on Europe - Market size and forecast 2025-2030 ($ million)
Data Table on Europe - Market size and forecast 2025-2030 ($ million)
Chart on Europe - Year-over-year growth 2025-2030 (%)
Data Table on Europe - Year-over-year growth 2025-2030 (%)
Chart on Regional Comparison - Europe
Data Table on Regional Comparison - Europe

12.5.1 UK - Market size and forecast 2025-2030

Chart on UK - Market size and forecast 2025-2030 ($ million)
Data Table on UK - Market size and forecast 2025-2030 ($ million)
Chart on UK - Year-over-year growth 2025-2030 (%)
Data Table on UK - Year-over-year growth 2025-2030 (%)

12.5.2 Germany - Market size and forecast 2025-2030

Chart on Germany - Market size and forecast 2025-2030 ($ million)
Data Table on Germany - Market size and forecast 2025-2030 ($ million)
Chart on Germany - Year-over-year growth 2025-2030 (%)
Data Table on Germany - Year-over-year growth 2025-2030 (%)

12.5.3 France - Market size and forecast 2025-2030

Chart on France - Market size and forecast 2025-2030 ($ million)
Data Table on France - Market size and forecast 2025-2030 ($ million)
Chart on France - Year-over-year growth 2025-2030 (%)
Data Table on France - Year-over-year growth 2025-2030 (%)

12.5.4 Italy - Market size and forecast 2025-2030

Chart on Italy - Market size and forecast 2025-2030 ($ million)
Data Table on Italy - Market size and forecast 2025-2030 ($ million)
Chart on Italy - Year-over-year growth 2025-2030 (%)
Data Table on Italy - Year-over-year growth 2025-2030 (%)

12.5.5 Spain - Market size and forecast 2025-2030

Chart on Spain - Market size and forecast 2025-2030 ($ million)
Data Table on Spain - Market size and forecast 2025-2030 ($ million)
Chart on Spain - Year-over-year growth 2025-2030 (%)
Data Table on Spain - Year-over-year growth 2025-2030 (%)

12.5.6 The Netherlands - Market size and forecast 2025-2030

Chart on The Netherlands - Market size and forecast 2025-2030 ($ million)
Data Table on The Netherlands - Market size and forecast 2025-2030 ($ million)
Chart on The Netherlands - Year-over-year growth 2025-2030 (%)
Data Table on The Netherlands - Year-over-year growth 2025-2030 (%)

12.6 Middle East and Africa - Market size and forecast 2025-2030

Chart on Middle East and Africa - Market size and forecast 2025-2030 ($ million)
Data Table on Middle East and Africa - Market size and forecast 2025-2030 ($ million)
Chart on Middle East and Africa - Year-over-year growth 2025-2030 (%)
Data Table on Middle East and Africa - Year-over-year growth 2025-2030 (%)
Chart on Regional Comparison - Middle East and Africa
Data Table on Regional Comparison - Middle East and Africa

12.6.1 UAE - Market size and forecast 2025-2030

Chart on UAE - Market size and forecast 2025-2030 ($ million)
Data Table on UAE - Market size and forecast 2025-2030 ($ million)
Chart on UAE - Year-over-year growth 2025-2030 (%)
Data Table on UAE - Year-over-year growth 2025-2030 (%)

12.6.2 South Africa - Market size and forecast 2025-2030

Chart on South Africa - Market size and forecast 2025-2030 ($ million)
Data Table on South Africa - Market size and forecast 2025-2030 ($ million)
Chart on South Africa - Year-over-year growth 2025-2030 (%)
Data Table on South Africa - Year-over-year growth 2025-2030 (%)

12.6.3 Saudi Arabia - Market size and forecast 2025-2030

Chart on Saudi Arabia - Market size and forecast 2025-2030 ($ million)
Data Table on Saudi Arabia - Market size and forecast 2025-2030 ($ million)
Chart on Saudi Arabia - Year-over-year growth 2025-2030 (%)
Data Table on Saudi Arabia - Year-over-year growth 2025-2030 (%)

12.6.4 Turkey - Market size and forecast 2025-2030

Chart on Turkey - Market size and forecast 2025-2030 ($ million)
Data Table on Turkey - Market size and forecast 2025-2030 ($ million)
Chart on Turkey - Year-over-year growth 2025-2030 (%)
Data Table on Turkey - Year-over-year growth 2025-2030 (%)

12.6.5 Israel - Market size and forecast 2025-2030

Chart on Israel - Market size and forecast 2025-2030 ($ million)
Data Table on Israel - Market size and forecast 2025-2030 ($ million)
Chart on Israel - Year-over-year growth 2025-2030 (%)
Data Table on Israel - Year-over-year growth 2025-2030 (%)

12.7 South America - Market size and forecast 2025-2030

Chart on South America - Market size and forecast 2025-2030 ($ million)
Data Table on South America - Market size and forecast 2025-2030 ($ million)
Chart on South America - Year-over-year growth 2025-2030 (%)
Data Table on South America - Year-over-year growth 2025-2030 (%)
Chart on Regional Comparison - South America
Data Table on Regional Comparison - South America

12.7.1 Brazil - Market size and forecast 2025-2030

Chart on Brazil - Market size and forecast 2025-2030 ($ million)
Data Table on Brazil - Market size and forecast 2025-2030 ($ million)
Chart on Brazil - Year-over-year growth 2025-2030 (%)
Data Table on Brazil - Year-over-year growth 2025-2030 (%)

12.7.2 Argentina - Market size and forecast 2025-2030

Chart on Argentina - Market size and forecast 2025-2030 ($ million)
Data Table on Argentina - Market size and forecast 2025-2030 ($ million)
Chart on Argentina - Year-over-year growth 2025-2030 (%)
Data Table on Argentina - Year-over-year growth 2025-2030 (%)

12.7.3 Colombia - Market size and forecast 2025-2030

Chart on Colombia - Market size and forecast 2025-2030 ($ million)
Data Table on Colombia - Market size and forecast 2025-2030 ($ million)
Chart on Colombia - Year-over-year growth 2025-2030 (%)
Data Table on Colombia - Year-over-year growth 2025-2030 (%)

12.8 Market opportunity by geography

Market opportunity by geography ($ million)
Data Tables on Market opportunity by geography ($ million)

13. Drivers, Challenges, and Opportunity

13.1 Market drivers

Rise of immersive and competitive socializing hubs
Technological integration of AI and virtual reality
Adoption of cashless payment and digital ecosystems

13.2 Market challenges

Escalating supply chain costs and trade restrictions
Intense competition from ubiquitous digital and cloud gaming platforms
Operational margin compression and rising utility overheads

13.3 Impact of drivers and challenges

Impact of drivers and challenges in 2025 and 2030

13.4 Market opportunities

Expansion of hybrid family entertainment centers and social amusement hubs
Integration of immersive technologies and hyper realistic simulation
Digital transformation and data driven operational management

14. Competitive Landscape

14.1 Overview

14.2

Overview on criticality of inputs and factors of differentiation

14.3 Landscape disruption

Overview on factors of disruption

14.4 Industry risks

Impact of key risks on business

15. Competitive Analysis

15.1 Companies profiled

Companies covered

15.2 Company ranking index

15.3 Market positioning of companies

Matrix on companies position and classification

15.4 Adrenaline Amusements Inc.

Adrenaline Amusements Inc. - Overview
Adrenaline Amusements Inc. - Product / Service
Adrenaline Amusements Inc. - Key offerings
SWOT

15.5 Andamiro Co. Ltd.

Andamiro Co. Ltd. - Overview
Andamiro Co. Ltd. - Product / Service
Andamiro Co. Ltd. - Key offerings
SWOT

15.6 Bandai Namco Amusement Inc.

Bandai Namco Amusement Inc. - Overview
Bandai Namco Amusement Inc. - Product / Service
Bandai Namco Amusement Inc. - Key offerings
SWOT

15.7 Barron Games International

Barron Games International - Overview
Barron Games International - Product / Service
Barron Games International - Key offerings
SWOT

15.8 Bay Tek Entertainment Inc.

Bay Tek Entertainment Inc. - Overview
Bay Tek Entertainment Inc. - Product / Service
Bay Tek Entertainment Inc. - Key offerings
SWOT

15.9 Benchmark Games Inc.

Benchmark Games Inc. - Overview
Benchmark Games Inc. - Product / Service
Benchmark Games Inc. - Key offerings
SWOT

15.10 Bobs Space Racers Inc.

Bobs Space Racers Inc. - Overview
Bobs Space Racers Inc. - Product / Service
Bobs Space Racers Inc. - Key offerings
SWOT

15.11 Coastal Amusements Inc.

Coastal Amusements Inc. - Overview
Coastal Amusements Inc. - Product / Service
Coastal Amusements Inc. - Key offerings
SWOT

15.12 Elaut Group

Elaut Group - Overview
Elaut Group - Product / Service
Elaut Group - Key offerings
SWOT

15.13 LAI Games

LAI Games - Overview
LAI Games - Product / Service
LAI Games - Key offerings
SWOT

15.14 Play Mechanix Inc.

Play Mechanix Inc. - Overview
Play Mechanix Inc. - Product / Service
Play Mechanix Inc. - Key offerings
SWOT

15.15 Raw Thrills Inc.

Raw Thrills Inc. - Overview
Raw Thrills Inc. - Product / Service
Raw Thrills Inc. - Key offerings
SWOT

15.16 Sega Amusements International

Sega Amusements International - Overview
Sega Amusements International - Product / Service
Sega Amusements International - Key offerings
SWOT

15.17 Stern Pinball Inc.

Stern Pinball Inc. - Overview
Stern Pinball Inc. - Product / Service
Stern Pinball Inc. - Key offerings
SWOT

15.18 UNIS Technology Ltd.

UNIS Technology Ltd. - Overview
UNIS Technology Ltd. - Product / Service
UNIS Technology Ltd. - Key offerings
SWOT

16. Appendix

16.1 Scope of the report

Market definition
Objectives
Notes and caveats

16.2 Inclusions and exclusions checklist

Inclusions checklist
Exclusions checklist

16.3 Currency conversion rates for US$

16.4 Research methodology

16.5 Data procurement

Information sources

16.6 Data validation

16.7 Validation techniques employed for market sizing

16.8 Data synthesis

16.9 360 degree market analysis

16.10 List of abbreviations

Research Methodology

Technavio presents a detailed picture of the market by way of study, synthesis, and summation of data from multiple sources. The analysts have presented the various facets of the market with a particular focus on identifying the key industry influencers. The data thus presented is comprehensive, reliable, and the result of extensive research, both primary and secondary.

INFORMATION SOURCES

Primary sources

  • Manufacturers and suppliers
  • Channel partners
  • Industry experts
  • Strategic decision makers

Secondary sources

  • Industry journals and periodicals
  • Government data
  • Financial reports of key industry players
  • Historical data
  • Press releases

DATA ANALYSIS

Data Synthesis

  • Collation of data
  • Estimation of key figures
  • Analysis of derived insights

Data Validation

  • Triangulation with data models
  • Reference against proprietary databases
  • Corroboration with industry experts

REPORT WRITING

Qualitative

  • Market drivers
  • Market challenges
  • Market trends
  • Five forces analysis

Quantitative

  • Market size and forecast
  • Market segmentation
  • Geographical insights
  • Competitive landscape

Interested in this report?

Get your sample now to see our research methodology and insights!

Download Now

Frequently Asked Questions

Arcade Gaming market growth will increase by USD 2066.7 million during 2026-2030.

The Arcade Gaming market is expected to grow at a CAGR of 2% during 2026-2030.

Arcade Gaming market is segmented by End-user (Gaming hubs, Semi-commercial, Residential) Genre (Racing, Shooting, Sports, Action) Type (Video games, Simulation games, Mechanical games)

Adrenaline Amusements Inc., Andamiro Co. Ltd., Bandai Namco Amusement Inc., Barron Games International, Bay Tek Entertainment Inc., Benchmark Games Inc., Bobs Space Racers Inc., Chicago Gaming Co., Coastal Amusements Inc., Elaut Group, Incredible Technologies Inc., Jersey Jack Pinball Inc., LAI Games, Play Mechanix Inc., Raw Thrills Inc., Sega Amusements International, Smart Industries Corporation, Stern Pinball Inc., TouchMagix Media Pvt. Ltd., UNIS Technology Ltd. are a few of the key vendors in the Arcade Gaming market.

APAC will register the highest growth rate of 60.4% among the other regions. Therefore, the Arcade Gaming market in APAC is expected to garner significant business opportunities for the vendors during the forecast period.

Japan, China, South Korea, India, Australia, Indonesia, US, Canada, Mexico, UK, Germany, France, Italy, Spain, The Netherlands, UAE, South Africa, Saudi Arabia, Turkey, Israel, Brazil, Argentina, Colombia

  • Rise of immersive and competitive socializing hubs is the driving factor this market.

The Arcade Gaming market vendors should focus on grabbing business opportunities from the End-user segment as it accounted for the largest market share in the base year.
RIA - Research AI Assistant
Ask RIA