Architectural Engineering And Construction Solutions (AECS) Market Analysis, Size, and Forecast 2026-2030: North America (US, Canada, and Mexico), Europe (UK, Germany, and France), APAC (China, Japan, and India), South America (Brazil and Argentina), Middle East and Africa (Saudi Arabia, UAE, and South Africa), and Rest of World (ROW)

Architectural Engineering And Construction Solutions (AECS) Market Analysis, Size, and Forecast 2026-2030:
North America (US, Canada, and Mexico), Europe (UK, Germany, and France), APAC (China, Japan, and India), South America (Brazil and Argentina), Middle East and Africa (Saudi Arabia, UAE, and South Africa), and Rest of World (ROW)

Published: Mar 2026 307 Pages SKU: IRTNTR40852

Market Overview at a Glance

$13.82 B
Market Opportunity
15.2%
CAGR 2025 - 2030
34.8%
North America Growth
$10.45 B
Software segment 2024

Architectural Engineering And Construction Solutions (AECS) Market Size 2026-2030

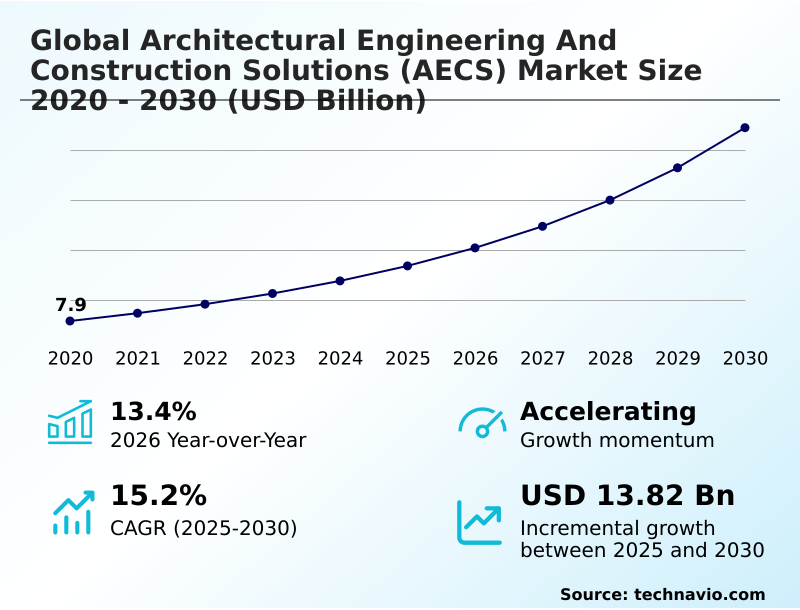
The architectural engineering and construction solutions (aecs) market size is valued to increase by USD 13.82 billion, at a CAGR of 15.2% from 2025 to 2030. Integration of building information modeling and generative design will drive the architectural engineering and construction solutions (aecs) market.

Major Market Trends & Insights

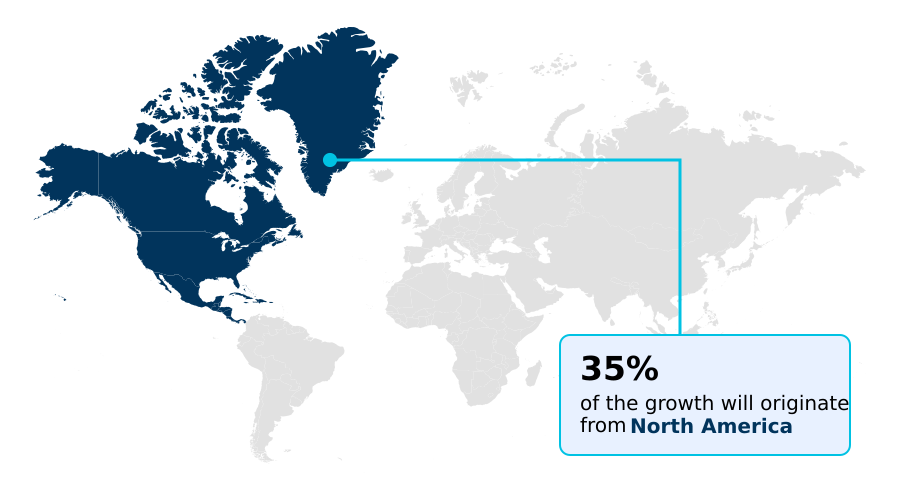
  • North America dominated the market and accounted for a 34.8% growth during the forecast period.
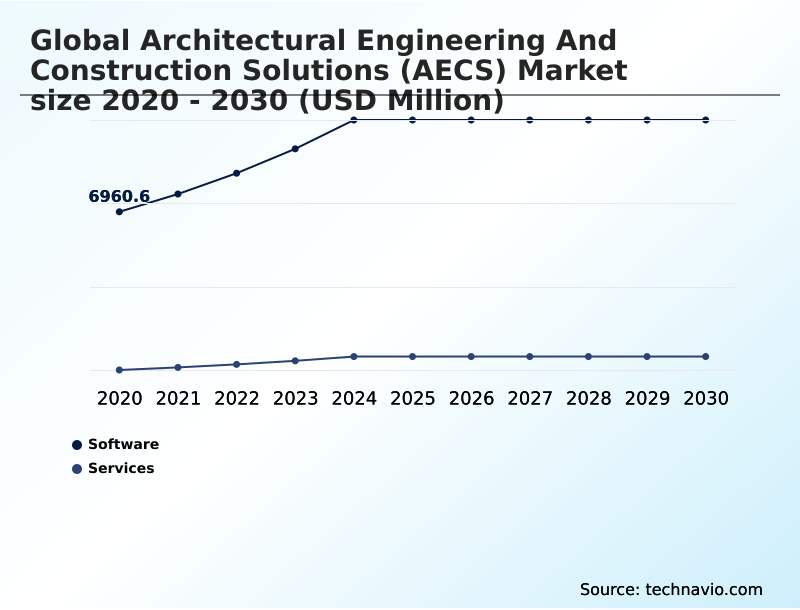
  • By Product - Software segment was valued at USD 10.45 billion in 2024
  • By Deployment - On-premises segment accounted for the largest market revenue share in 2024

Market Size & Forecast

  • Market Opportunities: USD 19.33 billion
  • Market Future Opportunities: USD 13.82 billion
  • CAGR from 2025 to 2030 : 15.2%

Market Summary

  • The architectural engineering and construction solutions market is undergoing a significant digital transformation, moving away from traditional methods toward data-centric approaches. This shift is propelled by the need for greater productivity and sustainability in urban development and infrastructure projects.
  • Core to this evolution is the adoption of building information modeling (BIM), which provides a unified digital representation of a project, enabling stakeholders to identify conflicts early and reduce rework.
  • For instance, a firm managing a large-scale hospital construction can use an integrated project delivery model to coordinate architectural, structural, and mechanical data, ensuring that all systems are harmonized before construction begins. This mitigates the high costs associated with on-site modifications.
  • The market is also shaped by the growing demand for green building certifications, which requires advanced energy efficiency simulation and life-cycle assessment modules. However, the high initial capital expenditure for advanced software and a persistent technical skills gap create significant barriers, particularly for smaller enterprises.
  • The industry must balance technological advancement with the need for accessible tools and a digitally proficient workforce to realize its full potential across all segments.

What will be the Size of the Architectural Engineering And Construction Solutions (AECS) Market during the forecast period?

Get Key Insights on Market Forecast (PDF) Request Free Sample

How is the Architectural Engineering And Construction Solutions (AECS) Market Segmented?

The architectural engineering and construction solutions (aecs) industry research report provides comprehensive data (region-wise segment analysis), with forecasts and estimates in "USD million" for the period 2026-2030, as well as historical data from 2020-2024 for the following segments.

  • Product
    • Software
    • Services
  • Deployment
    • On-premises
    • Cloud-based
  • Sector
    • Large enterprises
    • SMEs
  • End-user
    • Construction and architecture
    • Education
    • Others
  • Geography
    • North America
      • US
      • Canada
      • Mexico
    • Europe
      • UK
      • Germany
      • France
    • APAC
      • China
      • Japan
      • India
    • South America
      • Brazil
      • Argentina
    • Middle East and Africa
      • Saudi Arabia
      • UAE
      • South Africa
    • Rest of World (ROW)

By Product Insights

The software segment is estimated to witness significant growth during the forecast period.

The software segment is the digital backbone of the architectural engineering and construction solutions market, driven by the need for enhanced collaboration and automated workflows.

The adoption of cloud-based collaboration environment tools and building information modeling is standard, allowing stakeholders to work within a unified ecosystem to minimize errors.

A critical business outcome is the ability of generative design tools to reduce the time spent on the schematic design phase by more than 40%. The integration of AI for predictive maintenance and more efficient resource allocation is growing.

The shift toward subscription-based models supports the scalability of small and medium enterprises. Sustainability remains a core focus, with software incorporating modules for embodied carbon calculation and energy efficiency simulation to achieve net-zero objectives.

Request Free Sample

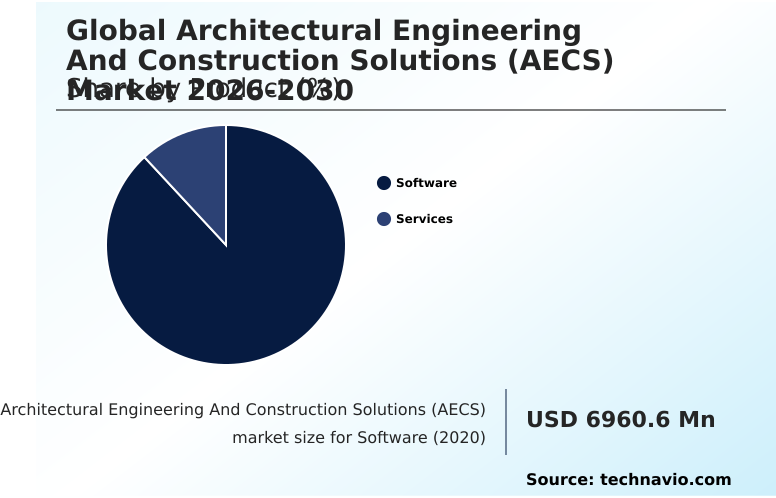
The Software segment was valued at USD 10.45 billion in 2024 and showed a gradual increase during the forecast period.

Request Free Sample

Regional Analysis

North America is estimated to contribute 34.8% to the growth of the global market during the forecast period.Technavio’s analysts have elaborately explained the regional trends and drivers that shape the market during the forecast period.

See How Architectural Engineering And Construction Solutions (AECS) Market Demand is Rising in North America Request Free Sample

The geographic landscape of the architectural engineering and construction solutions market is led by North America and Europe, which together account for over 64% of the market.

These regions exhibit high digital maturity, driven by stringent regulatory mandates for building information modeling and a focus on retrofitting aging infrastructure.

North America contributes approximately 34.8% of the incremental growth, benefiting from a robust ecosystem of technology providers and significant investment in smart city frameworks.

The APAC region is the fastest-growing market, characterized by massive urbanization and large-scale infrastructure projects in countries like China and India. This growth is fueling demand for spatial planning tools and a smart construction platform.

While digital adoption varies, a leapfrogging effect is observed where firms move directly to mobile and cloud-based systems, enhancing on-site productivity by up to 20%.

Market Dynamics

Our researchers analyzed the data with 2025 as the base year, along with the key drivers, trends, and challenges. A holistic analysis of drivers will help companies refine their marketing strategies to gain a competitive advantage.

  • Strategic implementation of advanced digital tools is reshaping the construction and engineering landscape. The use of AECS for sustainable urban planning allows municipalities to model complex environmental and social factors, moving beyond simple structural design.
  • This is closely linked to the digital twin for infrastructure asset management, where a virtual replica of a physical asset enables real-time monitoring and predictive maintenance using aecs digital twins, significantly extending the lifespan of critical infrastructure. The integration of generative AI for automated design is another transformative force, allowing for the rapid generation of thousands of optimized design iterations.
  • This approach is becoming standard for bim for public infrastructure projects, where efficiency and compliance are paramount. The necessary real time iot data integration feeds these digital twins, providing the live feedback needed for accurate simulations. Cloud-based aecs for remote collaboration has become essential, breaking down geographic barriers for project teams.
  • At a granular level, life cycle assessment in aecs software supports the aecs role in circular economy by tracking materials and embodied carbon. However, cybersecurity risks in cloud based aecs platforms require vigilant management. Addressing the aecs technical skills gap is crucial for widespread adoption, as interoperability challenges in aecs platforms can increase project costs.
  • Firms are now leveraging 5d bim for project cost management and augmented reality for aecs site inspections to improve financial oversight and on-site accuracy. The use of aecs solutions for smart city development integrates all these elements, from structural analysis for seismic resilience to aecs for modular and prefabricated construction, and even integrating geospatial data in aecs.
  • This holistic approach, focused on energy modeling for net-zero buildings and ensuring regulatory compliance with aecs tools, allows leading firms to deliver projects 15% faster than those relying on traditional methods.

What are the key market drivers leading to the rise in the adoption of Architectural Engineering And Construction Solutions (AECS) Industry?

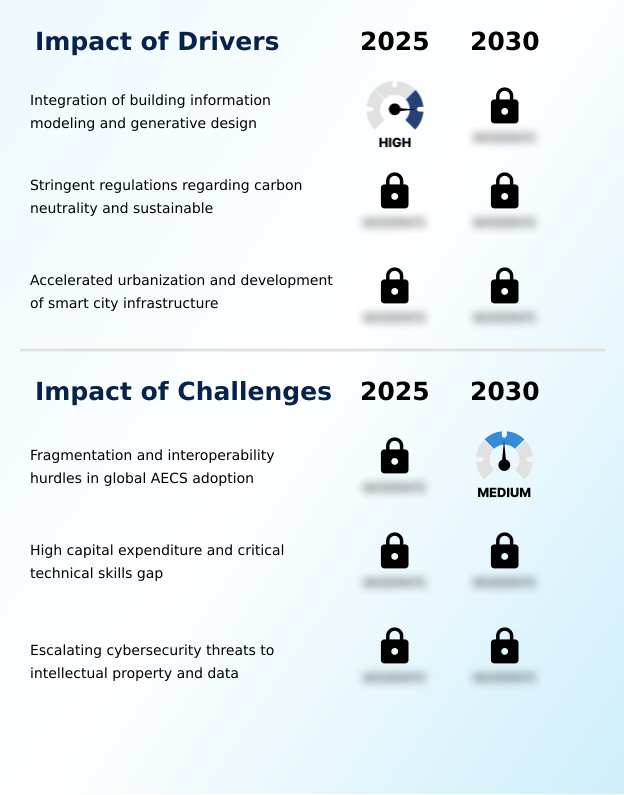
  • The integration of building information modeling with generative design capabilities is a key driver for the market, facilitating a more comprehensive understanding of project lifecycles.

  • Market growth is primarily propelled by the advancement and mandated adoption of building information modeling, which serves as a single source of truth for complex projects.
  • This digital-first redevelopment approach streamlines collaboration and allows for the early detection of design conflicts, increasing project efficiency by over 20%. A second major driver is the global push for sustainability, underscored by stringent regulations like the sustainable infrastructure mandate.
  • AECS platforms provide the analytical tools for accurate carbon footprint calculation and energy modeling, which are now essential for securing green financing and ensuring compliance. Finally, accelerated urbanization and the development of smart city frameworks necessitate robust, scalable AECS solutions.
  • These platforms are critical for designing interconnected systems and managing the modernization of aging infrastructure, where integrated project delivery models are becoming standard practice.

What are the market trends shaping the Architectural Engineering And Construction Solutions (AECS) Industry?

  • The proliferation of generative AI in design automation is emerging as a significant market trend. This technology is transforming the architectural process by enabling rapid iteration and optimization of complex designs.

  • Key trends are reshaping the architectural engineering and construction solutions market, led by the proliferation of generative AI for automated design conflict detection and optimization. This technology allows firms to reduce schematic design phase time by over 40% while improving structural integrity. Another significant trend is the implementation of digital building passports and granular sustainability tracking.
  • This move toward a circular economy model is supported by advanced life-cycle assessment modules that calculate the embodied carbon of every component, with adoption rates increasing by 25% in regions with strict green building certifications.
  • Furthermore, the convergence of digital twins with real-time IoT data is enabling predictive maintenance for large-scale infrastructure, moving the industry from a reactive to a proactive asset management model. This integration improves operational efficiency and reduces resource consumption significantly.

What challenges does the Architectural Engineering And Construction Solutions (AECS) Industry face during its growth?

  • Fragmentation across software platforms and persistent interoperability hurdles present a key challenge to global AECS adoption and industry growth.

  • The primary challenge hindering market growth is the persistent lack of interoperability between disparate software systems, which creates data silos and inefficiencies. This fragmentation leads to significant project delays and financial waste, with one analysis indicating that discrepancies in file compatibility can increase total project costs by as much as 4%.
  • A second major challenge is the substantial capital expenditure required for advanced AECS implementation, coupled with a critical technical skills gap. A recent study revealed that 60% of architectural firms delay adopting advanced automation tools due to a shortage of qualified digital specialists. This scarcity of talent elevates labor costs and discourages long-term investment.
  • Finally, escalating cybersecurity risks associated with cloud-based platforms and digital twins pose a significant threat to sensitive intellectual property and the integrity of project data.

Exclusive Technavio Analysis on Customer Landscape

The architectural engineering and construction solutions (aecs) market forecasting report includes the adoption lifecycle of the market, covering from the innovator’s stage to the laggard’s stage. It focuses on adoption rates in different regions based on penetration. Furthermore, the architectural engineering and construction solutions (aecs) market report also includes key purchase criteria and drivers of price sensitivity to help companies evaluate and develop their market growth analysis strategies.

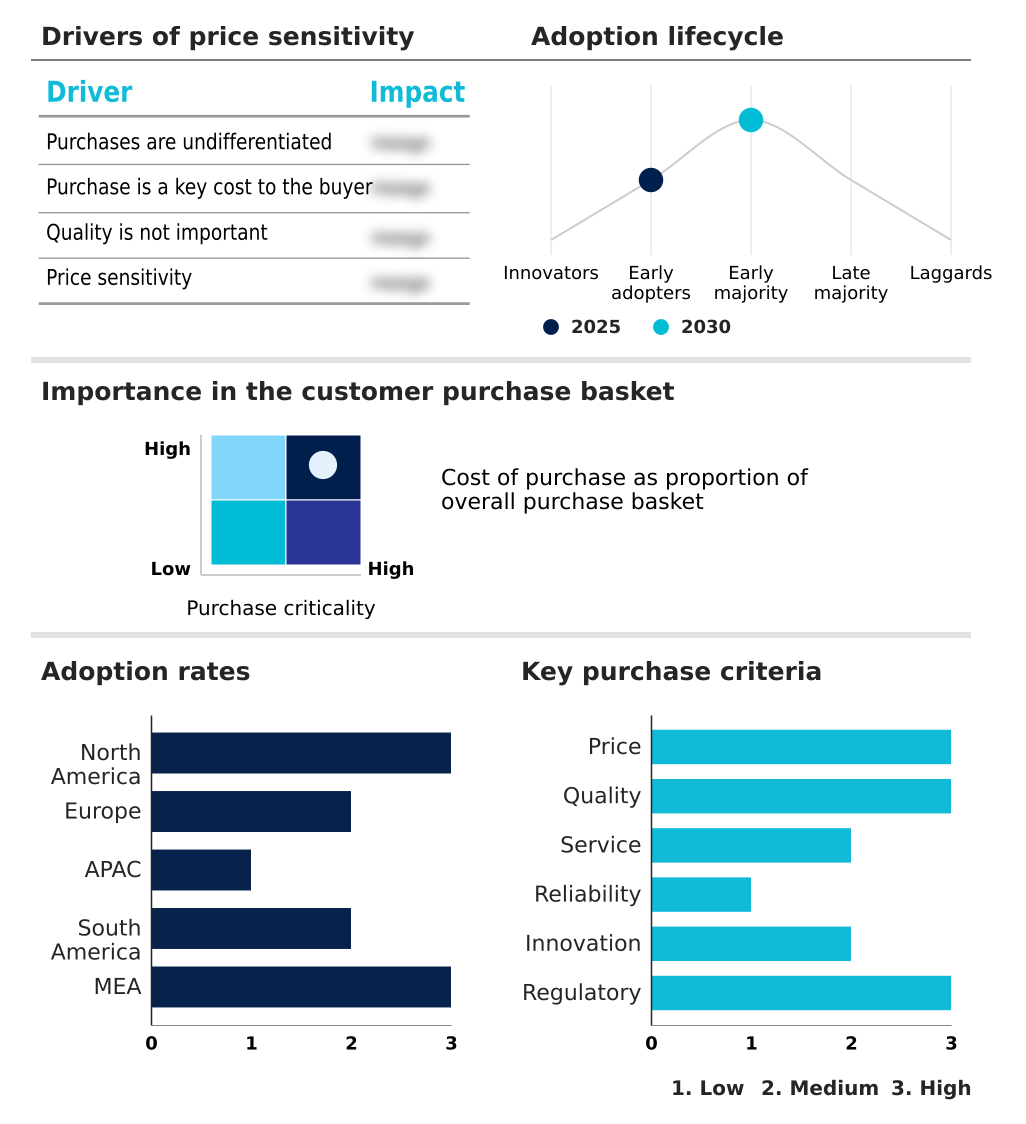
Customer Landscape of Architectural Engineering And Construction Solutions (AECS) Industry

Competitive Landscape

Companies are implementing various strategies, such as strategic alliances, architectural engineering and construction solutions (aecs) market forecast, partnerships, mergers and acquisitions, geographical expansion, and product/service launches, to enhance their presence in the industry.

4M SA Advanced Software - Key offerings include integrated solutions for design, simulation, and project lifecycle management, enhancing efficiency and collaboration across engineering disciplines.

The industry research and growth report includes detailed analyses of the competitive landscape of the market and information about key companies, including:

  • 4M SA Advanced Software
  • ACCA software Spa
  • ANSYS Inc.
  • Autodesk Inc.
  • Bentley Systems Inc.
  • Carlson Software Inc.
  • Chetu Inc.
  • CYPE Ingenieros
  • Dassault Systemes SE
  • Esri Global Inc.
  • Hexagon AB
  • Nemetschek SE
  • Newforma Inc.
  • Oracle Corp.
  • Procore Technologies Inc.
  • Schneider Electric SE
  • Trimble Inc.
  • Vee Technologies Pvt. Ltd.

Qualitative and quantitative analysis of companies has been conducted to help clients understand the wider business environment as well as the strengths and weaknesses of key industry players. Data is qualitatively analyzed to categorize companies as pure play, category-focused, industry-focused, and diversified; it is quantitatively analyzed to categorize companies as dominant, leading, strong, tentative, and weak.

Recent Development and News in Architectural engineering and construction solutions (aecs) market

  • In September, 2024, Oracle Corp. announced a strategic partnership with a global telecommunications provider to deploy private cellular networks on major construction sites, ensuring high-speed data synchronization for its Smart Construction Platform.
  • In February, 2025, the Port of Rotterdam announced the completion of its full digital twin integration, using advanced AECS software to manage its extensive maritime and land-based infrastructure in real time.
  • In March, 2025, the Chinese Ministry of Housing and Urban-Rural Development launched the AECS 5.0 initiative, which aims to integrate artificial intelligence and big data into the planning and construction of all future smart city projects.
  • In April, 2025, Autodesk Inc. introduced a significant update to its cloud-based collaboration environment, which integrated enhanced artificial intelligence capabilities to automate the detection of design conflicts in complex structural models.

Dive into Technavio’s robust research methodology, blending expert interviews, extensive data synthesis, and validated models for unparalleled Architectural Engineering And Construction Solutions (AECS) Market insights. See full methodology.

Market Scope
Page number 307
Base year 2025
Historic period 2020-2024
Forecast period 2026-2030
Growth momentum & CAGR Accelerate at a CAGR of 15.2%
Market growth 2026-2030 USD 13820.6 million
Market structure Fragmented
YoY growth 2025-2026(%) 13.4%
Key countries US, Canada, Mexico, UK, Germany, France, Italy, Spain, The Netherlands, China, Japan, India, South Korea, Australia, Indonesia, Brazil, Argentina, Chile, Saudi Arabia, UAE, South Africa, Israel and Turkey
Competitive landscape Leading Companies, Market Positioning of Companies, Competitive Strategies, and Industry Risks

Request Free Sample

Research Analyst Overview

  • The architectural engineering and construction solutions market is defined by its rapid digital evolution, where building information modeling and project lifecycle management are becoming standard practice. This transition is driven by the need for enhanced productivity and sustainability through data-centric decision-making.
  • Key technologies include generative design tools, which automate the creation of complex structural schematics, and a digital twin framework for real-time structural health monitoring. The integration of a cloud-based collaboration environment enables seamless workflows across global teams, supported by reality capture technologies and augmented reality inspections for on-site verification.
  • The emphasis on sustainability is evident in the adoption of life-cycle assessment modules for embodied carbon calculation and energy efficiency simulation. Firms are leveraging 5D BIM cost estimation, predictive maintenance algorithms, and structural analysis software to optimize project outcomes. However, interoperability standards like OpenBIM are still gaining traction.
  • The shift toward a circular economy model is supported by advanced tools for modular construction and tracking prefabricated components.
  • Boardroom decisions are increasingly focused on navigating this digital shift, as a notable 60% of firms cite the lack of qualified specialists as the primary barrier to adopting advanced automation tools, impacting strategic investment in technologies like autonomous construction and cognitive city operating systems.

What are the Key Data Covered in this Architectural Engineering And Construction Solutions (AECS) Market Research and Growth Report?

  • What is the expected growth of the Architectural Engineering And Construction Solutions (AECS) Market between 2026 and 2030?

    • USD 13.82 billion, at a CAGR of 15.2%

  • What segmentation does the market report cover?

    • The report is segmented by Product (Software, and Services), Deployment (On-premises, and Cloud-based), Sector (Large enterprises, and SMEs), End-user (Construction and architecture, Education, and Others) and Geography (North America, Europe, APAC, South America, Middle East and Africa)

  • Which regions are analyzed in the report?

    • North America, Europe, APAC, South America and Middle East and Africa

  • What are the key growth drivers and market challenges?

    • Integration of building information modeling and generative design, Fragmentation and interoperability hurdles in global AECS adoption

  • Who are the major players in the Architectural Engineering And Construction Solutions (AECS) Market?

    • 4M SA Advanced Software, ACCA software Spa, ANSYS Inc., Autodesk Inc., Bentley Systems Inc., Carlson Software Inc., Chetu Inc., CYPE Ingenieros, Dassault Systemes SE, Esri Global Inc., Hexagon AB, Nemetschek SE, Newforma Inc., Oracle Corp., Procore Technologies Inc., Schneider Electric SE, Trimble Inc. and Vee Technologies Pvt. Ltd.

Market Research Insights

  • The architectural engineering and construction solutions market is shaped by a dynamic interplay of technological adoption and regulatory pressure. The implementation of a sustainable infrastructure mandate and the push for green building certifications are compelling firms to adopt advanced tools for carbon footprint calculation and to pursue net-zero objectives.
  • A proactive urban planning approach, supported by digital-first redevelopment strategies, leverages these tools for the modernization of aging infrastructure. This digital transformation division is critical, with firms implementing a smart construction platform to manage projects. Data sovereignty and robust cybersecurity protocols are paramount in this shift.
  • However, a significant technical skills gap and the need for high-performance computing present challenges, even as subscription-based models improve accessibility. The adoption of these technologies results in tangible benefits, with integrated project delivery models reducing coordination errors by over 25% and data-centric approaches improving resource allocation accuracy by 18%, creating a single source of truth for all stakeholders.

We can help! Our analysts can customize this architectural engineering and construction solutions (aecs) market research report to meet your requirements.

Get in touch

1. Executive Summary

1.1 Market overview

Executive Summary - Chart on Market Overview
Executive Summary - Data Table on Market Overview
Executive Summary - Chart on Global Market Characteristics
Executive Summary - Chart on Market by Geography
Executive Summary - Chart on Market Segmentation by Product
Executive Summary - Chart on Market Segmentation by Deployment
Executive Summary - Chart on Market Segmentation by Sector
Executive Summary - Chart on Market Segmentation by End-user
Executive Summary - Chart on Incremental Growth
Executive Summary - Data Table on Incremental Growth
Executive Summary - Chart on Company Market Positioning

2. Technavio Analysis

2.1 Analysis of price sensitivity, lifecycle, customer purchase basket, adoption rates, and purchase criteria

2.2 Criticality of inputs and Factors of differentiation

Chart on Overview on criticality of inputs and factors of differentiation

2.3 Factors of disruption

Chart on Overview on factors of disruption

2.4 Impact of drivers and challenges

Chart on Impact of drivers and challenges in 2025 and 2030

3. Market Landscape

3.1 Market ecosystem

Chart on Parent Market
Data Table on - Parent Market

3.2 Market characteristics

Chart on Market characteristics analysis

3.3 Value chain analysis

Chart on Value chain analysis

4. Market Sizing

4.1 Market definition

Data Table on Offerings of companies included in the market definition

4.2 Market segment analysis

Market segments

4.3 Market size 2025

4.4 Market outlook: Forecast for 2025-2030

Chart on Global - Market size and forecast 2025-2030 ($ million)
Data Table on Global - Market size and forecast 2025-2030 ($ million)
Chart on Global Market: Year-over-year growth 2025-2030 (%)
Data Table on Global Market: Year-over-year growth 2025-2030 (%)

5. Historic Market Size

5.1 Global Architectural Engineering And Construction Solutions (AECS) Market 2020 - 2024

Historic Market Size - Data Table on Global Architectural Engineering And Construction Solutions (AECS) Market 2020 - 2024 ($ million)

5.2 Product segment analysis 2020 - 2024

Historic Market Size - Product Segment 2020 - 2024 ($ million)

5.3 Deployment segment analysis 2020 - 2024

Historic Market Size - Deployment Segment 2020 - 2024 ($ million)

5.4 Sector segment analysis 2020 - 2024

Historic Market Size - Sector Segment 2020 - 2024 ($ million)

5.5 End-user segment analysis 2020 - 2024

Historic Market Size - End-user Segment 2020 - 2024 ($ million)

5.6 Geography segment analysis 2020 - 2024

Historic Market Size - Geography Segment 2020 - 2024 ($ million)

5.7 Country segment analysis 2020 - 2024

Historic Market Size - Country Segment 2020 - 2024 ($ million)

6. Qualitative Analysis

6.1 Impact of AI in global architectural engineering and construction solutions (AECS) market

7. Five Forces Analysis

7.1 Five forces summary

Five forces analysis - Comparison between 2025 and 2030

7.2 Bargaining power of buyers

Bargaining power of buyers - Impact of key factors 2025 and 2030

7.3 Bargaining power of suppliers

Bargaining power of suppliers - Impact of key factors in 2025 and 2030

7.4 Threat of new entrants

Threat of new entrants - Impact of key factors in 2025 and 2030

7.5 Threat of substitutes

Threat of substitutes - Impact of key factors in 2025 and 2030

7.6 Threat of rivalry

Threat of rivalry - Impact of key factors in 2025 and 2030

7.7 Market condition

Chart on Market condition - Five forces 2025 and 2030

8. Market Segmentation by Product

8.1 Market segments

Chart on Product - Market share 2025-2030 (%)
Data Table on Product - Market share 2025-2030 (%)

8.2 Comparison by Product

Chart on Comparison by Product
Data Table on Comparison by Product

8.3 Software - Market size and forecast 2025-2030

Chart on Software - Market size and forecast 2025-2030 ($ million)
Data Table on Software - Market size and forecast 2025-2030 ($ million)
Chart on Software - Year-over-year growth 2025-2030 (%)
Data Table on Software - Year-over-year growth 2025-2030 (%)

8.4 Services - Market size and forecast 2025-2030

Chart on Services - Market size and forecast 2025-2030 ($ million)
Data Table on Services - Market size and forecast 2025-2030 ($ million)
Chart on Services - Year-over-year growth 2025-2030 (%)
Data Table on Services - Year-over-year growth 2025-2030 (%)

8.5 Market opportunity by Product

Market opportunity by Product ($ million)
Data Table on Market opportunity by Product ($ million)

9. Market Segmentation by Deployment

9.1 Market segments

Chart on Deployment - Market share 2025-2030 (%)
Data Table on Deployment - Market share 2025-2030 (%)

9.2 Comparison by Deployment

Chart on Comparison by Deployment
Data Table on Comparison by Deployment

9.3 On-premises - Market size and forecast 2025-2030

Chart on On-premises - Market size and forecast 2025-2030 ($ million)
Data Table on On-premises - Market size and forecast 2025-2030 ($ million)
Chart on On-premises - Year-over-year growth 2025-2030 (%)
Data Table on On-premises - Year-over-year growth 2025-2030 (%)

9.4 Cloud-based - Market size and forecast 2025-2030

Chart on Cloud-based - Market size and forecast 2025-2030 ($ million)
Data Table on Cloud-based - Market size and forecast 2025-2030 ($ million)
Chart on Cloud-based - Year-over-year growth 2025-2030 (%)
Data Table on Cloud-based - Year-over-year growth 2025-2030 (%)

9.5 Market opportunity by Deployment

Market opportunity by Deployment ($ million)
Data Table on Market opportunity by Deployment ($ million)

10. Market Segmentation by Sector

10.1 Market segments

Chart on Sector - Market share 2025-2030 (%)
Data Table on Sector - Market share 2025-2030 (%)

10.2 Comparison by Sector

Chart on Comparison by Sector
Data Table on Comparison by Sector

10.3 Large enterprises - Market size and forecast 2025-2030

Chart on Large enterprises - Market size and forecast 2025-2030 ($ million)
Data Table on Large enterprises - Market size and forecast 2025-2030 ($ million)
Chart on Large enterprises - Year-over-year growth 2025-2030 (%)
Data Table on Large enterprises - Year-over-year growth 2025-2030 (%)

10.4 SMEs - Market size and forecast 2025-2030

Chart on SMEs - Market size and forecast 2025-2030 ($ million)
Data Table on SMEs - Market size and forecast 2025-2030 ($ million)
Chart on SMEs - Year-over-year growth 2025-2030 (%)
Data Table on SMEs - Year-over-year growth 2025-2030 (%)

10.5 Market opportunity by Sector

Market opportunity by Sector ($ million)
Data Table on Market opportunity by Sector ($ million)

11. Market Segmentation by End-user

11.1 Market segments

Chart on End-user - Market share 2025-2030 (%)
Data Table on End-user - Market share 2025-2030 (%)

11.2 Comparison by End-user

Chart on Comparison by End-user
Data Table on Comparison by End-user

11.3 Construction and architecture - Market size and forecast 2025-2030

Chart on Construction and architecture - Market size and forecast 2025-2030 ($ million)
Data Table on Construction and architecture - Market size and forecast 2025-2030 ($ million)
Chart on Construction and architecture - Year-over-year growth 2025-2030 (%)
Data Table on Construction and architecture - Year-over-year growth 2025-2030 (%)

11.4 Education - Market size and forecast 2025-2030

Chart on Education - Market size and forecast 2025-2030 ($ million)
Data Table on Education - Market size and forecast 2025-2030 ($ million)
Chart on Education - Year-over-year growth 2025-2030 (%)
Data Table on Education - Year-over-year growth 2025-2030 (%)

11.5 Others - Market size and forecast 2025-2030

Chart on Others - Market size and forecast 2025-2030 ($ million)
Data Table on Others - Market size and forecast 2025-2030 ($ million)
Chart on Others - Year-over-year growth 2025-2030 (%)
Data Table on Others - Year-over-year growth 2025-2030 (%)

11.6 Market opportunity by End-user

Market opportunity by End-user ($ million)
Data Table on Market opportunity by End-user ($ million)

12. Customer Landscape

12.1 Customer landscape overview

Analysis of price sensitivity, lifecycle, customer purchase basket, adoption rates, and purchase criteria

13. Geographic Landscape

13.1 Geographic segmentation

Chart on Market share by geography 2025-2030 (%)
Data Table on Market share by geography 2025-2030 (%)

13.2 Geographic comparison

Chart on Geographic comparison
Data Table on Geographic comparison

13.3 North America - Market size and forecast 2025-2030

Chart on North America - Market size and forecast 2025-2030 ($ million)
Data Table on North America - Market size and forecast 2025-2030 ($ million)
Chart on North America - Year-over-year growth 2025-2030 (%)
Data Table on North America - Year-over-year growth 2025-2030 (%)
Chart on Regional Comparison - North America
Data Table on Regional Comparison - North America

13.3.1 US - Market size and forecast 2025-2030

Chart on US - Market size and forecast 2025-2030 ($ million)
Data Table on US - Market size and forecast 2025-2030 ($ million)
Chart on US - Year-over-year growth 2025-2030 (%)
Data Table on US - Year-over-year growth 2025-2030 (%)

13.3.2 Canada - Market size and forecast 2025-2030

Chart on Canada - Market size and forecast 2025-2030 ($ million)
Data Table on Canada - Market size and forecast 2025-2030 ($ million)
Chart on Canada - Year-over-year growth 2025-2030 (%)
Data Table on Canada - Year-over-year growth 2025-2030 (%)

13.3.3 Mexico - Market size and forecast 2025-2030

Chart on Mexico - Market size and forecast 2025-2030 ($ million)
Data Table on Mexico - Market size and forecast 2025-2030 ($ million)
Chart on Mexico - Year-over-year growth 2025-2030 (%)
Data Table on Mexico - Year-over-year growth 2025-2030 (%)

13.4 Europe - Market size and forecast 2025-2030

Chart on Europe - Market size and forecast 2025-2030 ($ million)
Data Table on Europe - Market size and forecast 2025-2030 ($ million)
Chart on Europe - Year-over-year growth 2025-2030 (%)
Data Table on Europe - Year-over-year growth 2025-2030 (%)
Chart on Regional Comparison - Europe
Data Table on Regional Comparison - Europe

13.4.1 UK - Market size and forecast 2025-2030

Chart on UK - Market size and forecast 2025-2030 ($ million)
Data Table on UK - Market size and forecast 2025-2030 ($ million)
Chart on UK - Year-over-year growth 2025-2030 (%)
Data Table on UK - Year-over-year growth 2025-2030 (%)

13.4.2 Germany - Market size and forecast 2025-2030

Chart on Germany - Market size and forecast 2025-2030 ($ million)
Data Table on Germany - Market size and forecast 2025-2030 ($ million)
Chart on Germany - Year-over-year growth 2025-2030 (%)
Data Table on Germany - Year-over-year growth 2025-2030 (%)

13.4.3 France - Market size and forecast 2025-2030

Chart on France - Market size and forecast 2025-2030 ($ million)
Data Table on France - Market size and forecast 2025-2030 ($ million)
Chart on France - Year-over-year growth 2025-2030 (%)
Data Table on France - Year-over-year growth 2025-2030 (%)

13.4.4 Italy - Market size and forecast 2025-2030

Chart on Italy - Market size and forecast 2025-2030 ($ million)
Data Table on Italy - Market size and forecast 2025-2030 ($ million)
Chart on Italy - Year-over-year growth 2025-2030 (%)
Data Table on Italy - Year-over-year growth 2025-2030 (%)

13.4.5 Spain - Market size and forecast 2025-2030

Chart on Spain - Market size and forecast 2025-2030 ($ million)
Data Table on Spain - Market size and forecast 2025-2030 ($ million)
Chart on Spain - Year-over-year growth 2025-2030 (%)
Data Table on Spain - Year-over-year growth 2025-2030 (%)

13.4.6 The Netherlands - Market size and forecast 2025-2030

Chart on The Netherlands - Market size and forecast 2025-2030 ($ million)
Data Table on The Netherlands - Market size and forecast 2025-2030 ($ million)
Chart on The Netherlands - Year-over-year growth 2025-2030 (%)
Data Table on The Netherlands - Year-over-year growth 2025-2030 (%)

13.5 APAC - Market size and forecast 2025-2030

Chart on APAC - Market size and forecast 2025-2030 ($ million)
Data Table on APAC - Market size and forecast 2025-2030 ($ million)
Chart on APAC - Year-over-year growth 2025-2030 (%)
Data Table on APAC - Year-over-year growth 2025-2030 (%)
Chart on Regional Comparison - APAC
Data Table on Regional Comparison - APAC

13.5.1 China - Market size and forecast 2025-2030

Chart on China - Market size and forecast 2025-2030 ($ million)
Data Table on China - Market size and forecast 2025-2030 ($ million)
Chart on China - Year-over-year growth 2025-2030 (%)
Data Table on China - Year-over-year growth 2025-2030 (%)

13.5.2 Japan - Market size and forecast 2025-2030

Chart on Japan - Market size and forecast 2025-2030 ($ million)
Data Table on Japan - Market size and forecast 2025-2030 ($ million)
Chart on Japan - Year-over-year growth 2025-2030 (%)
Data Table on Japan - Year-over-year growth 2025-2030 (%)

13.5.3 India - Market size and forecast 2025-2030

Chart on India - Market size and forecast 2025-2030 ($ million)
Data Table on India - Market size and forecast 2025-2030 ($ million)
Chart on India - Year-over-year growth 2025-2030 (%)
Data Table on India - Year-over-year growth 2025-2030 (%)

13.5.4 South Korea - Market size and forecast 2025-2030

Chart on South Korea - Market size and forecast 2025-2030 ($ million)
Data Table on South Korea - Market size and forecast 2025-2030 ($ million)
Chart on South Korea - Year-over-year growth 2025-2030 (%)
Data Table on South Korea - Year-over-year growth 2025-2030 (%)

13.5.5 Australia - Market size and forecast 2025-2030

Chart on Australia - Market size and forecast 2025-2030 ($ million)
Data Table on Australia - Market size and forecast 2025-2030 ($ million)
Chart on Australia - Year-over-year growth 2025-2030 (%)
Data Table on Australia - Year-over-year growth 2025-2030 (%)

13.5.6 Indonesia - Market size and forecast 2025-2030

Chart on Indonesia - Market size and forecast 2025-2030 ($ million)
Data Table on Indonesia - Market size and forecast 2025-2030 ($ million)
Chart on Indonesia - Year-over-year growth 2025-2030 (%)
Data Table on Indonesia - Year-over-year growth 2025-2030 (%)

13.6 South America - Market size and forecast 2025-2030

Chart on South America - Market size and forecast 2025-2030 ($ million)
Data Table on South America - Market size and forecast 2025-2030 ($ million)
Chart on South America - Year-over-year growth 2025-2030 (%)
Data Table on South America - Year-over-year growth 2025-2030 (%)
Chart on Regional Comparison - South America
Data Table on Regional Comparison - South America

13.6.1 Brazil - Market size and forecast 2025-2030

Chart on Brazil - Market size and forecast 2025-2030 ($ million)
Data Table on Brazil - Market size and forecast 2025-2030 ($ million)
Chart on Brazil - Year-over-year growth 2025-2030 (%)
Data Table on Brazil - Year-over-year growth 2025-2030 (%)

13.6.2 Argentina - Market size and forecast 2025-2030

Chart on Argentina - Market size and forecast 2025-2030 ($ million)
Data Table on Argentina - Market size and forecast 2025-2030 ($ million)
Chart on Argentina - Year-over-year growth 2025-2030 (%)
Data Table on Argentina - Year-over-year growth 2025-2030 (%)

13.6.3 Chile - Market size and forecast 2025-2030

Chart on Chile - Market size and forecast 2025-2030 ($ million)
Data Table on Chile - Market size and forecast 2025-2030 ($ million)
Chart on Chile - Year-over-year growth 2025-2030 (%)
Data Table on Chile - Year-over-year growth 2025-2030 (%)

13.7 Middle East and Africa - Market size and forecast 2025-2030

Chart on Middle East and Africa - Market size and forecast 2025-2030 ($ million)
Data Table on Middle East and Africa - Market size and forecast 2025-2030 ($ million)
Chart on Middle East and Africa - Year-over-year growth 2025-2030 (%)
Data Table on Middle East and Africa - Year-over-year growth 2025-2030 (%)
Chart on Regional Comparison - Middle East and Africa
Data Table on Regional Comparison - Middle East and Africa

13.7.1 Saudi Arabia - Market size and forecast 2025-2030

Chart on Saudi Arabia - Market size and forecast 2025-2030 ($ million)
Data Table on Saudi Arabia - Market size and forecast 2025-2030 ($ million)
Chart on Saudi Arabia - Year-over-year growth 2025-2030 (%)
Data Table on Saudi Arabia - Year-over-year growth 2025-2030 (%)

13.7.2 UAE - Market size and forecast 2025-2030

Chart on UAE - Market size and forecast 2025-2030 ($ million)
Data Table on UAE - Market size and forecast 2025-2030 ($ million)
Chart on UAE - Year-over-year growth 2025-2030 (%)
Data Table on UAE - Year-over-year growth 2025-2030 (%)

13.7.3 South Africa - Market size and forecast 2025-2030

Chart on South Africa - Market size and forecast 2025-2030 ($ million)
Data Table on South Africa - Market size and forecast 2025-2030 ($ million)
Chart on South Africa - Year-over-year growth 2025-2030 (%)
Data Table on South Africa - Year-over-year growth 2025-2030 (%)

13.7.4 Israel - Market size and forecast 2025-2030

Chart on Israel - Market size and forecast 2025-2030 ($ million)
Data Table on Israel - Market size and forecast 2025-2030 ($ million)
Chart on Israel - Year-over-year growth 2025-2030 (%)
Data Table on Israel - Year-over-year growth 2025-2030 (%)

13.7.5 Turkey - Market size and forecast 2025-2030

Chart on Turkey - Market size and forecast 2025-2030 ($ million)
Data Table on Turkey - Market size and forecast 2025-2030 ($ million)
Chart on Turkey - Year-over-year growth 2025-2030 (%)
Data Table on Turkey - Year-over-year growth 2025-2030 (%)

13.8 Market opportunity by geography

Market opportunity by geography ($ million)
Data Tables on Market opportunity by geography ($ million)

14. Drivers, Challenges, and Opportunity

14.1 Market drivers

Integration of building information modeling and generative design
Stringent regulations regarding carbon neutrality and sustainable
Accelerated urbanization and development of smart city infrastructure

14.2 Market challenges

Fragmentation and interoperability hurdles in global AECS adoption
High capital expenditure and critical technical skills gap
Escalating cybersecurity threats to intellectual property and data

14.3 Impact of drivers and challenges

Impact of drivers and challenges in 2025 and 2030

14.4 Market opportunities

Proliferation of generative AI in design automation
Enhanced tracking and circular economy in digital building passports
Integration of real-time IOT data with infrastructure digital twins

15. Competitive Landscape

15.1 Overview

15.2

Overview on criticality of inputs and factors of differentiation

15.3 Landscape disruption

Overview on factors of disruption

15.4 Industry risks

Impact of key risks on business

16. Competitive Analysis

16.1 Companies profiled

Companies covered

16.2 Company ranking index

16.3 Market positioning of companies

Matrix on companies position and classification

16.4 ANSYS Inc.

ANSYS Inc. - Overview
ANSYS Inc. - Business segments
ANSYS Inc. - Key news
ANSYS Inc. - Key offerings
ANSYS Inc. - Segment focus
SWOT

16.5 Autodesk Inc.

Autodesk Inc. - Overview
Autodesk Inc. - Business segments
Autodesk Inc. - Key news
Autodesk Inc. - Key offerings
Autodesk Inc. - Segment focus
SWOT

16.6 Bentley Systems Inc.

Bentley Systems Inc. - Overview
Bentley Systems Inc. - Business segments
Bentley Systems Inc. - Key news
Bentley Systems Inc. - Key offerings
Bentley Systems Inc. - Segment focus
SWOT

16.7 Carlson Software Inc.

Carlson Software Inc. - Overview
Carlson Software Inc. - Product / Service
Carlson Software Inc. - Key offerings
SWOT

16.8 Chetu Inc.

Chetu Inc. - Overview
Chetu Inc. - Product / Service
Chetu Inc. - Key offerings
SWOT

16.9 CYPE Ingenieros

CYPE Ingenieros - Overview
CYPE Ingenieros - Product / Service
CYPE Ingenieros - Key offerings
SWOT

16.10 Dassault Systemes SE

Dassault Systemes SE - Overview
Dassault Systemes SE - Business segments
Dassault Systemes SE - Key news
Dassault Systemes SE - Key offerings
Dassault Systemes SE - Segment focus
SWOT

16.11 Esri Global Inc.

Esri Global Inc. - Overview
Esri Global Inc. - Product / Service
Esri Global Inc. - Key offerings
SWOT

16.12 Hexagon AB

Hexagon AB - Overview
Hexagon AB - Business segments
Hexagon AB - Key news
Hexagon AB - Key offerings
Hexagon AB - Segment focus
SWOT

16.13 Nemetschek SE

Nemetschek SE - Overview
Nemetschek SE - Business segments
Nemetschek SE - Key news
Nemetschek SE - Key offerings
Nemetschek SE - Segment focus
SWOT

16.14 Newforma Inc.

Newforma Inc. - Overview
Newforma Inc. - Product / Service
Newforma Inc. - Key offerings
SWOT

16.15 Oracle Corp.

Oracle Corp. - Overview
Oracle Corp. - Business segments
Oracle Corp. - Key news
Oracle Corp. - Key offerings
Oracle Corp. - Segment focus
SWOT

16.16 Procore Technologies Inc.

Procore Technologies Inc. - Overview
Procore Technologies Inc. - Product / Service
Procore Technologies Inc. - Key offerings
SWOT

16.17 Schneider Electric SE

Schneider Electric SE - Overview
Schneider Electric SE - Business segments
Schneider Electric SE - Key news
Schneider Electric SE - Key offerings
Schneider Electric SE - Segment focus
SWOT

16.18 Trimble Inc.

Trimble Inc. - Overview
Trimble Inc. - Business segments
Trimble Inc. - Key news
Trimble Inc. - Key offerings
Trimble Inc. - Segment focus
SWOT

17. Appendix

17.1 Scope of the report

Market definition
Objectives
Notes and caveats

17.2 Inclusions and exclusions checklist

Inclusions checklist
Exclusions checklist

17.3 Currency conversion rates for US$

17.4 Research methodology

17.5 Data procurement

Information sources

17.6 Data validation

17.7 Validation techniques employed for market sizing

17.8 Data synthesis

17.9 360 degree market analysis

17.10 List of abbreviations

Research Methodology

Technavio presents a detailed picture of the market by way of study, synthesis, and summation of data from multiple sources. The analysts have presented the various facets of the market with a particular focus on identifying the key industry influencers. The data thus presented is comprehensive, reliable, and the result of extensive research, both primary and secondary.

INFORMATION SOURCES

Primary sources

  • Manufacturers and suppliers
  • Channel partners
  • Industry experts
  • Strategic decision makers

Secondary sources

  • Industry journals and periodicals
  • Government data
  • Financial reports of key industry players
  • Historical data
  • Press releases

DATA ANALYSIS

Data Synthesis

  • Collation of data
  • Estimation of key figures
  • Analysis of derived insights

Data Validation

  • Triangulation with data models
  • Reference against proprietary databases
  • Corroboration with industry experts

REPORT WRITING

Qualitative

  • Market drivers
  • Market challenges
  • Market trends
  • Five forces analysis

Quantitative

  • Market size and forecast
  • Market segmentation
  • Geographical insights
  • Competitive landscape

Interested in this report?

Get your sample now to see our research methodology and insights!

Download Now

Frequently Asked Questions

Architectural Engineering And Construction Solutions (AECS) market growth will increase by USD 13820.6 million during 2026-2030.

The Architectural Engineering And Construction Solutions (AECS) market is expected to grow at a CAGR of 15.2% during 2026-2030.

Architectural Engineering And Construction Solutions (AECS) market is segmented by Product (Software, Services) Deployment (On-premises, Cloud-based) Sector (Large enterprises, SMEs) End-user (Construction and architecture, Education, Others)

4M SA Advanced Software, ACCA software Spa, ANSYS Inc., Autodesk Inc., Bentley Systems Inc., Carlson Software Inc., Chetu Inc., CYPE Ingenieros, Dassault Systemes SE, Esri Global Inc., Hexagon AB, Nemetschek SE, Newforma Inc., Oracle Corp., Procore Technologies Inc., Schneider Electric SE, Trimble Inc., Vee Technologies Pvt. Ltd. are a few of the key vendors in the Architectural Engineering And Construction Solutions (AECS) market.

North America will register the highest growth rate of 34.8% among the other regions. Therefore, the Architectural Engineering And Construction Solutions (AECS) market in North America is expected to garner significant business opportunities for the vendors during the forecast period.

US, Canada, Mexico, UK, Germany, France, Italy, Spain, The Netherlands, China, Japan, India, South Korea, Australia, Indonesia, Brazil, Argentina, Chile, Saudi Arabia, UAE, South Africa, Israel, Turkey

  • Integration of building information modeling and generative design is the driving factor this market.

The Architectural Engineering And Construction Solutions (AECS) market vendors should focus on grabbing business opportunities from the Product segment as it accounted for the largest market share in the base year.