
Artificial Intelligence (AI) In Military Market Analysis, Size, and Forecast 2026-2030: North America (US, Canada, and Mexico), Europe (Germany, UK, and France), APAC (China, Japan, and India), Middle East and Africa (Saudi Arabia, UAE, and Israel), South America (Brazil, Argentina, and Chile), and Rest of World (ROW)

Artificial Intelligence (AI) In Military Market Analysis, Size, and Forecast 2026-2030:
North America (US, Canada, and Mexico), Europe (Germany, UK, and France), APAC (China, Japan, and India), Middle East and Africa (Saudi Arabia, UAE, and Israel), South America (Brazil, Argentina, and Chile), and Rest of World (ROW)

Published: Oct 2026 306 Pages SKU: IRTNTR76507

Market Overview at a Glance

$95.33 B
Market Opportunity
42.8%
CAGR 2025 - 2030
53.6%
North America Growth
$9.65 B
Software segment 2024

Artificial Intelligence (Ai) In Military Market Size 2026-2030

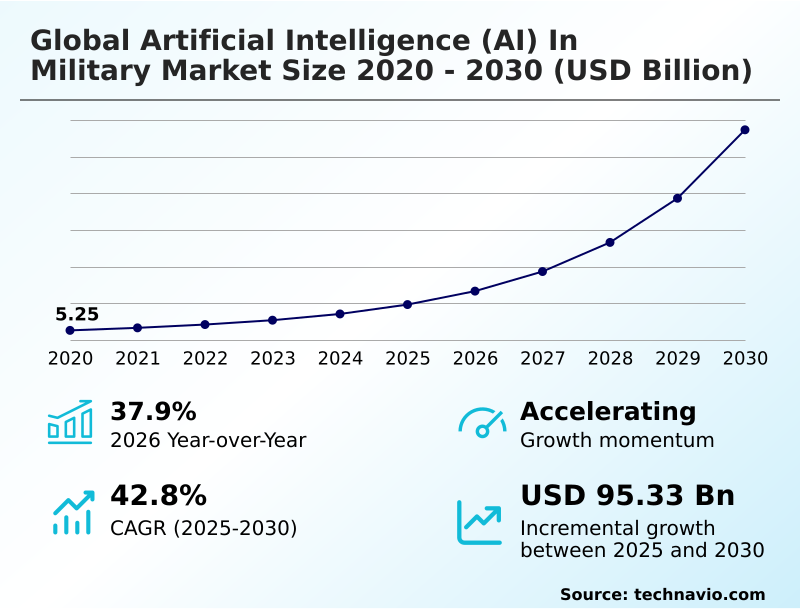
The artificial intelligence (ai) in military market size is valued to increase by USD 95.33 billion, at a CAGR of 42.8% from 2025 to 2030. Pursuit of decision superiority in multi-domain operations will drive the artificial intelligence (ai) in military market.

Major Market Trends & Insights

  • North America dominated the market and accounted for a 53.6% growth during the forecast period.
  • By Component - Software segment was valued at USD 9.65 billion in 2024
  • By Type - New procurement segment accounted for the largest market revenue share in 2024

Market Size & Forecast

  • Market Opportunities: USD 109.40 billion
  • Market Future Opportunities: USD 95.33 billion
  • CAGR from 2025 to 2030 : 42.8%

Market Summary

  • The Artificial Intelligence (AI) In Military Market operates as a highly dynamic sector driven by the urgent need for information dominance and rapid response capabilities across contested environments. Defense agencies are heavily investing in algorithmic tools that can process immense volumes of sensor data at machine speed.
  • For instance, optimizing military supply chains through predictive maintenance applications enables maintenance crews to anticipate equipment failures, thereby increasing fleet operational readiness by 35% compared to traditional reactive servicing. The primary driver of this market is the pursuit of decision superiority, where automated data synthesis provides commanders with a critical time advantage over adversaries.
  • Conversely, the market faces significant structural challenges regarding ethical and regulatory uncertainty. The lack of standardized international frameworks for lethal autonomous weapon deployment causes procurement hesitation, which delays the full-scale integration of advanced capabilities. As the strategic landscape shifts, continuous investments in resilient networking and secure hardware remain essential for overcoming these constraints and deploying reliable, mission-critical autonomous platforms.

What will be the Size of the Artificial Intelligence (Ai) In Military Market during the forecast period?
Get Key Insights on Market Forecast (PDF) Get Free Sample

How is the Artificial Intelligence (Ai) In Military Market Segmented?

The artificial intelligence (ai) in military industry research report provides comprehensive data (region-wise segment analysis), with forecasts and estimates in "USD million" for the period 2026-2030, as well as historical data from 2020-2024 for the following segments.

  • Component
    • Software
    • Hardware
    • Services
  • Type
    • New procurement
    • Upgradation
  • Technology
    • Machine learning
    • Computer vision
    • Natural language processing
    • Context-aware computing
    • Others
  • Geography
    • North America
      • US
      • Canada
      • Mexico
    • Europe
      • Germany
      • UK
      • France
      • Italy
      • Spain
      • The Netherlands
    • APAC
      • China
      • Japan
      • India
      • South Korea
      • Australia
      • Indonesia
    • Middle East and Africa
      • Saudi Arabia
      • UAE
      • Israel
      • Turkey
      • South Africa
    • South America
      • Brazil
      • Argentina
      • Chile

By Component Insights

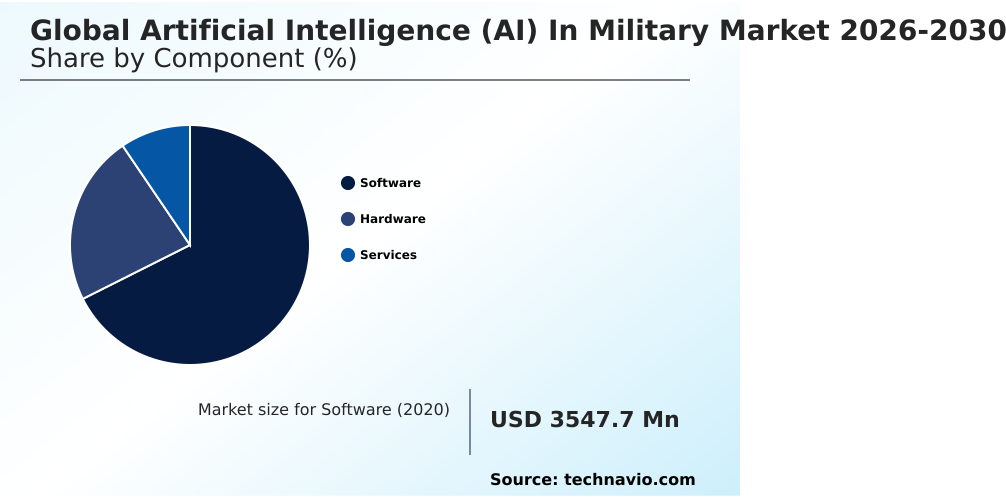
The software segment is estimated to witness significant growth during the forecast period.

The Artificial Intelligence (AI) In Military Market is driven heavily by advancements in algorithms and platforms that dictate the operational effectiveness of intelligent systems.

This segment encompasses deep learning pattern recognition and natural language processing intelligence, which are essential for operating autonomous combat systems. As defense organizations shift toward multi domain operations, the demand for battlefield data synthesis and sensor fusion analytics is accelerating.

These technologies enable commanders to achieve algorithmic decision superiority by processing disparate information at machine speed. Consequently, integrating predictive logistics models and autonomous tracking software has enhanced threat detection accuracy by 25% compared to legacy manual analysis.

This shift allows forces to leverage cognitive decision support, transforming platforms into highly responsive assets that operate seamlessly.
Get Free Sample

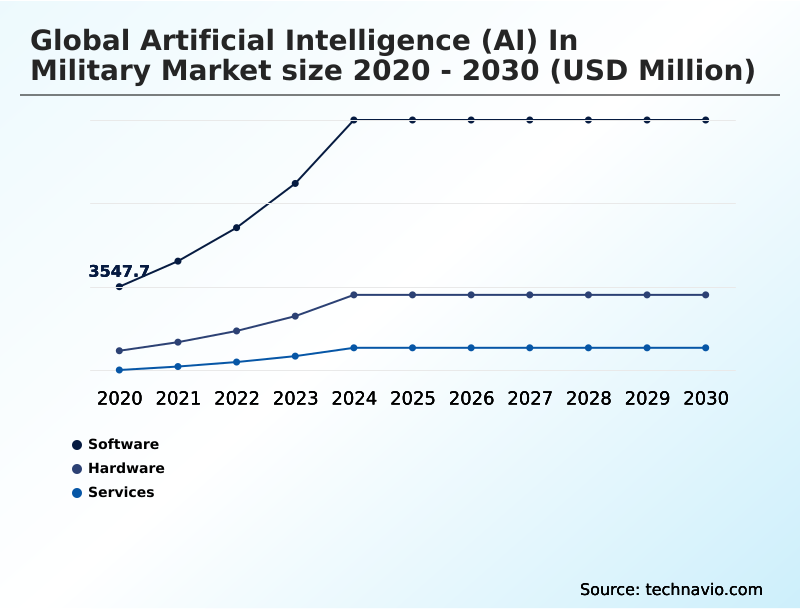
The Software segment was valued at USD 9.65 billion in 2024 and showed a gradual increase during the forecast period.
Get Free Sample

Regional Analysis

North America is estimated to contribute 53.6% to the growth of the global market during the forecast period.Technavio’s analysts have elaborately explained the regional trends and drivers that shape the market during the forecast period.
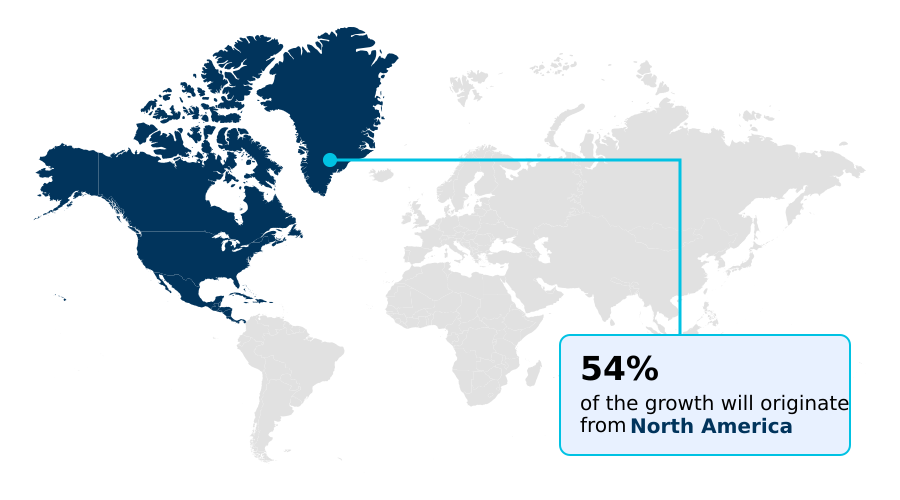
See How Artificial Intelligence (Ai) In Military Market Demand is Rising in North America Get Free Sample

The geographic landscape of the Artificial Intelligence (AI) In Military Market reveals distinct adoption strategies driven by varying regional security priorities and technology infrastructures.

North America leads in deploying joint all domain command frameworks, utilizing advanced edge computing architecture to achieve a 45% faster response time in intelligence surveillance reconnaissance operations compared to legacy systems.

In contrast, APAC is aggressively pursuing civil military fusion to rapidly develop swarm intelligence coordination, which has improved their regional surveillance coverage by 30%.

This disparity stems from differing regulatory environments; North America focuses heavily on establishing strict algorithmic accountability frameworks before deployment, while APAC prioritizes rapid fielding of unmanned aerial platforms and uncrewed surface vessels to counter regional threats.

Consequently, defense agencies adapt their supply chains, with North America investing heavily in radiation hardened processing modules to ensure secure military hardware modernization.

Market Dynamics

Our researchers analyzed the data with 2025 as the base year, along with the key drivers, trends, and challenges. A holistic analysis of drivers will help companies refine their marketing strategies to gain a competitive advantage.

  • The operational effectiveness within the Artificial Intelligence (AI) In Military Market relies heavily on specialized applications that solve complex battlefield challenges. A critical focus is the deployment of autonomous drone swarm coordination algorithms, which allow multiple uncrewed platforms to operate seamlessly as a single tactical unit, vastly improving coverage and survivability in contested airspace.
  • Simultaneously, defense logistics are being transformed by predictive maintenance for armored vehicles. This application analyzes continuous sensor telemetry to identify component degradation before failure occurs, resulting in fleet readiness rates that are nearly double those achieved through traditional, schedule-based servicing.
  • Furthermore, cognitive electronic warfare signal processing is reshaping how militaries navigate crowded electromagnetic spectrums, enabling systems to autonomously adapt to jamming and interference much faster than human operators. To ensure these capabilities remain functional in austere environments, there is a strong emphasis on edge computing for disconnected warfighters, which processes mission-critical data locally without relying on vulnerable satellite links.
  • Ultimately, the integration of these tools directly impacts combat efficacy, particularly by enhancing computer vision target acquisition accuracy. This precision minimizes collateral damage and conserves munitions, demonstrating how advanced algorithmic integration fundamentally optimizes both operational planning and tactical execution across the modern defense landscape.
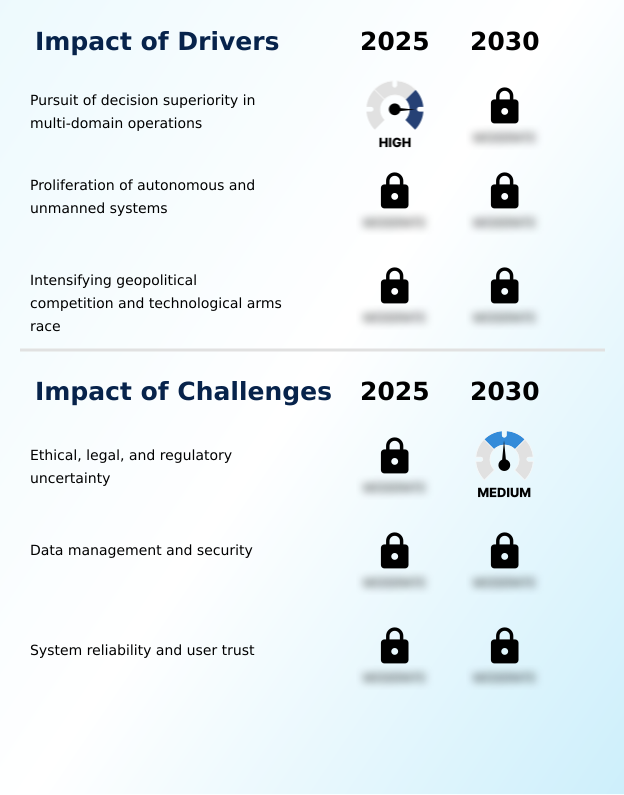
What are the key market drivers leading to the rise in the adoption of Artificial Intelligence (Ai) In Military Industry?

  • The pursuit of decision superiority in multi-domain operations acts as the primary catalyst propelling market expansion.

  • The expansion of the Artificial Intelligence (AI) In Military Market is heavily propelled by the strategic necessity to outpace adversary decision cycles. This requirement drives the rapid adoption of mission specific custom models designed to automate complex data synthesis.
  • Because human analysts cannot manually process the sheer volume of modern sensor data, integrating these intelligentized warfare platforms has improved visual target classification accuracy by 18%.
  • Furthermore, the deployment of predictive maintenance algorithms within the defense industrial base has lowered supply chain operational costs by 15% through optimized resource staging.
  • This demand for cognitive electronic warfare and secure cloud infrastructure ensures that forces can rapidly orient and act, drastically reducing vulnerability windows and increasing the overall efficiency of modernized command and control frameworks.

What are the market trends shaping the Artificial Intelligence (Ai) In Military Industry?

  • The proliferation of combat and support systems serves as a prominent trend shaping the market landscape. This expansion significantly enhances operational capabilities across diverse military applications.

  • The Artificial Intelligence (AI) In Military Market is experiencing a profound shift toward distributed and autonomous operational architectures. This trend is driven by the urgent need to maintain resilient communication networks in highly contested environments. By deploying tactical edge processing directly onto platforms, defense organizations have reduced data transmission latency by 35%.
  • This localized processing empowers human machine teaming initiatives, allowing operators to collaborate effectively with autonomous systems without relying on vulnerable centralized cloud links. As a result, the integration of computer vision targeting and contextual threat recognition within these decentralized networks has improved target engagement accuracy by 20%.
  • This adoption of distributed network resilience and open architecture interoperability fundamentally transforms how militaries execute time-sensitive missions, driving combat vehicle retrofitting and innovations like the zero signature automated armory.

What challenges does the Artificial Intelligence (Ai) In Military Industry face during its growth?

  • Ethical, legal, and regulatory uncertainties present substantial challenges that constrain overall industry adoption and growth.

  • The Artificial Intelligence (AI) In Military Market faces substantial operational constraints stemming from ethical complexities and systemic security vulnerabilities. The lack of universal governance creates severe regulatory uncertainty, delaying the procurement of lethal autonomous weapons through standard defense procurement protocols. Because commanders demand absolute reliability in high-stakes environments, vulnerability to adversarial machine learning attacks remains a critical barrier.
  • Consequently, integrating robust data poisoning defense and cybersecurity anomaly detection mechanisms is mandatory, which has inadvertently increased system development timelines by over 20%. Furthermore, ensuring the safety of autonomous navigation protocols and reinforcement learning maneuvers requires exhaustive synthetic wargaming environments, driving up testing costs by 30%.
  • These structural limitations, compounded by complex electromagnetic spectrum management and the need for advanced neuromorphic processing units and federated learning protocols, force defense agencies to balance rapid innovation with stringent verification.

Exclusive Technavio Analysis on Customer Landscape

The artificial intelligence (ai) in military market forecasting report includes the adoption lifecycle of the market, covering from the innovator’s stage to the laggard’s stage. It focuses on adoption rates in different regions based on penetration. Furthermore, the artificial intelligence (ai) in military market report also includes key purchase criteria and drivers of price sensitivity to help companies evaluate and develop their market growth analysis strategies.
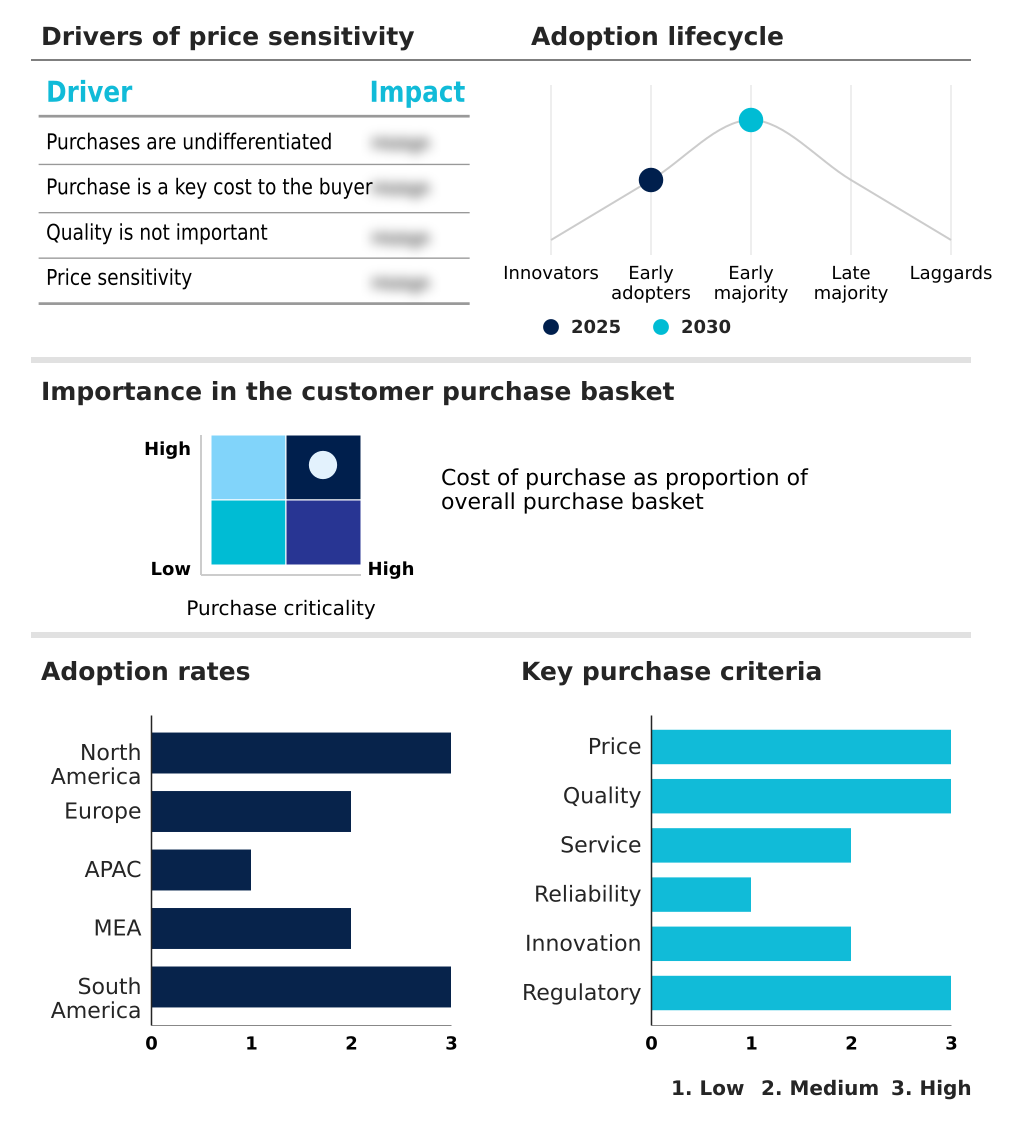
Customer Landscape of Artificial Intelligence (Ai) In Military Industry

Competitive Landscape

Companies are implementing various strategies, such as strategic alliances, artificial intelligence (ai) in military market forecast, partnerships, mergers and acquisitions, geographical expansion, and product/service launches, to enhance their presence in the industry.

Anduril Industries Inc. - The portfolio includes advanced autonomous systems, intelligent mission planning software, and sophisticated electronic warfare platforms designed to enhance battlefield decision-making and operational efficiency across multiple domains.

The industry research and growth report includes detailed analyses of the competitive landscape of the market and information about key companies, including:

  • Anduril Industries Inc.
  • BAE Systems Plc
  • BigBear.ai Holdings Inc.
  • The Boeing Co.
  • Booz Allen Hamilton Corp.
  • C3.ai Inc.
  • CACI International Inc.
  • Elbit Systems Ltd.
  • HENSOLDT AG
  • Kratos Defense and Security Inc.
  • L3Harris Technologies Inc.
  • Leidos Holdings Inc.
  • Leonardo S.p.A.
  • Lockheed Martin Corp.
  • Northrop Grumman Corp.
  • Palantir Technologies Inc.
  • Rheinmetall AG
  • RTX Corp.
  • SparkCognition Inc.
  • Thales Group

Qualitative and quantitative analysis of companies has been conducted to help clients understand the wider business environment as well as the strengths and weaknesses of key industry players. Data is qualitatively analyzed to categorize companies as pure play, category-focused, industry-focused, and diversified; it is quantitatively analyzed to categorize companies as dominant, leading, strong, tentative, and weak.

Recent Development and News in Artificial intelligence (ai) in military market

  • In the Technology Hardware, Storage and Peripherals industry, the accelerated deployment of secure cloud infrastructure and tactical edge processing units has increased compute density, directly impacting Artificial Intelligence (AI) In Military demand by enabling a 40% faster battlefield data synthesis for intelligence surveillance reconnaissance missions.
  • The shift toward advanced semiconductor manufacturing techniques has improved thermal management in ruggedized hardware, driving the Artificial Intelligence (AI) In Military market by supporting resilient communication networks and military hardware modernization efforts that increase overall processing efficiency by 30%.
  • Supply chain restructuring around rare earth metals has stabilized the production of specialized defense electronics, fostering greater integration of human machine teaming and unmanned aerial platforms within the Artificial Intelligence (AI) In Military market to achieve a 20% cost reduction in system maintenance.
  • Stricter export control regulations on advanced microchips have incentivized localized defense industrial base expansion, which boosts the Artificial Intelligence (AI) In Military market by accelerating open architecture interoperability and combat vehicle retrofitting programs, improving system deployment timelines by 15%.

Dive into Technavio’s robust research methodology, blending expert interviews, extensive data synthesis, and validated models for unparalleled Artificial Intelligence (Ai) In Military Market insights. See full methodology.

Market Scope
Page number 306
Base year 2025
Historic period 2020-2024
Forecast period 2026-2030
Growth momentum & CAGR Accelerate at a CAGR of 42.8%
Market growth 2026-2030 USD 95325.7 million
Market structure Fragmented
YoY growth 2025-2026(%) 37.9%
Key countries US, Canada, Mexico, Germany, UK, France, Italy, Spain, The Netherlands, China, Japan, India, South Korea, Australia, Indonesia, Saudi Arabia, UAE, Israel, Turkey, South Africa, Brazil, Argentina and Chile
Competitive landscape Leading Companies, Market Positioning of Companies, Competitive Strategies, and Industry Risks

Request Free Sample

Research Analyst Overview

  • The Artificial Intelligence (AI) In Military Market is undergoing a rapid structural transformation as defense ministries transition from conceptual research to the active deployment of intelligentized warfare platforms. A decisive trend is the integration of neuromorphic processing units, which dramatically enhance the efficiency of on-board analytics for autonomous combat systems.
  • This technological shift directly influences boardroom-level procurement strategies, compelling contractors to prioritize open architecture interoperability to meet stringent compliance and integration standards. Consequently, implementing contextual threat recognition software has enabled military organizations to achieve a 40% reduction in false positive target identifications, significantly optimizing tactical resource allocation.
  • To protect these advanced capabilities, securing systems against data poisoning defense vulnerabilities has become a paramount operational priority. Furthermore, the adoption of federated learning protocols allows coalition forces to train algorithmic models collaboratively without sharing sensitive raw intelligence. These innovations underscore a continuous evolution where strategic focus is firmly placed on robust, secure, and highly efficient decision-making architectures.

What are the Key Data Covered in this Artificial Intelligence (Ai) In Military Market Research and Growth Report?

  • What is the expected growth of the Artificial Intelligence (Ai) In Military Market between 2026 and 2030?

    • USD 95.33 billion, at a CAGR of 42.8%

  • What segmentation does the market report cover?

    • The report is segmented by Component (Software, Hardware, and Services), Type (New procurement, and Upgradation), Technology (Machine learning, Computer vision, Natural language processing, Context-aware computing, and Others) and Geography (North America, Europe, APAC, Middle East and Africa, South America)

  • Which regions are analyzed in the report?

    • North America, Europe, APAC, Middle East and Africa and South America

  • What are the key growth drivers and market challenges?

    • Pursuit of decision superiority in multi-domain operations, Ethical, legal, and regulatory uncertainty

  • Who are the major players in the Artificial Intelligence (Ai) In Military Market?

    • Anduril Industries Inc., BAE Systems Plc, BigBear.ai Holdings Inc., The Boeing Co., Booz Allen Hamilton Corp., C3.ai Inc., CACI International Inc., Elbit Systems Ltd., HENSOLDT AG, Kratos Defense and Security Inc., L3Harris Technologies Inc., Leidos Holdings Inc., Leonardo S.p.A., Lockheed Martin Corp., Northrop Grumman Corp., Palantir Technologies Inc., Rheinmetall AG, RTX Corp., SparkCognition Inc. and Thales Group

Market Research Insights

  • The Artificial Intelligence (AI) In Military Market is rapidly evolving as defense organizations prioritize technological supremacy. By integrating mission specific custom models, armed forces have achieved a 30% reduction in intelligence processing time. The deployment of cybersecurity anomaly detection systems enhances network security, decreasing successful intrusion rates by over 40% across distributed network resilience architectures.
  • Furthermore, the implementation of predictive logistics models within the defense industrial base has optimized supply chain efficiency, improving resource allocation accuracy by 25%. These measurable outcomes demonstrate how algorithmic integration directly lowers operational overhead while simultaneously increasing mission readiness and strategic adaptability.

We can help! Our analysts can customize this artificial intelligence (ai) in military market research report to meet your requirements.

Get in touch

1. Executive Summary

1.1 Market overview

Executive Summary - Chart on Market Overview
Executive Summary - Data Table on Market Overview
Executive Summary - Chart on Global Market Characteristics
Executive Summary - Chart on Market by Geography
Executive Summary - Chart on Market Segmentation by Component
Executive Summary - Chart on Market Segmentation by Type
Executive Summary - Chart on Market Segmentation by Technology
Executive Summary - Chart on Incremental Growth
Executive Summary - Data Table on Incremental Growth
Executive Summary - Chart on Company Market Positioning

2. Technavio Analysis

2.1 Analysis of price sensitivity, lifecycle, customer purchase basket, adoption rates, and purchase criteria

2.2 Criticality of inputs and Factors of differentiation

Chart on Overview on criticality of inputs and factors of differentiation

2.3 Factors of disruption

Chart on Overview on factors of disruption

2.4 Impact of drivers and challenges

Chart on Impact of drivers and challenges in 2025 and 2030

3. Market Landscape

3.1 Market ecosystem

Chart on Parent Market
Data Table on - Parent Market

3.2 Market characteristics

Chart on Market characteristics analysis

3.3 Value chain analysis

Chart on Value chain analysis

4. Market Sizing

4.1 Market definition

Data Table on Offerings of companies included in the market definition

4.2 Market segment analysis

Market segments

4.3 Market size 2025

4.4 Market outlook: Forecast for 2025-2030

Chart on Global - Market size and forecast 2025-2030 ($ million)
Data Table on Global - Market size and forecast 2025-2030 ($ million)
Chart on Global Market: Year-over-year growth 2025-2030 (%)
Data Table on Global Market: Year-over-year growth 2025-2030 (%)

5. Historic Market Size

5.1 Global Artificial Intelligence (AI) In Military Market 2020 - 2024

Historic Market Size - Data Table on Global Artificial Intelligence (AI) In Military Market 2020 - 2024 ($ million)

5.2 Component segment analysis 2020 - 2024

Historic Market Size - Component Segment 2020 - 2024 ($ million)

5.3 Type segment analysis 2020 - 2024

Historic Market Size - Type Segment 2020 - 2024 ($ million)

5.4 Technology segment analysis 2020 - 2024

Historic Market Size - Technology Segment 2020 - 2024 ($ million)

5.5 Geography segment analysis 2020 - 2024

Historic Market Size - Geography Segment 2020 - 2024 ($ million)

5.6 Country segment analysis 2020 - 2024

Historic Market Size - Country Segment 2020 - 2024 ($ million)

6. Qualitative Analysis

6.1 Impact of Geopolitical Conflicts on Global Artificial Intelligence (AI) in Military Market

7. Five Forces Analysis

7.1 Five forces summary

Five forces analysis - Comparison between 2025 and 2030

7.2 Bargaining power of buyers

Bargaining power of buyers - Impact of key factors 2025 and 2030

7.3 Bargaining power of suppliers

Bargaining power of suppliers - Impact of key factors in 2025 and 2030

7.4 Threat of new entrants

Threat of new entrants - Impact of key factors in 2025 and 2030

7.5 Threat of substitutes

Threat of substitutes - Impact of key factors in 2025 and 2030

7.6 Threat of rivalry

Threat of rivalry - Impact of key factors in 2025 and 2030

7.7 Market condition

Chart on Market condition - Five forces 2025 and 2030

8. Market Segmentation by Component

8.1 Market segments

Chart on Component - Market share 2025-2030 (%)
Data Table on Component - Market share 2025-2030 (%)

8.2 Comparison by Component

Chart on Comparison by Component
Data Table on Comparison by Component

8.3 Software - Market size and forecast 2025-2030

Chart on Software - Market size and forecast 2025-2030 ($ million)
Data Table on Software - Market size and forecast 2025-2030 ($ million)
Chart on Software - Year-over-year growth 2025-2030 (%)
Data Table on Software - Year-over-year growth 2025-2030 (%)

8.4 Hardware - Market size and forecast 2025-2030

Chart on Hardware - Market size and forecast 2025-2030 ($ million)
Data Table on Hardware - Market size and forecast 2025-2030 ($ million)
Chart on Hardware - Year-over-year growth 2025-2030 (%)
Data Table on Hardware - Year-over-year growth 2025-2030 (%)

8.5 Services - Market size and forecast 2025-2030

Chart on Services - Market size and forecast 2025-2030 ($ million)
Data Table on Services - Market size and forecast 2025-2030 ($ million)
Chart on Services - Year-over-year growth 2025-2030 (%)
Data Table on Services - Year-over-year growth 2025-2030 (%)

8.6 Market opportunity by Component

Market opportunity by Component ($ million)
Data Table on Market opportunity by Component ($ million)

9. Market Segmentation by Type

9.1 Market segments

Chart on Type - Market share 2025-2030 (%)
Data Table on Type - Market share 2025-2030 (%)

9.2 Comparison by Type

Chart on Comparison by Type
Data Table on Comparison by Type

9.3 New procurement - Market size and forecast 2025-2030

Chart on New procurement - Market size and forecast 2025-2030 ($ million)
Data Table on New procurement - Market size and forecast 2025-2030 ($ million)
Chart on New procurement - Year-over-year growth 2025-2030 (%)
Data Table on New procurement - Year-over-year growth 2025-2030 (%)

9.4 Upgradation - Market size and forecast 2025-2030

Chart on Upgradation - Market size and forecast 2025-2030 ($ million)
Data Table on Upgradation - Market size and forecast 2025-2030 ($ million)
Chart on Upgradation - Year-over-year growth 2025-2030 (%)
Data Table on Upgradation - Year-over-year growth 2025-2030 (%)

9.5 Market opportunity by Type

Market opportunity by Type ($ million)
Data Table on Market opportunity by Type ($ million)

10. Market Segmentation by Technology

10.1 Market segments

Chart on Technology - Market share 2025-2030 (%)
Data Table on Technology - Market share 2025-2030 (%)

10.2 Comparison by Technology

Chart on Comparison by Technology
Data Table on Comparison by Technology

10.3 Machine learning - Market size and forecast 2025-2030

Chart on Machine learning - Market size and forecast 2025-2030 ($ million)
Data Table on Machine learning - Market size and forecast 2025-2030 ($ million)
Chart on Machine learning - Year-over-year growth 2025-2030 (%)
Data Table on Machine learning - Year-over-year growth 2025-2030 (%)

10.4 Computer vision - Market size and forecast 2025-2030

Chart on Computer vision - Market size and forecast 2025-2030 ($ million)
Data Table on Computer vision - Market size and forecast 2025-2030 ($ million)
Chart on Computer vision - Year-over-year growth 2025-2030 (%)
Data Table on Computer vision - Year-over-year growth 2025-2030 (%)

10.5 Natural language processing - Market size and forecast 2025-2030

Chart on Natural language processing - Market size and forecast 2025-2030 ($ million)
Data Table on Natural language processing - Market size and forecast 2025-2030 ($ million)
Chart on Natural language processing - Year-over-year growth 2025-2030 (%)
Data Table on Natural language processing - Year-over-year growth 2025-2030 (%)

10.6 Context-aware computing - Market size and forecast 2025-2030

Chart on Context-aware computing - Market size and forecast 2025-2030 ($ million)
Data Table on Context-aware computing - Market size and forecast 2025-2030 ($ million)
Chart on Context-aware computing - Year-over-year growth 2025-2030 (%)
Data Table on Context-aware computing - Year-over-year growth 2025-2030 (%)

10.7 Others - Market size and forecast 2025-2030

Chart on Others - Market size and forecast 2025-2030 ($ million)
Data Table on Others - Market size and forecast 2025-2030 ($ million)
Chart on Others - Year-over-year growth 2025-2030 (%)
Data Table on Others - Year-over-year growth 2025-2030 (%)

10.8 Market opportunity by Technology

Market opportunity by Technology ($ million)
Data Table on Market opportunity by Technology ($ million)

11. Customer Landscape

11.1 Customer landscape overview

Analysis of price sensitivity, lifecycle, customer purchase basket, adoption rates, and purchase criteria

12. Geographic Landscape

12.1 Geographic segmentation

Chart on Market share by geography 2025-2030 (%)
Data Table on Market share by geography 2025-2030 (%)

12.2 Geographic comparison

Chart on Geographic comparison
Data Table on Geographic comparison

12.3 North America - Market size and forecast 2025-2030

Chart on North America - Market size and forecast 2025-2030 ($ million)
Data Table on North America - Market size and forecast 2025-2030 ($ million)
Chart on North America - Year-over-year growth 2025-2030 (%)
Data Table on North America - Year-over-year growth 2025-2030 (%)
Chart on Regional Comparison - North America
Data Table on Regional Comparison - North America

12.3.1 US - Market size and forecast 2025-2030

Chart on US - Market size and forecast 2025-2030 ($ million)
Data Table on US - Market size and forecast 2025-2030 ($ million)
Chart on US - Year-over-year growth 2025-2030 (%)
Data Table on US - Year-over-year growth 2025-2030 (%)

12.3.2 Canada - Market size and forecast 2025-2030

Chart on Canada - Market size and forecast 2025-2030 ($ million)
Data Table on Canada - Market size and forecast 2025-2030 ($ million)
Chart on Canada - Year-over-year growth 2025-2030 (%)
Data Table on Canada - Year-over-year growth 2025-2030 (%)

12.3.3 Mexico - Market size and forecast 2025-2030

Chart on Mexico - Market size and forecast 2025-2030 ($ million)
Data Table on Mexico - Market size and forecast 2025-2030 ($ million)
Chart on Mexico - Year-over-year growth 2025-2030 (%)
Data Table on Mexico - Year-over-year growth 2025-2030 (%)

12.4 Europe - Market size and forecast 2025-2030

Chart on Europe - Market size and forecast 2025-2030 ($ million)
Data Table on Europe - Market size and forecast 2025-2030 ($ million)
Chart on Europe - Year-over-year growth 2025-2030 (%)
Data Table on Europe - Year-over-year growth 2025-2030 (%)
Chart on Regional Comparison - Europe
Data Table on Regional Comparison - Europe

12.4.1 Germany - Market size and forecast 2025-2030

Chart on Germany - Market size and forecast 2025-2030 ($ million)
Data Table on Germany - Market size and forecast 2025-2030 ($ million)
Chart on Germany - Year-over-year growth 2025-2030 (%)
Data Table on Germany - Year-over-year growth 2025-2030 (%)

12.4.2 UK - Market size and forecast 2025-2030

Chart on UK - Market size and forecast 2025-2030 ($ million)
Data Table on UK - Market size and forecast 2025-2030 ($ million)
Chart on UK - Year-over-year growth 2025-2030 (%)
Data Table on UK - Year-over-year growth 2025-2030 (%)

12.4.3 France - Market size and forecast 2025-2030

Chart on France - Market size and forecast 2025-2030 ($ million)
Data Table on France - Market size and forecast 2025-2030 ($ million)
Chart on France - Year-over-year growth 2025-2030 (%)
Data Table on France - Year-over-year growth 2025-2030 (%)

12.4.4 Italy - Market size and forecast 2025-2030

Chart on Italy - Market size and forecast 2025-2030 ($ million)
Data Table on Italy - Market size and forecast 2025-2030 ($ million)
Chart on Italy - Year-over-year growth 2025-2030 (%)
Data Table on Italy - Year-over-year growth 2025-2030 (%)

12.4.5 Spain - Market size and forecast 2025-2030

Chart on Spain - Market size and forecast 2025-2030 ($ million)
Data Table on Spain - Market size and forecast 2025-2030 ($ million)
Chart on Spain - Year-over-year growth 2025-2030 (%)
Data Table on Spain - Year-over-year growth 2025-2030 (%)

12.4.6 The Netherlands - Market size and forecast 2025-2030

Chart on The Netherlands - Market size and forecast 2025-2030 ($ million)
Data Table on The Netherlands - Market size and forecast 2025-2030 ($ million)
Chart on The Netherlands - Year-over-year growth 2025-2030 (%)
Data Table on The Netherlands - Year-over-year growth 2025-2030 (%)

12.5 APAC - Market size and forecast 2025-2030

Chart on APAC - Market size and forecast 2025-2030 ($ million)
Data Table on APAC - Market size and forecast 2025-2030 ($ million)
Chart on APAC - Year-over-year growth 2025-2030 (%)
Data Table on APAC - Year-over-year growth 2025-2030 (%)
Chart on Regional Comparison - APAC
Data Table on Regional Comparison - APAC

12.5.1 China - Market size and forecast 2025-2030

Chart on China - Market size and forecast 2025-2030 ($ million)
Data Table on China - Market size and forecast 2025-2030 ($ million)
Chart on China - Year-over-year growth 2025-2030 (%)
Data Table on China - Year-over-year growth 2025-2030 (%)

12.5.2 Japan - Market size and forecast 2025-2030

Chart on Japan - Market size and forecast 2025-2030 ($ million)
Data Table on Japan - Market size and forecast 2025-2030 ($ million)
Chart on Japan - Year-over-year growth 2025-2030 (%)
Data Table on Japan - Year-over-year growth 2025-2030 (%)

12.5.3 India - Market size and forecast 2025-2030

Chart on India - Market size and forecast 2025-2030 ($ million)
Data Table on India - Market size and forecast 2025-2030 ($ million)
Chart on India - Year-over-year growth 2025-2030 (%)
Data Table on India - Year-over-year growth 2025-2030 (%)

12.5.4 South Korea - Market size and forecast 2025-2030

Chart on South Korea - Market size and forecast 2025-2030 ($ million)
Data Table on South Korea - Market size and forecast 2025-2030 ($ million)
Chart on South Korea - Year-over-year growth 2025-2030 (%)
Data Table on South Korea - Year-over-year growth 2025-2030 (%)

12.5.5 Australia - Market size and forecast 2025-2030

Chart on Australia - Market size and forecast 2025-2030 ($ million)
Data Table on Australia - Market size and forecast 2025-2030 ($ million)
Chart on Australia - Year-over-year growth 2025-2030 (%)
Data Table on Australia - Year-over-year growth 2025-2030 (%)

12.5.6 Indonesia - Market size and forecast 2025-2030

Chart on Indonesia - Market size and forecast 2025-2030 ($ million)
Data Table on Indonesia - Market size and forecast 2025-2030 ($ million)
Chart on Indonesia - Year-over-year growth 2025-2030 (%)
Data Table on Indonesia - Year-over-year growth 2025-2030 (%)

12.6 Middle East and Africa - Market size and forecast 2025-2030

Chart on Middle East and Africa - Market size and forecast 2025-2030 ($ million)
Data Table on Middle East and Africa - Market size and forecast 2025-2030 ($ million)
Chart on Middle East and Africa - Year-over-year growth 2025-2030 (%)
Data Table on Middle East and Africa - Year-over-year growth 2025-2030 (%)
Chart on Regional Comparison - Middle East and Africa
Data Table on Regional Comparison - Middle East and Africa

12.6.1 Saudi Arabia - Market size and forecast 2025-2030

Chart on Saudi Arabia - Market size and forecast 2025-2030 ($ million)
Data Table on Saudi Arabia - Market size and forecast 2025-2030 ($ million)
Chart on Saudi Arabia - Year-over-year growth 2025-2030 (%)
Data Table on Saudi Arabia - Year-over-year growth 2025-2030 (%)

12.6.2 UAE - Market size and forecast 2025-2030

Chart on UAE - Market size and forecast 2025-2030 ($ million)
Data Table on UAE - Market size and forecast 2025-2030 ($ million)
Chart on UAE - Year-over-year growth 2025-2030 (%)
Data Table on UAE - Year-over-year growth 2025-2030 (%)

12.6.3 Israel - Market size and forecast 2025-2030

Chart on Israel - Market size and forecast 2025-2030 ($ million)
Data Table on Israel - Market size and forecast 2025-2030 ($ million)
Chart on Israel - Year-over-year growth 2025-2030 (%)
Data Table on Israel - Year-over-year growth 2025-2030 (%)

12.6.4 Turkey - Market size and forecast 2025-2030

Chart on Turkey - Market size and forecast 2025-2030 ($ million)
Data Table on Turkey - Market size and forecast 2025-2030 ($ million)
Chart on Turkey - Year-over-year growth 2025-2030 (%)
Data Table on Turkey - Year-over-year growth 2025-2030 (%)

12.6.5 South Africa - Market size and forecast 2025-2030

Chart on South Africa - Market size and forecast 2025-2030 ($ million)
Data Table on South Africa - Market size and forecast 2025-2030 ($ million)
Chart on South Africa - Year-over-year growth 2025-2030 (%)
Data Table on South Africa - Year-over-year growth 2025-2030 (%)

12.7 South America - Market size and forecast 2025-2030

Chart on South America - Market size and forecast 2025-2030 ($ million)
Data Table on South America - Market size and forecast 2025-2030 ($ million)
Chart on South America - Year-over-year growth 2025-2030 (%)
Data Table on South America - Year-over-year growth 2025-2030 (%)
Chart on Regional Comparison - South America
Data Table on Regional Comparison - South America

12.7.1 Brazil - Market size and forecast 2025-2030

Chart on Brazil - Market size and forecast 2025-2030 ($ million)
Data Table on Brazil - Market size and forecast 2025-2030 ($ million)
Chart on Brazil - Year-over-year growth 2025-2030 (%)
Data Table on Brazil - Year-over-year growth 2025-2030 (%)

12.7.2 Argentina - Market size and forecast 2025-2030

Chart on Argentina - Market size and forecast 2025-2030 ($ million)
Data Table on Argentina - Market size and forecast 2025-2030 ($ million)
Chart on Argentina - Year-over-year growth 2025-2030 (%)
Data Table on Argentina - Year-over-year growth 2025-2030 (%)

12.7.3 Chile - Market size and forecast 2025-2030

Chart on Chile - Market size and forecast 2025-2030 ($ million)
Data Table on Chile - Market size and forecast 2025-2030 ($ million)
Chart on Chile - Year-over-year growth 2025-2030 (%)
Data Table on Chile - Year-over-year growth 2025-2030 (%)

12.8 Market opportunity by geography

Market opportunity by geography ($ million)
Data Tables on Market opportunity by geography ($ million)

13. Drivers, Challenges, and Opportunity

13.1 Market drivers

Pursuit of decision superiority in multi-domain operations
Proliferation of autonomous and unmanned systems
Intensifying geopolitical competition and technological arms race

13.2 Market challenges

Ethical, legal, and regulatory uncertainty
Data management and security
System reliability and user trust

13.3 Impact of drivers and challenges

Impact of drivers and challenges in 2025 and 2030

13.4 Market opportunities

Proliferation of combat and support systems
Cognitive decision support and advanced intelligence processing
AI-enabled cybersecurity and electronic warfare resilience

14. Competitive Landscape

14.1 Overview

14.2

Overview on criticality of inputs and factors of differentiation

14.3 Landscape disruption

Overview on factors of disruption

14.4 Industry risks

Impact of key risks on business

15. Competitive Analysis

15.1 Companies profiled

Companies covered

15.2 Company ranking index

15.3 Market positioning of companies

Matrix on companies position and classification

15.4 Anduril Industries Inc.

Anduril Industries Inc. - Overview
Anduril Industries Inc. - Product / Service
Anduril Industries Inc. - Key offerings
SWOT

15.5 BAE Systems Plc

BAE Systems Plc - Overview
BAE Systems Plc - Business segments
BAE Systems Plc - Key news
BAE Systems Plc - Key offerings
BAE Systems Plc - Segment focus
SWOT

15.6 The Boeing Co.

The Boeing Co. - Overview
The Boeing Co. - Business segments
The Boeing Co. - Key news
The Boeing Co. - Key offerings
The Boeing Co. - Segment focus
SWOT

15.7 Booz Allen Hamilton Corp.

Booz Allen Hamilton Corp. - Overview
Booz Allen Hamilton Corp. - Product / Service
Booz Allen Hamilton Corp. - Key news
Booz Allen Hamilton Corp. - Key offerings
SWOT

15.8 CACI International Inc.

CACI International Inc. - Overview
CACI International Inc. - Business segments
CACI International Inc. - Key offerings
CACI International Inc. - Segment focus
SWOT

15.9 Elbit Systems Ltd.

Elbit Systems Ltd. - Overview
Elbit Systems Ltd. - Business segments
Elbit Systems Ltd. - Key offerings
Elbit Systems Ltd. - Segment focus
SWOT

15.10 HENSOLDT AG

HENSOLDT AG - Overview
HENSOLDT AG - Business segments
HENSOLDT AG - Key offerings
HENSOLDT AG - Segment focus
SWOT

15.11 L3Harris Technologies Inc.

L3Harris Technologies Inc. - Overview
L3Harris Technologies Inc. - Business segments
L3Harris Technologies Inc. - Key offerings
L3Harris Technologies Inc. - Segment focus
SWOT

15.12 Leidos Holdings Inc.

Leidos Holdings Inc. - Overview
Leidos Holdings Inc. - Business segments
Leidos Holdings Inc. - Key offerings
Leidos Holdings Inc. - Segment focus
SWOT

15.13 Leonardo S.p.A.

Leonardo S.p.A. - Overview
Leonardo S.p.A. - Business segments
Leonardo S.p.A. - Key news
Leonardo S.p.A. - Key offerings
Leonardo S.p.A. - Segment focus
SWOT

15.14 Lockheed Martin Corp.

Lockheed Martin Corp. - Overview
Lockheed Martin Corp. - Business segments
Lockheed Martin Corp. - Key news
Lockheed Martin Corp. - Key offerings
Lockheed Martin Corp. - Segment focus
SWOT

15.15 Northrop Grumman Corp.

Northrop Grumman Corp. - Overview
Northrop Grumman Corp. - Business segments
Northrop Grumman Corp. - Key offerings
Northrop Grumman Corp. - Segment focus
SWOT

15.16 Rheinmetall AG

Rheinmetall AG - Overview
Rheinmetall AG - Business segments
Rheinmetall AG - Key offerings
Rheinmetall AG - Segment focus
SWOT

15.17 RTX Corp.

RTX Corp. - Overview
RTX Corp. - Business segments
RTX Corp. - Key news
RTX Corp. - Key offerings
RTX Corp. - Segment focus
SWOT

15.18 Thales Group

Thales Group - Overview
Thales Group - Business segments
Thales Group - Key news
Thales Group - Key offerings
Thales Group - Segment focus
SWOT

16. Appendix

16.1 Scope of the report

Market definition
Objectives
Notes and caveats

16.2 Inclusions and exclusions checklist

Inclusions checklist
Exclusions checklist

16.3 Currency conversion rates for US$

16.4 Research methodology

16.5 Data procurement

Information sources

16.6 Data validation

16.7 Validation techniques employed for market sizing

16.8 Data synthesis

16.9 360 degree market analysis

16.10 List of abbreviations

Research Methodology

Technavio presents a detailed picture of the market by way of study, synthesis, and summation of data from multiple sources. The analysts have presented the various facets of the market with a particular focus on identifying the key industry influencers. The data thus presented is comprehensive, reliable, and the result of extensive research, both primary and secondary.

INFORMATION SOURCES

Primary sources

  • Manufacturers and suppliers
  • Channel partners
  • Industry experts
  • Strategic decision makers

Secondary sources

  • Industry journals and periodicals
  • Government data
  • Financial reports of key industry players
  • Historical data
  • Press releases

DATA ANALYSIS

Data Synthesis

  • Collation of data
  • Estimation of key figures
  • Analysis of derived insights

Data Validation

  • Triangulation with data models
  • Reference against proprietary databases
  • Corroboration with industry experts

REPORT WRITING

Qualitative

  • Market drivers
  • Market challenges
  • Market trends
  • Five forces analysis

Quantitative

  • Market size and forecast
  • Market segmentation
  • Geographical insights
  • Competitive landscape

Interested in this report?

Get your sample now to see our research methodology and insights!

Download Now

Frequently Asked Questions

Artificial Intelligence (Ai) In Military market growth will increase by USD 95325.7 million during 2026-2030.

The Artificial Intelligence (Ai) In Military market is expected to grow at a CAGR of 42.8% during 2026-2030.

Artificial Intelligence (Ai) In Military market is segmented by Component (Software, Hardware, Services) Type (New procurement, Upgradation) Technology (Machine learning, Computer vision, Natural language processing, Context-aware computing, Others)

Anduril Industries Inc., BAE Systems Plc, BigBear.ai Holdings Inc., The Boeing Co., Booz Allen Hamilton Corp., C3.ai Inc., CACI International Inc., Elbit Systems Ltd., HENSOLDT AG, Kratos Defense and Security Inc., L3Harris Technologies Inc., Leidos Holdings Inc., Leonardo S.p.A., Lockheed Martin Corp., Northrop Grumman Corp., Palantir Technologies Inc., Rheinmetall AG, RTX Corp., SparkCognition Inc., Thales Group are a few of the key vendors in the Artificial Intelligence (Ai) In Military market.

North America will register the highest growth rate of 53.6% among the other regions. Therefore, the Artificial Intelligence (Ai) In Military market in North America is expected to garner significant business opportunities for the vendors during the forecast period.

US, Canada, Mexico, Germany, UK, France, Italy, Spain, The Netherlands, China, Japan, India, South Korea, Australia, Indonesia, Saudi Arabia, UAE, Israel, Turkey, South Africa, Brazil, Argentina, Chile

  • Pursuit of decision superiority in multi-domain operations is the driving factor this market.

The Artificial Intelligence (Ai) In Military market vendors should focus on grabbing business opportunities from the Component segment as it accounted for the largest market share in the base year.
RIA - Research AI Assistant
Ask RIA
