
ATV and UTV Market Size 2025-2029
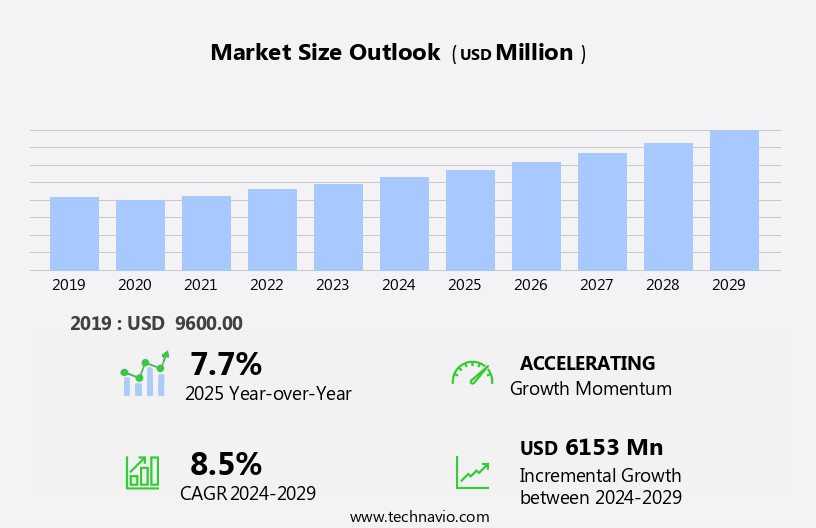
The ATV and UTV market size is forecast to increase by USD 6.15 billion at a CAGR of 8.5% between 2024 and 2029.
- The All-Terrain Vehicles (ATV) and Utility Terrain Vehicles (UTV) market is experiencing significant growth, driven by the increasing trend toward adventurous sporting activities and the growing automation in these vehicles. This market caters to a diverse customer base, including outdoor enthusiasts, farmers, and commercial users. The automation trend is transforming these vehicles with advanced features such as improved suspension systems, enhanced powertrains, and sophisticated safety systems. However, the market also faces challenges, primarily due to environmental concerns arising from the use of ATVs and UTVs. Governments and regulatory bodies are imposing stricter emission norms and noise regulations, which may increase the cost of production and impact profitability. Additionally, concerns over the impact of these vehicles on the environment, particularly in sensitive areas, may limit their usage. Companies in this market must navigate these challenges by investing in research and development to create eco-friendly vehicles and engaging in advocacy efforts to promote responsible use. By capitalizing on the growth drivers and addressing the challenges effectively, market participants can seize opportunities and maintain a competitive edge.
What will be the Size of the ATV and UTV Market during the forecast period?
- The recreational off-highway vehicle (ROV) market, encompassing both All-Terrain Vehicles (ATVs) and Utility Terrain Vehicles (UTVs), experiences continuous growth due to increasing popularity in adventure sports and extreme recreational activities. These vehicles offer navigational aids, troop transportation, and passenger carrying capacity, making them versatile for various applications. However, concerns regarding noise pollution, vegetation damage, and soil erosion persist, leading to ongoing discussions about government rules and infrastructure development. Safety features, such as sophisticated suspension systems and emission control mechanisms, are increasingly important for both consumers and regulators. Product innovation and diversification, including gasoline-powered, lithium ion powered, and hybrid models, cater to a wide range of consumer preferences.
- Additionally, application expansion into sectors like tactical missions, nature exploration, and emergency services, contributes to the market's growth. The ROV industry faces challenges, including high maintenance costs, fuel type concerns, and wildlife habitat preservation. Balancing recreational activities with environmental considerations remains a key focus. Domestic manufacturing and dealer networks ensure a steady supply of vehicles for the expanding market. Overall, the ROV market continues to evolve, driven by consumer demand for versatile, powerful, and eco-friendly recreational vehicles.
How is this ATV and UTV Industry segmented?
The ATV and UTV industry research report provides comprehensive data (region-wise segment analysis), with forecasts and estimates in "USD billion" for the period 2025-2029, as well as historical data from 2019-2023 for the following segments.
- Fuel Type
- Gasoline powered
- Diesel powered
- Electric powered
- Solar powered
- Application
- Sports
- Utility
- Others
- Vehicle Type
- UTV
- ATV
- Product Type
- 400 CC to 800 CC
- Less than 400 CC
- More than 800 CC
- Geography
- North America
- US
- Canada
- Europe
- France
- Germany
- UK
- APAC
- China
- India
- Japan
- Middle East and Africa
- South Africa
- South America
- Brazil
- North America
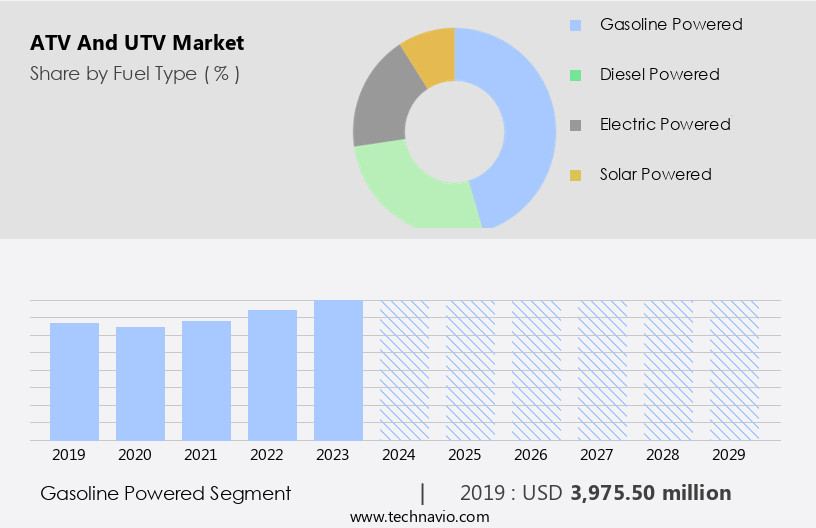
By Fuel Type Insights
The gasoline powered segment is estimated to witness significant growth during the forecast period. The market is primarily driven by the gasoline-powered segment, which accounted for the largest market share in 2024. Gasoline-powered ATVs and UTVs are widely used due to their rapid acceleration and the availability of a vast network of fuel stations. These vehicles are preferred for off-road adventures, military applications, and recreational activities. Gasoline engines are favored for their lower emissions, reduced vibration, and noise levels compared to diesel engines. Additionally, engine downsizing in gasoline engines makes them lighter and more compact than diesel engines.
Get a glance at the market report of share of various segments Request Free Sample
The gasoline powered segment was valued at USD 3.98 billion in 2019 and showed a gradual increase during the forecast period.
Regional Analysis
North America is estimated to contribute 60% to the growth of the global market during the forecast period. Technavio's analysts have elaborately explained the regional trends and drivers that shape the market during the forecast period.

For more insights on the market size of various regions, Request Free Sample
The North American region dominates The market due to the high demand for off-road vehicles and numerous off-road adventure activities. The US and Canada are the major contributors to the region's market revenue. Off-road vehicles' popularity in these countries is driven by the availability of trails for riding and recreational activities, including extreme sports and adventure tourism. The market's growth is further fueled by the increasing demand for utility vehicles for land management and safety training. Regulations regarding off-road vehicle usage, trail access, and maintenance are essential considerations for market participants.
Market Dynamics
Our researchers analyzed the data with 2024 as the base year, along with the key drivers, trends, and challenges. A holistic analysis of drivers will help companies refine their marketing strategies to gain a competitive advantage.
What are the key market drivers leading to the rise in the adoption of ATV and UTV Industry?
- Increasing trend toward adventurous sporting is the key driver of the market. The market is experiencing significant growth due to the increasing popularity of off-road recreational activities in various regions, including North America and Europe. The number of mountain racing and dirt racing events and enthusiasts in these regions is on the rise, leading to an uptick in demand for these vehicles.
- Organizations such as the Canadian Council of Snowmobile Organizations and North America Snowmobile conduct annual sports events that drive sales of ATV and UTV tires. For instance, the Toronto International Snowmobile, ATV and Powersports Show, held in October 2023, attracted a large number of adventure sports enthusiasts, boosting demand for these vehicles. This trend is expected to continue during the forecast period, contributing to the market's expansion. Product diversification is a key trend in the market, with manufacturers focusing on consumer demands for more eco-friendly options. Lithium-ion powered electric vehicles are gaining traction, offering reduced environmental impact and lower operating costs. Additionally, the market is expanding beyond traditional off-road use, with applications in forest management, agriculture, and even emergency response situations.
What are the market trends shaping the ATV and UTV Industry?
- Growing automation in ATVs and UTVs is the upcoming market trend. The global All-Terrain Vehicles (ATV) and Utility Terrain Vehicles (UTV) market is experiencing significant advancements in powertrains and drivetrains. The automotive sector's transition towards autonomous and connected car technologies is influencing the market as well.
- Leading manufacturers are investing in autonomous technologies to expand the capabilities of conventional vehicles. For instance, Honda Motor showcased a prototype of its autonomous ATV at CONEXPO 2023, featuring a GPS and sensor-based semi-autonomous drivetrain. These technological innovations are enhancing the performance and functionality of ATVs and UTVs. In addition, the growing popularity of recreational activities and off-road adventure events among enthusiasts in the emerging markets of APAC is also contributing to an increase in ATV and UTV sales. Also, off-road enthusiasts are increasingly looking for ATVs to engage in off-road activities and adventure sports. Therefore, the rising number of off-road activities and increasing recreational and adventure sports activities are expected to drive the growth of the global ATV and UTV market during the forecast period.
What challenges does the ATV and UTV Industry face during its growth?
- Environmental concerns due to use of ATVs and UTVs is a key challenge affecting the industry growth. The market faces challenges due to the environmental impact of these vehicles on rough terrain. Soil erosion, increased bulk density, strength, and permeability, and soil compaction are adverse effects of using these off-highway vehicles. Biologists have raised concerns that these impacts can harm the soil's ability to support vegetation and plant growth. As soil compaction increases over time, the negative effects become more pronounced.
- This environmental concern may hinder the market's growth. It is crucial for manufacturers and users to consider sustainable practices and mitigate the environmental impact of ATVs and UTVs. For instance, in March 2023, Honda Motor unveiled a prototype of its autonomous ATV at CONEXPO 2023 in Las Vegas, US. The prototype was built on a rugged ATV chassis. It featured a GPS and a sensor-based semi-autonomous drivetrain. In addition, the prototype was equipped with power-swappable accessories. Other prominent ATV manufacturers are also working on similar technologies. Thus, such developments are expected to positively influence the growth of the market in focus during the forecast period. Despite the benefits, the use of ATVs and UTVs in sensitive wildlife areas raises concerns about water quality and forest floor cover. It is essential that users follow regulations and practice responsible use to minimize negative impacts on the environment. As the market continues to evolve, it is crucial to prioritize sustainability and safety while meeting the demands of consumers for exciting and versatile outdoor recreational vehicles.
Exclusive Customer Landscape
The ATV and UTV market forecasting report includes the adoption lifecycle of the market, covering from the innovator's stage to the laggard's stage. It focuses on adoption rates in different regions based on penetration. Furthermore, the ATV and UTV market report also includes key purchase criteria and drivers of price sensitivity to help companies evaluate and develop their market growth analysis strategies.

Customer Landscape
Key Companies & Market Insights
Companies are implementing various strategies, such as strategic alliances, ATV and UTV market forecast, partnerships, mergers and acquisitions, geographical expansion, and product/service launches, to enhance their presence in the industry.
Bombardier Recreational Products Inc. - The company offers ATVs such as Outlander 450, Renegade and Outlander as well as SXS vehicles.
The industry research and growth report includes detailed analyses of the competitive landscape of the market and information about key companies, including:
- Deere and Co.
- HISUN Motors Corp.
- Honda Motor Co. Ltd.
- Kawasaki Heavy Industries Ltd.
- Kayo USA
- Kubota Corp.
- Kymco
- Nebula Automotive Pvt. Ltd.
- Polaris Inc.
- Suzuki Motor Corp.
- Taiwan Golden Bee Co. Ltd.
- Tao Motor Inc.
- Textron Inc.
- TOMCAR
- Yamaha Motor Co. Ltd.
- Zhejiang CfMoto Power Co. Ltd.
Qualitative and quantitative analysis of companies has been conducted to help clients understand the wider business environment as well as the strengths and weaknesses of key industry players. Data is qualitatively analyzed to categorize companies as pure play, category-focused, industry-focused, and diversified; it is quantitatively analyzed to categorize companies as dominant, leading, strong, tentative, and weak.
Research Analyst Overview
Off-road vehicles, also known as all-terrain vehicles (ATVs) and utility task vehicles (UTVs), have gained significant popularity in recent years due to their versatility and ability to traverse various terrains. These vehicles offer thrilling off-road adventures for enthusiasts seeking excitement and exploration. The off-road vehicle market is driven by several factors, including the growing trend of adventure tourism and leisure activities. Adventure sports, such as off-road riding, have become increasingly popular, attracting a large and diverse customer base. This market also caters to those seeking utility vehicles for work purposes, such as farming, construction, and forestry. Despite their popularity, off-road vehicles have faced criticism regarding their environmental impact.In addition, exposed roots and soil erosion are concerns for land management agencies, leading to increased regulations and trail access restrictions. Noise abatement and wildlife conservation are also critical issues, with many trail systems implementing rules to minimize disturbance to wildlife habitats. Safety training is essential for off-road vehicle users, with many organizations offering courses to ensure riders are equipped with the necessary skills and knowledge. Regulations governing off-road vehicle use vary from region to region, with some areas requiring safety gear and others enforcing strict noise and trail access rules. Repair and maintenance are crucial aspects of off-road vehicle ownership, with many riders opting for online parts and accessories to keep their vehicles in top condition. The All-Terrain Vehicle (ATV) and Utility Terrain Vehicle (UTV) market is experiencing significant growth in the outdoor recreation industry. These vehicles, which include four-wheel drive, off-road machines, are increasingly popular for exploring wildlife areas and accessing remote nature camps. However, the high maintenance cost associated with these vehicles can be a deterrent for some consumers.
Furthermore, trail expansion and construction are ongoing efforts to accommodate the growing number of off-road enthusiasts, with some areas investing in electric models to reduce environmental impact. UTVs have gained popularity due to their larger size and increased utility, making them ideal for carrying passengers and cargo. Power output, fuel type, and automation features are key considerations for UTV buyers, with liquid-cooled motors and transmission gearboxes becoming increasingly popular. Off-road vehicle riding tips are essential for beginners, with many resources available online and through organizations to ensure safe and enjoyable experiences. Trail maintenance is also crucial to ensure a positive riding experience for all users, with many trail systems implementing volunteer programs to help maintain and expand their networks. Therefore, the off-road vehicle market is driven by a diverse range of factors, including adventure tourism, utility needs, and environmental considerations. Regulations, safety training, and maintenance are essential aspects of off-road vehicle ownership, ensuring a positive and enjoyable experience for all users.
|
Market Scope |
|
|
Report Coverage |
Details |
|
Page number |
228 |
|
Base year |
2024 |
|
Historic period |
2019-2023 |
|
Forecast period |
2025-2029 |
|
Growth momentum & CAGR |
Accelerate at a CAGR of 8.5% |
|
Market growth 2025-2029 |
USD 6.15 billion |
|
Market structure |
Fragmented |
|
YoY growth 2024-2025(%) |
7.7 |
|
Key countries |
US, Canada, Germany, China, France, Japan, Brazil, UK, India, and South Africa |
|
Competitive landscape |
Leading Companies, market growth and forecasting, Market Positioning of Companies, Competitive Strategies, and Industry Risks |
What are the Key Data Covered in this ATV and UTV Market Research and Growth Report?
- CAGR of the ATV and UTV industry during the forecast period
- Detailed information on factors that will drive the growth and forecasting between 2025 and 2029
- Precise estimation of the size of the market and its contribution of the industry in focus to the parent market
- Accurate predictions about upcoming growth and trends and changes in consumer behaviour
- Growth of the market across North America, Europe, APAC, Middle East and Africa, and South America
- Thorough analysis of the market's competitive landscape and detailed information about companies
- Comprehensive analysis of factors that will challenge the ATV and UTV market growth of industry companies
We can help! Our analysts can customize this ATV and UTV market research report to meet your requirements.