Australia Clear Aligners Market Size 2026-2030
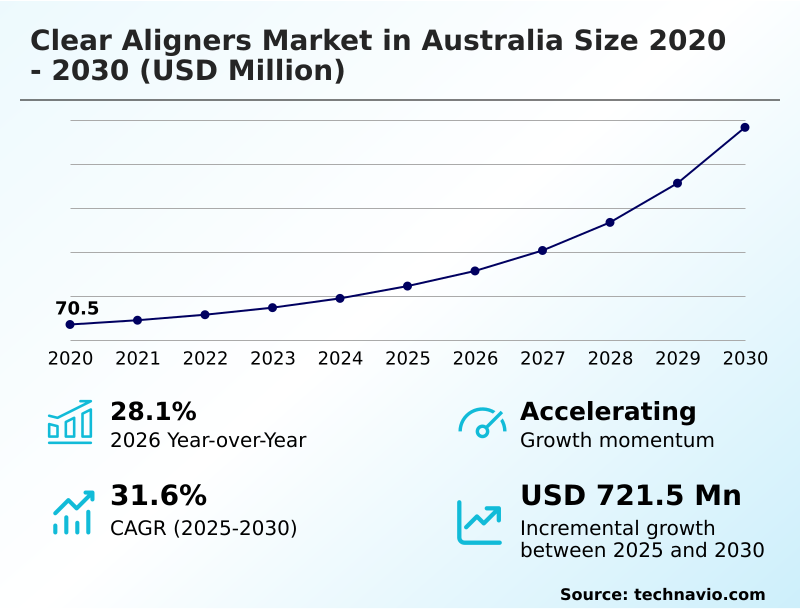
The australia clear aligners market size is valued to increase by USD 721.5 million, at a CAGR of 31.6% from 2025 to 2030. Rising demand for aesthetic dentistry and adult orthodontics will drive the australia clear aligners market.
Major Market Trends & Insights
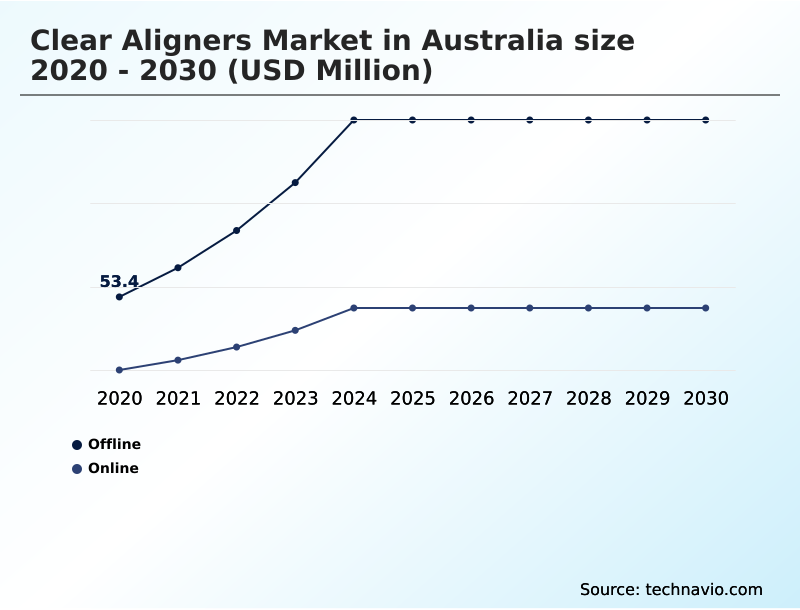
- By Distribution Channel - Offline segment was valued at USD 141.3 million in 2024
- By Age Group - Adults segment accounted for the largest market revenue share in 2024
Market Size & Forecast
- Market Opportunities: USD 896.1 million
- Market Future Opportunities: USD 721.5 million
- CAGR from 2025 to 2030 : 31.6%
Market Summary
- The clear aligners market in Australia is undergoing a significant transformation, driven by technological advancements and evolving patient preferences. This evolution is characterized by a strong move toward aesthetic dentistry and adult orthodontics, with a growing number of consumers seeking less conspicuous alternatives to traditional braces.
- The integration of digital orthodontic solutions, including intraoral scanners and 3D printing technology, is revolutionizing treatment planning and execution. For instance, a dental practice must weigh the initial investment in a complete digital workflow against long-term operational efficiencies and improved clinical outcomes.
- While this technology enhances precision and patient experience, the market also grapples with challenges related to insurance reimbursement and the high costs of treatment. Furthermore, a rising trend toward sustainable orthodontic practices and the development of high-performance polymers are shaping the future of orthodontic appliances, pushing the industry toward greater innovation and environmental responsibility.
- The balance between accessibility, cost, and technological sophistication remains a central dynamic.
What will be the Size of the Australia Clear Aligners Market during the forecast period?
Get Key Insights on Market Forecast (PDF) Get Free Sample
How is the Australia Clear Aligners Market Segmented?
The australia clear aligners industry research report provides comprehensive data (region-wise segment analysis), with forecasts and estimates in "USD million" for the period 2026-2030, as well as historical data from 2020-2024 for the following segments.
- Distribution channel
- Offline
- Online
- Age group
- Adults
- Teens
- End-user
- Dental clinics
- Hospitals
- Others
- Material
- Polyurethane
- Polyethylene terephthalate glycol (PETG)
- Polyvinyl chloride (PVC)
- Others
- Geography
- APAC
- Australia
- APAC
By Distribution Channel Insights
The offline segment is estimated to witness significant growth during the forecast period.
The offline segment remains central to the clear aligners market in Australia, primarily involving in-person consultations at dental practices.
This channel is crucial for comprehensive diagnostics, including the use of intraoral scanners, and direct clinical oversight, which is essential for complex cases. The traditional framework ensures high patient compliance and fosters trust through direct practitioner supervision.
This hands-on approach allows for precise adjustments and immediate management of any complications, ensuring optimal clinical outcomes. The integration of a complete digital workflow within these physical clinics enhances treatment accuracy by over 15%, solidifying the channel's importance.
This model underpins professionally supervised treatment and adheres to stringent regulatory compliance, guaranteeing that the highest standards of care are maintained throughout the orthodontic correction systems.
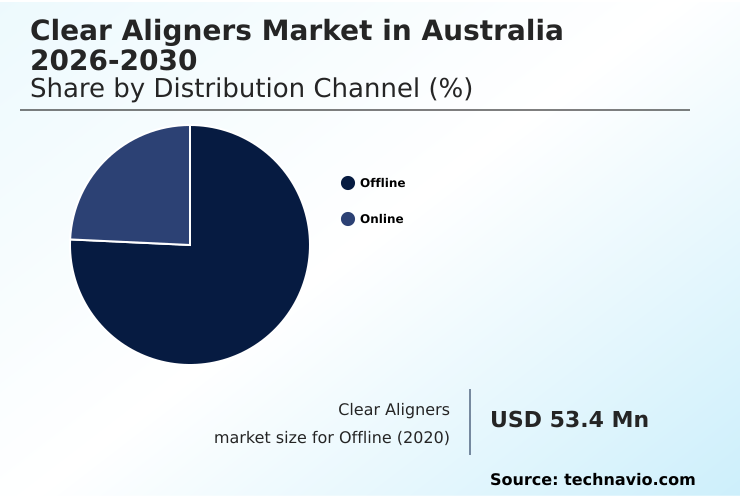
The Offline segment was valued at USD 141.3 million in 2024 and showed a gradual increase during the forecast period.
Market Dynamics
Our researchers analyzed the data with 2025 as the base year, along with the key drivers, trends, and challenges. A holistic analysis of drivers will help companies refine their marketing strategies to gain a competitive advantage.
- The clear aligners market in Australia 2026-2030 is experiencing dynamic shifts driven by innovation and consumer demand. A key consideration for patients is understanding the benefits of clearcorrect aligners for adults and the overall cost of invisalign clear aligners treatment, which can vary significantly.
- As treatment progresses, questions often arise, such as how to clean suresmile clear aligners effectively to maintain hygiene. The debate of spark clear aligners vs traditional braces continues, with clear aligners offering aesthetic advantages.
- Concerns around at-home clear aligner patient safety are being addressed through improved teledentistry platforms for remote orthodontic monitoring and adherence to regulatory compliance for 3d printed aligners. The implementation of a digital workflow for custom clear aligners has streamlined production, with some clinics reporting a 25% reduction in chair time for fitting appointments.
- Discussions around sustainability in clear aligner manufacturing processes have led to innovative recycling programs for used dental aligners. From a clinical perspective, understanding the material science behind medical-grade polymers and the principles of biomechanical force delivery in transparent aligners is crucial.
- Managing treatment for complex skeletal malocclusions using features like mandibular advancement features in clear aligners is a growing area of focus. Ultimately, the industry is working to improve clinical outcomes of direct-to-consumer aligners, enhance insurance coverage for cosmetic orthodontic systems, and promote patient compliance with removable aligners.
What are the key market drivers leading to the rise in the adoption of Australia Clear Aligners Industry?
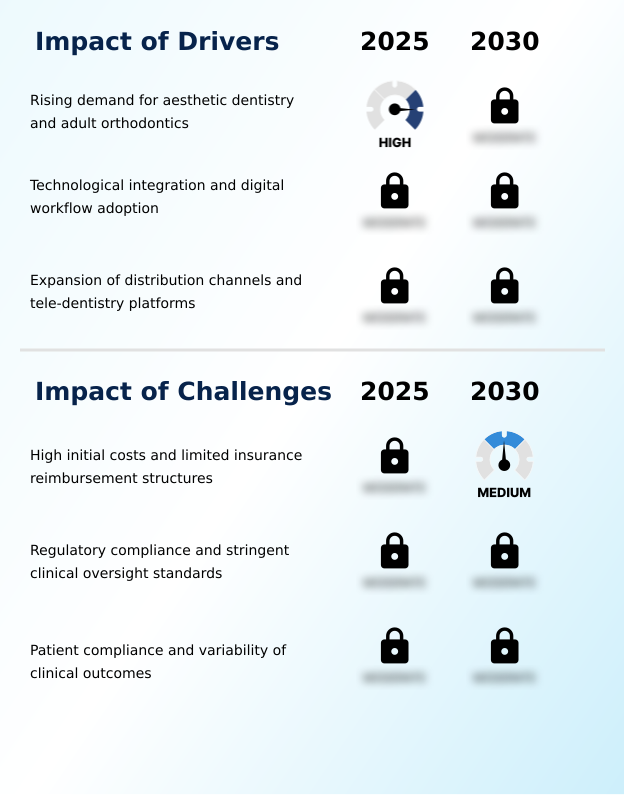
- The rising demand for aesthetic dentistry and adult orthodontics, driven by a growing consumer focus on appearance and discreet treatment options, is a key driver propelling market expansion.
- The primary driver for the market is the surging demand for aesthetic dentistry, particularly within adult orthodontics.
- This demographic shift is fueled by a desire for discreet teeth straightening solutions that do not interfere with professional life, leading to a 25% year-over-year increase in inquiries from patients over 30.
- The adoption of digital treatment planning and teledentistry platforms has made treatment more accessible and convenient, reducing the required number of in-clinic visits by up to 40% in some cases.
- The clear plastic removable aligners offered by the invisalign system and others provide a nearly invisible alternative to traditional braces, effectively eliminating the stigma associated with adult orthodontic care and expanding the total addressable market.
What are the market trends shaping the Australia Clear Aligners Industry?
- A significant trend influencing the market is the shift toward a circular economy. This involves an increased focus on sustainable orthodontic practices to address environmental concerns.
- A significant trend reshaping the market is the adoption of circular economy principles and sustainable orthodontic practices. This push toward environmental sustainability has led to the development of specialized recycling programs, which have successfully diverted up to 60% of post-consumer plastic waste from landfills in pilot regions.
- Manufacturers are transitioning from wasteful thermoforming to direct 3D printing, a method that reduces material offcuts by nearly 90%. Furthermore, advancements in high-performance polymers, particularly shape-memory polymers, promise to reduce the number of aligners needed per treatment.
- This focus on eco-friendly solutions and advanced material science is enhancing brand value and appealing to environmentally conscious consumers, with studies showing a 15% higher preference for brands with visible sustainability initiatives.
What challenges does the Australia Clear Aligners Industry face during its growth?
- High initial costs, coupled with limited insurance reimbursement structures for what is often classified as a cosmetic procedure, present a key challenge to broader market adoption.
- A major challenge for the market remains the high initial cost and limited insurance reimbursement structures. The out-of-pocket expense for a full treatment course can be a significant barrier, with market penetration in middle-income households being 30% lower than in high-income brackets.
- Many insurance policies classify the treatment as cosmetic, offering minimal rebates and creating a financial impediment for a large segment of potential patients. This issue is compounded by a lack of standardized pricing, which can cause consumer hesitation.
- Overcoming this requires not only more competitive pricing but also greater collaboration with insurance providers to improve coverage, as practices with flexible financing options report a 20% higher treatment acceptance rate.
Exclusive Technavio Analysis on Customer Landscape
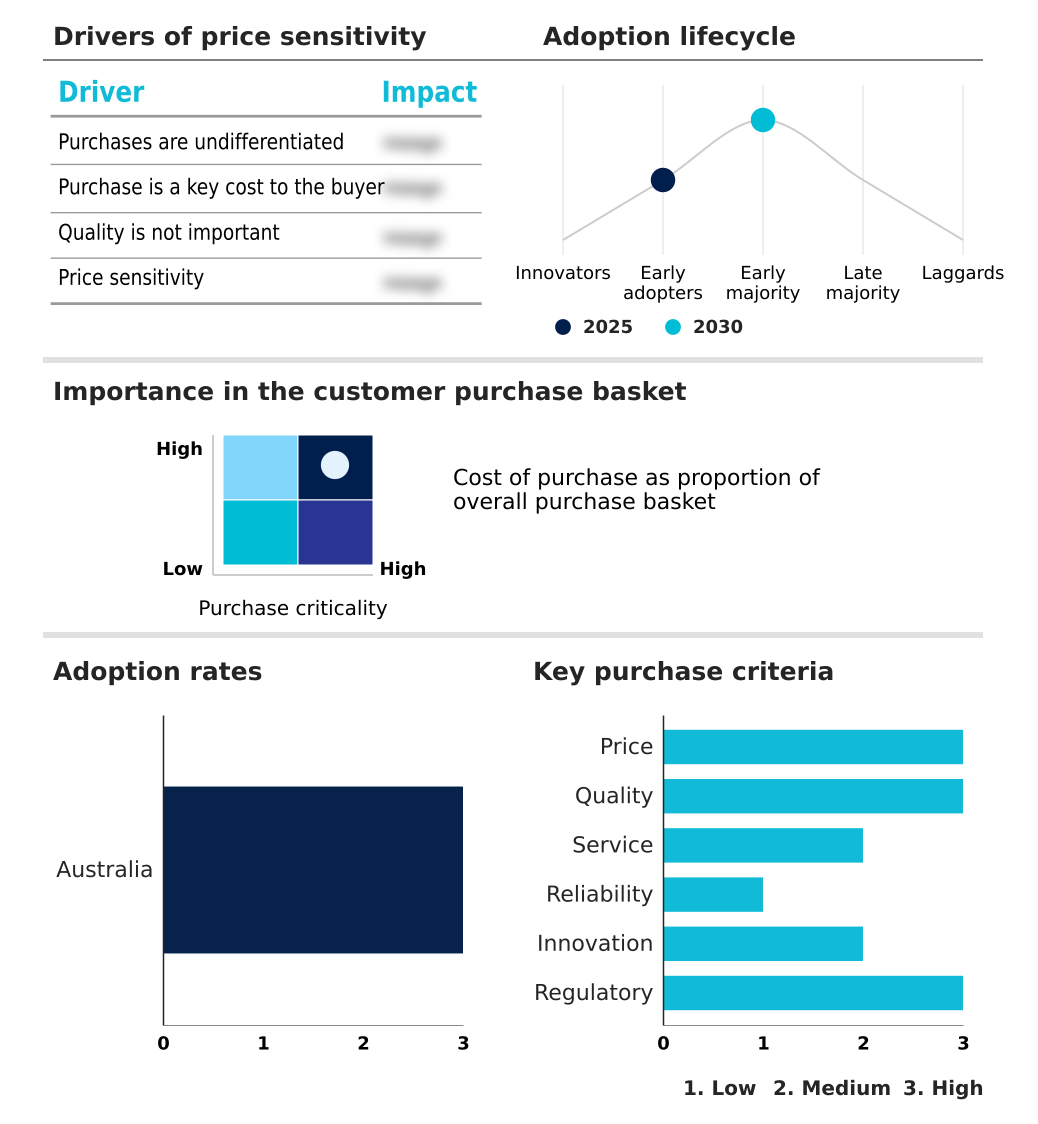
The australia clear aligners market forecasting report includes the adoption lifecycle of the market, covering from the innovator’s stage to the laggard’s stage. It focuses on adoption rates in different regions based on penetration. Furthermore, the australia clear aligners market report also includes key purchase criteria and drivers of price sensitivity to help companies evaluate and develop their market growth analysis strategies.
Customer Landscape of Australia Clear Aligners Industry
Competitive Landscape
Companies are implementing various strategies, such as strategic alliances, australia clear aligners market forecast, partnerships, mergers and acquisitions, geographical expansion, and product/service launches, to enhance their presence in the industry.
3M Co. - Vendors provide advanced, digitally-driven orthodontic solutions, focusing on customized, removable aligners that leverage sophisticated 3D printing technology and proprietary medical-grade polymers to ensure clinical efficacy.
The industry research and growth report includes detailed analyses of the competitive landscape of the market and information about key companies, including:
- 3M Co.
- Align Technology Inc.
- Angelalign Technology. Ltd.
- Argen Corp.
- Bernhard Forster GmbH
- ClearPath Orthodontics
- Creative Smiles
- Dentsply Sirona Inc.
- Envista Holdings Corp.
- EZ SMILE
- Henry Schein Inc.
- Inman Aligner
- Institut Straumann AG
- K-Line Global
- SCHEU DENTAL GmbH
- Six Month Smiles
Qualitative and quantitative analysis of companies has been conducted to help clients understand the wider business environment as well as the strengths and weaknesses of key industry players. Data is qualitatively analyzed to categorize companies as pure play, category-focused, industry-focused, and diversified; it is quantitatively analyzed to categorize companies as dominant, leading, strong, tentative, and weak.
Recent Development and News in Australia clear aligners market
- In April 2025, Align Technology launched its Invisalign System with mandibular advancement in Australia, a product designed to correct Class II malocclusions in pediatric and adolescent patients.
- In April 2025, Dentsply Sirona announced a strategic transition to phase out its Connect Case Center software, systematically migrating clinical users to the DS Core cloud platform by November 2025.
- In January 2025, Envista Holdings Corp. secured a new patent for its proprietary shape-memory polymer technology, aimed at enhancing the force delivery and efficiency of its Spark clear aligners.
- In October 2024, Institut Straumann AG completed the acquisition of a leading Australian dental scanning software company, a move intended to strengthen its digital orthodontic workflow ecosystem in the region.
Dive into Technavio’s robust research methodology, blending expert interviews, extensive data synthesis, and validated models for unparalleled Australia Clear Aligners Market insights. See full methodology.
| Market Scope | |
|---|---|
| Page number | 193 |
| Base year | 2025 |
| Historic period | 2020-2024 |
| Forecast period | 2026-2030 |
| Growth momentum & CAGR | Accelerate at a CAGR of 31.6% |
| Market growth 2026-2030 | USD 721.5 million |
| Market structure | Fragmented |
| YoY growth 2025-2026(%) | 28.1% |
| Key countries | Australia |
| Competitive landscape | Leading Companies, Market Positioning of Companies, Competitive Strategies, and Industry Risks |
Research Analyst Overview
- The clear aligners market in Australia is defined by rapid innovation in orthodontic materials and digital orthodontic solutions. The shift toward direct 3D printing and the use of high-performance, medical-grade polymers, including shape-memory polymers, are enhancing the biomechanical force of orthodontic appliances.
- This technological leap impacts boardroom decisions regarding capital expenditure on manufacturing, with a focus on sustainable orthodontic practices and circular economy principles, leading some manufacturers to achieve over a 40% reduction in material waste. The landscape includes everything from comprehensive cosmetic orthodontic systems to targeted short-term orthodontic aligners and the removable orthodontic device.
- Offerings like custom clear aligners, transparent aligners, and dental aligner systems are now standard. Advanced features such as mandibular advancement and occlusal blocks address more complex cases. Success hinges on a streamlined digital workflow, effective teledentistry platforms, and strong clinical oversight to ensure patient compliance and superior clinical outcomes.
- Navigating challenges like insurance reimbursement and regulatory compliance while capitalizing on the demand for aesthetic dentistry remains critical for all players, including those using direct-to-consumer models.
What are the Key Data Covered in this Australia Clear Aligners Market Research and Growth Report?
-
What is the expected growth of the Australia Clear Aligners Market between 2026 and 2030?
-
USD 721.5 million, at a CAGR of 31.6%
-
-
What segmentation does the market report cover?
-
The report is segmented by Distribution Channel (Offline, and Online), Age Group (Adults, and Teens), End-user (Dental clinics, Hospitals, and Others), Material (Polyurethane, Polyethylene terephthalate glycol (PETG), Polyvinyl chloride (PVC), and Others) and Geography (APAC)
-
-
Which regions are analyzed in the report?
-
APAC
-
-
What are the key growth drivers and market challenges?
-
Rising demand for aesthetic dentistry and adult orthodontics, High initial costs and limited insurance reimbursement structures
-
-
Who are the major players in the Australia Clear Aligners Market?
-
3M Co., Align Technology Inc., Angelalign Technology. Ltd., Argen Corp., Bernhard Forster GmbH, ClearPath Orthodontics, Creative Smiles, Dentsply Sirona Inc., Envista Holdings Corp., EZ SMILE, Henry Schein Inc., Inman Aligner, Institut Straumann AG, K-Line Global, SCHEU DENTAL GmbH and Six Month Smiles
-
Market Research Insights
- Market dynamics are increasingly shaped by the push for accessible and efficient treatments, where the adoption of a direct-to-clinic supply model has been shown to reduce procurement lead times by up to 25%.
- The rise of hybrid teledentistry models, blending remote monitoring with essential in-person visits, caters to consumer demand for convenience, with practices reporting a 15% increase in patient engagement for such programs. As end-to-end digital dentistry becomes more prevalent, the focus shifts to optimizing cloud-based management platforms and robust clinical education programs.
- This ensures that professionally supervised treatment remains the standard, even as delivery models evolve, with digitally-equipped clinics showing a 20% improvement in treatment predictability over those with less integrated systems.
We can help! Our analysts can customize this australia clear aligners market research report to meet your requirements.
 RIA -
RIA - 
