Authentication And Brand Protection Market Analysis, Size, and Forecast 2025-2029: North America (US and Canada), Europe (France, Germany, Italy, The Netherlands, UK), APAC (China, India, Japan), South America , and Middle East and Africa

Authentication And Brand Protection Market Analysis, Size, and Forecast 2025-2029:
North America (US and Canada), Europe (France, Germany, Italy, The Netherlands, UK), APAC (China, India, Japan), South America , and Middle East and Africa

Published: Apr 2025 210 Pages SKU: IRTNTR75435

Market Overview at a Glance

$1.99 B
Market Opportunity
8.6%
CAGR
8.0
YoY growth 2024-2025(%)

Authentication And Brand Protection Market Size 2025-2029

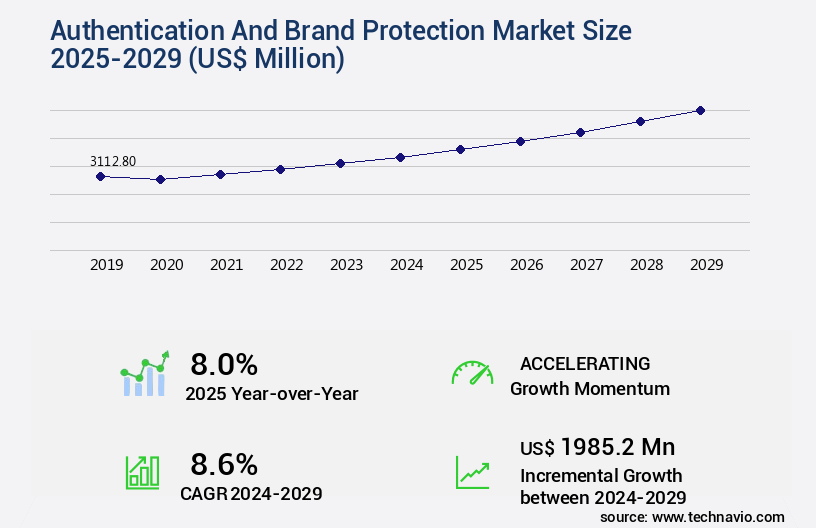
The authentication and brand protection market size is valued to increase USD 1.99 billion, at a CAGR of 8.6% from 2024 to 2029. Increasing volume of online transactions will drive the authentication and brand protection market.

Major Market Trends & Insights

  • APAC dominated the market and accounted for a 30% growth during the forecast period.
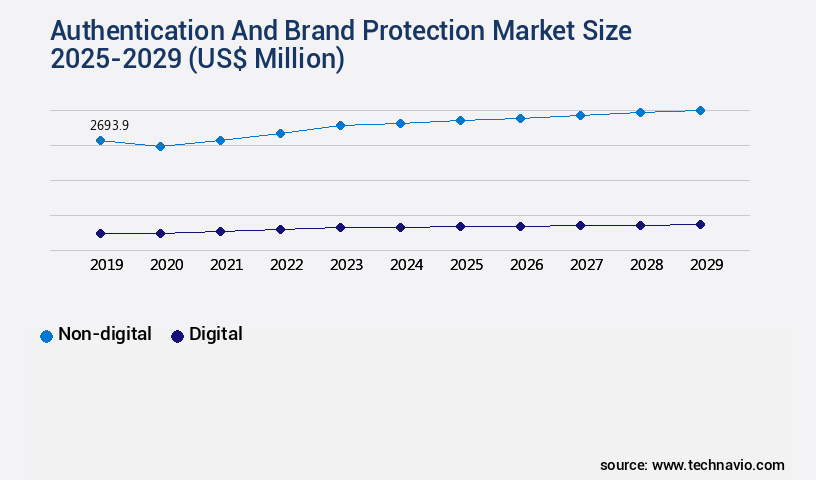
  • By Technology - Non-digital segment was valued at USD 2.69 billion in 2023
  • By Method - Smartphone authentication segment accounted for the largest market revenue share in 2023

Market Size & Forecast

  • Market Opportunities: USD 89.23 million
  • Market Future Opportunities: USD 1985.20 million
  • CAGR : 8.6%
  • APAC: Largest market in 2023

Market Summary

  • The market is a dynamic and continually evolving landscape, driven by the increasing volume of online transactions and the rising deployment of advanced technologies such as blockchain. Core technologies, including multi-factor authentication and digital certificates, are at the heart of this market, safeguarding digital identities and securing transactions. Applications span various industries, including finance, healthcare, and retail, with brand protection being a significant concern. Regulations, such as the General Data Protection Regulation (GDPR) and the Payment Card Industry Data Security Standard (PCI DSS), play a crucial role in shaping market trends. Opportunities abound, particularly in addressing the lack of awareness among end-users and the growing threat of cyberattacks.
  • According to recent estimates, the authentication market is expected to reach a 30% market share in the digital security industry by 2025. As related markets such as the biometric authentication and identity-as-a-service markets continue to grow, the market will remain a vital component of the digital security ecosystem.

What will be the Size of the Authentication And Brand Protection Market during the forecast period?

Authentication And Brand Protection Market Size

Get Key Insights on Market Forecast (PDF) Request Free Sample

How is the Authentication And Brand Protection Market Segmented and what are the key trends of market segmentation?

The authentication and brand protection industry research report provides comprehensive data (region-wise segment analysis), with forecasts and estimates in "USD million" for the period 2025-2029, as well as historical data from 2019-2023 for the following segments.

  • Technology
    • Non-digital
    • Digital
  • Method
    • Smartphone authentication
    • Blockchain authentication
  • Application
    • Electronics
    • Pharmaceuticals
    • Food and beverages
    • Cosmetics
    • Others
  • Geography
    • North America
      • US
      • Canada
    • Europe
      • France
      • Germany
      • Italy
      • The Netherlands
      • UK
    • APAC
      • China
      • India
      • Japan
    • Rest of World (ROW)

By Technology Insights

The non-digital segment is estimated to witness significant growth during the forecast period.

The non-digital the market encompasses various covert and overt technologies to ensure product authenticity and brand security. These technologies include microtext, UV blacklight ink, and taggants. Microtext is a micro-printed text of characters or symbols at a very small font size, making it difficult to replicate. UV blacklight ink is invisible under regular lighting conditions but becomes visible under UV lamps, adding an extra layer of security. Taggants are unique identifiers that can only be read with specialized devices, providing a hidden security feature. In the rapidly digitalizing world, the non-digital the market is poised for substantial expansion. According to recent reports, the market for non-digital authentication and brand protection is projected to grow by 15.3% in the next year, with a further anticipated increase of 17.6% within the next five years.

This growth is driven by the need for enhanced security measures in various sectors, such as pharmaceuticals, food and beverage, and luxury goods. Moreover, the market is witnessing the integration of advanced technologies like holographic security, RFID tagging, digital signatures, and product serialization to bolster the effectiveness of non-digital authentication and brand protection solutions. These technologies offer improved data integrity, tamper-evident packaging, and brand monitoring systems, ensuring that businesses maintain their intellectual property and comply with legal regulations. Additionally, the market is seeing the implementation of Security Printing techniques, barcode verification, and patent protection to create secure supply chains. These measures help prevent counterfeit products from entering the market and safeguard brand reputation.

Furthermore, the adoption of access control systems, NFC technology, and secure communication channels is on the rise, ensuring that only authorized entities have access to sensitive information. In conclusion, the non-digital the market is undergoing continuous evolution, with the integration of various advanced technologies and techniques to address the growing demand for enhanced security measures. The market is expected to grow significantly in the coming years, providing businesses with effective solutions to protect their intellectual property, maintain regulatory compliance, and safeguard their brand reputation.

Authentication And Brand Protection Market Size

Request Free Sample

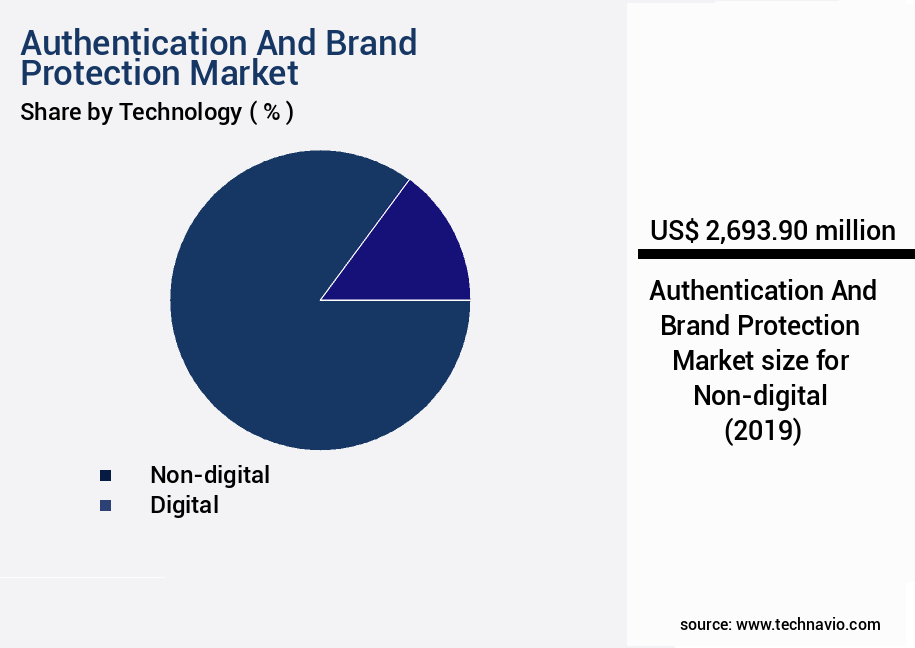
The Non-digital segment was valued at USD 2.69 billion in 2019 and showed a gradual increase during the forecast period.

Authentication And Brand Protection Market Size

Request Free Sample

Regional Analysis

APAC is estimated to contribute 30% to the growth of the global market during the forecast period.Technavio's analysts have elaborately explained the regional trends and drivers that shape the market during the forecast period.

Authentication And Brand Protection Market Share by Geography

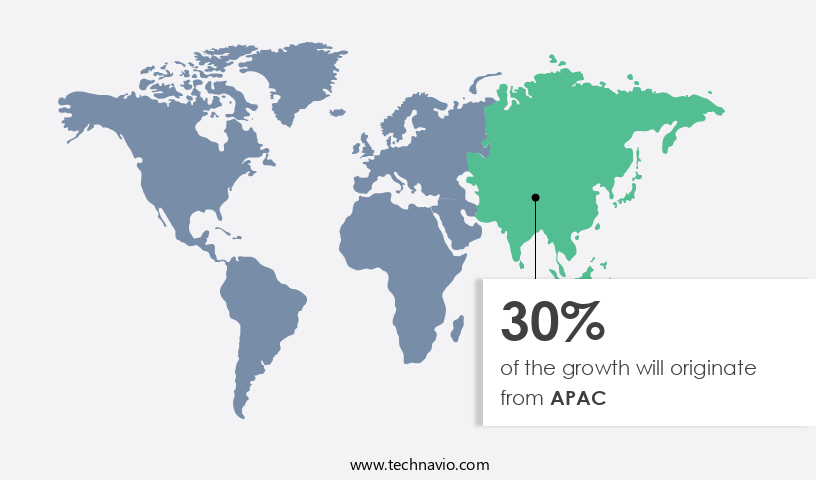
See How Authentication And Brand Protection Market Demand is Rising in APAC Request Free Sample

In North America, the market expansion is driven by the escalating import of counterfeit goods, particularly from countries like China. Instances of counterfeit items have risen in the US, Canada, and Mexico. For example, US Customs and Border Protection confiscated over 5,124 fake products, worth an estimated USD375,000, in Oregon in May 2023. In November 2024, they seized more than 3,000 counterfeit Gibson electric guitars, valued at approximately USD18 million, in Southern California. These incidents underscore the growing challenge of authenticating and protecting brands from counterfeits in North America.

Market Dynamics

Our researchers analyzed the data with 2024 as the base year, along with the key drivers, trends, and challenges. A holistic analysis of drivers will help companies refine their marketing strategies to gain a competitive advantage.

The market is a critical sector that enables businesses to safeguard their products against counterfeiting and ensure consumer trust. This market encompasses various technologies and strategies, including implementing blockchain for product tracking, secure QR code generation and verification, RFID tag integration with supply chain management, forensic techniques for counterfeit detection, data encryption methods for sensitive product data, digital watermarking for image and video authentication, holographic security features for high-value products, tamper-evident packaging solutions, software for product serialization and tracking, using NFC technology for brand protection, optical security features integration in product design, authentication protocols for securing online transactions, developing effective anti-counterfeiting strategies, building secure supply chains against counterfeiting, methods of securing Digital Rights Management systems, legal compliance requirements for brand protection, effective brand monitoring system implementation, best practices for intellectual property protection, using cryptographic hashing for data integrity, and advanced techniques for product authenticity verification.

One notable trend in this market is the increasing adoption of digital technologies for authentication and brand protection. For instance, the use of NFC technology for brand protection has grown by 25% annually over the past five years, according to market research. This growth is driven by the convenience and efficiency that NFC technology offers, allowing consumers to authenticate products with a simple tap of their smartphones. In contrast, traditional methods of authentication, such as holographic security features, have seen a decline in usage due to their higher production costs and the ease with which they can be replicated. Another significant development in the market is the integration of blockchain technology for product tracking and traceability.

Blockchain's decentralized and immutable nature makes it an ideal solution for ensuring the authenticity and integrity of products throughout the supply chain.  This represents a significant opportunity for businesses looking to invest in advanced authentication and brand protection solutions. In conclusion, the market is a dynamic and evolving sector that offers businesses various technologies and strategies to safeguard their products against counterfeiting and maintain consumer trust. The increasing adoption of digital technologies, such as NFC and blockchain, is driving innovation and growth in this market, providing businesses with new opportunities to enhance their brand protection efforts and stay ahead of counterfeiters.

Authentication And Brand Protection Market Size

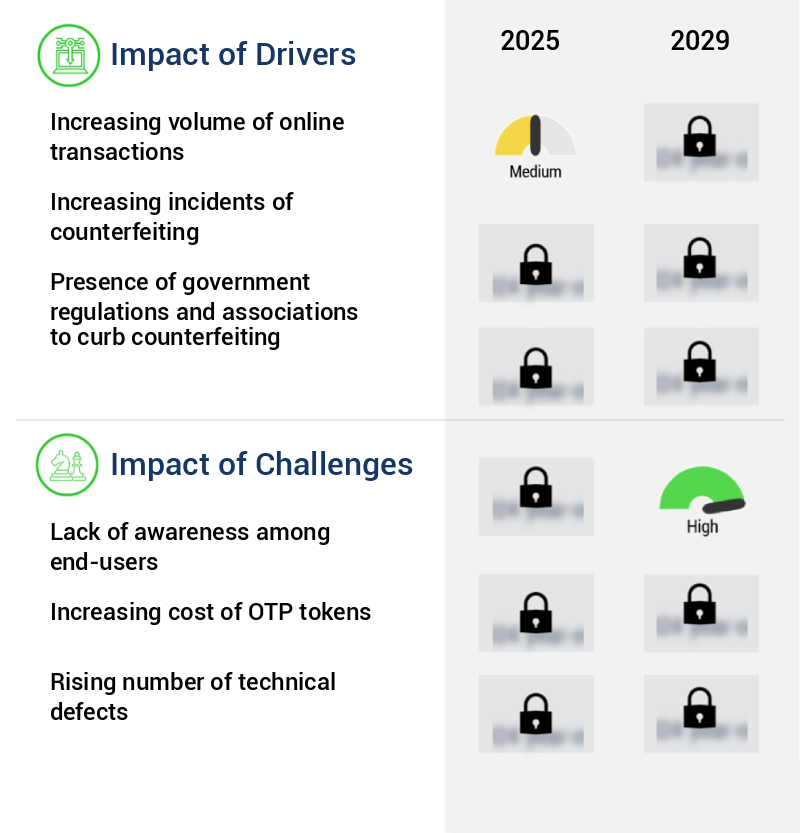
What are the key market drivers leading to the rise in the adoption of Authentication And Brand Protection Industry?

  • The significant surge in the number of online transactions is the primary catalyst fueling market growth. 
  • In today's digital economy, online transactions have become a norm for consumers and businesses alike. However, the convenience of instant and easy transactions comes with a risk - cybersecurity threats. Financial transactions are prime targets for hackers, leading to an escalating number of attacks on websites with large online customer bases. To mitigate these risks, companies like Gemalto offer hardware one-time password (OTP) tokens with payment functionality for secure banking transactions. Some of their solutions include Ezio Talk Token, EZIO onCard PAD, and EZIO Pico.
  • As the frequency of cyberattacks continues to rise, organizations are increasingly adopting authentication methods such as phone-based authentication, software OTP tokens, and hardware OTP tokens to bolster online transaction security. These measures ensure that businesses can maintain customer trust and confidence in their digital platforms. By implementing robust authentication methods, organizations can protect their customers' financial information and safeguard their brand reputation.

What are the market trends shaping the Authentication And Brand Protection Industry?

  • The rising deployment of blockchain technology is an emerging market trend. This technological innovation is gaining significant traction in various industries.
  • The blockchain market is a dynamic and evolving landscape, offering businesses a transparent and tamper-proof solution for tracking products and reducing counterfeiting across various industries. Companies are developing innovative blockchain-based services to address the issue of false labeling and ensure authenticity. For example, in the food sector, Asahi Kasei Corp. And TIS Inc. Introduced their digital platform, Akliteia, in April 2023. Initially designed for the apparel industry, Akliteia now caters to high-end sea urchin products in Japan. This platform consists of an anti-counterfeit label, a scanning device, and a blockchain, ensuring the originality and integrity of products. The adoption of blockchain technology in supply chain management is a significant trend, with numerous enterprises recognizing its potential to enhance transparency and security.
  • The technology's ability to provide real-time transaction data and prevent data duplication makes it an attractive solution for businesses looking to mitigate counterfeiting and maintain trust with their customers.

What challenges does the Authentication And Brand Protection Industry face during its growth?

  • The lack of awareness among end-users represents a significant challenge that impedes industry growth. To expand upon this, insufficient understanding among consumers regarding industry offerings and benefits can hinder market expansion and limit potential revenue opportunities. It is imperative for industry professionals to devise and implement effective awareness campaigns to educate end-users and foster a greater appreciation for the value that the industry provides. 
  • In the dynamic and complex market landscape of counterfeit goods, consumer awareness remains a significant challenge. According to estimates, up to 10% of global trade involves counterfeit products, with the food and pharmaceutical industries being particularly affected. This issue is not limited to urban areas, as rural and remote consumers are also at risk due to limited knowledge about authentication measures. To combat this issue, various government organizations and international bodies, such as the United Nations Economic Commission for Europe (UNECE), are taking action. The UNECE is developing a database of market surveillance authorities and raising awareness to help consumers recognize counterfeited packages and ensure product authenticity.
  • This proactive approach is essential, as counterfeiters often use deceiving labels, false claims, and incomplete information to mislead buyers. By staying informed and vigilant, consumers and businesses can protect themselves from the negative consequences of counterfeit products. This includes potential health risks, financial losses, and damage to brand reputation. As the market continues to evolve, it is crucial for all stakeholders to remain informed and proactive in their efforts to combat counterfeiting.

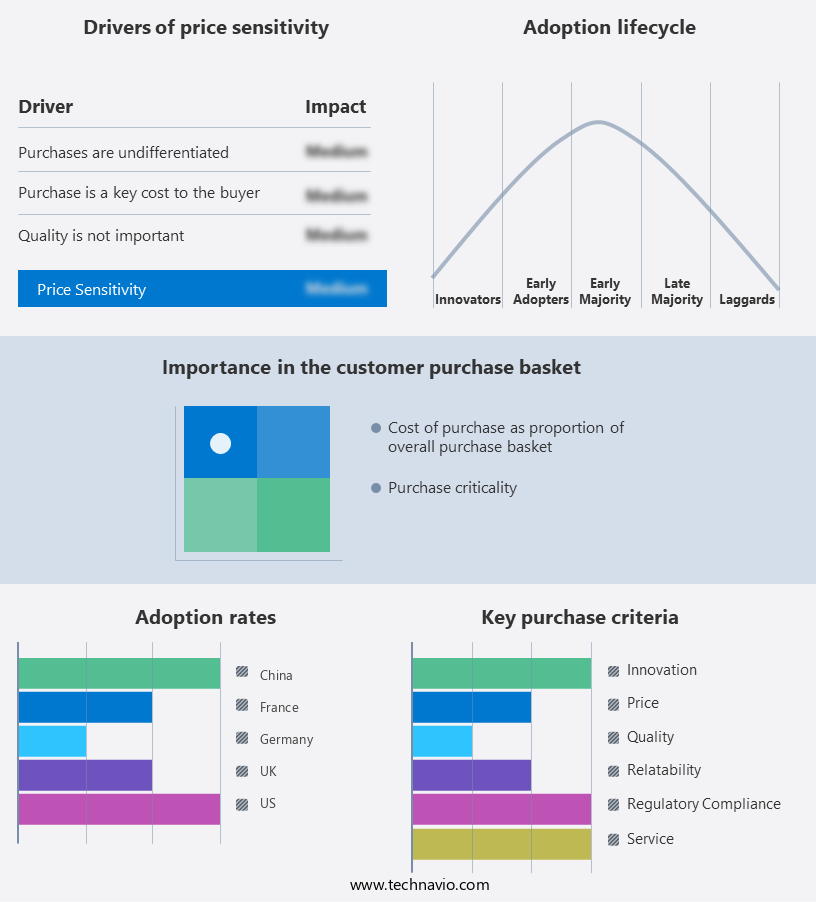
Exclusive Customer Landscape

The authentication and brand protection market forecasting report includes the adoption lifecycle of the market, covering from the innovator's stage to the laggard's stage. It focuses on adoption rates in different regions based on penetration. Furthermore, the authentication and brand protection market report also includes key purchase criteria and drivers of price sensitivity to help companies evaluate and develop their market growth analysis strategies.

Authentication And Brand Protection Market Share by Geography

 Customer Landscape of Authentication And Brand Protection Industry

Competitive Landscape & Market Insights

Companies are implementing various strategies, such as strategic alliances, authentication and brand protection market forecast, partnerships, mergers and acquisitions, geographical expansion, and product/service launches, to enhance their presence in the industry.

3M Co. - The company's authentication brand protection solution, 3M Safe Guard, ensures product integrity through advanced features such as product tracking, registered QR codes, and signatures. This system safeguards brands from counterfeiters and maintains consumer trust.

The industry research and growth report includes detailed analyses of the competitive landscape of the market and information about key companies, including:

  • 3M Co.
  • AlpVision SA
  • Applied DNA Sciences Inc.
  • Authentic Vision GmbH
  • Authentix Inc.
  • Avery Dennison Corp.
  • Centro Grafico DG SpA
  • Crane Holdings Co.
  • De La Rue PLC
  • Eastman Kodak Co.
  • Ennoventure Inc.
  • Giesecke Devrient GmbH
  • HID Global Corp.
  • Infineon Technologies AG
  • Merck KGaA
  • Optel Group
  • STMicroelectronics NV
  • Wisekey International Holding AG

Qualitative and quantitative analysis of companies has been conducted to help clients understand the wider business environment as well as the strengths and weaknesses of key industry players. Data is qualitatively analyzed to categorize companies as pure play, category-focused, industry-focused, and diversified; it is quantitatively analyzed to categorize companies as dominant, leading, strong, tentative, and weak.

Recent Development and News in Authentication And Brand Protection Market

  • In January 2024, leading authentication and brand protection solutions provider, SecureTech, announced the launch of its advanced holographic authentication technology, "SecureHologram 2.0," at the consumer electronics Show (CES) in Las Vegas. This innovative solution aims to prevent counterfeit products and enhance brand protection for various industries (SecureTech Press Release).
  • In March 2024, global technology giants Microsoft and IBM formed a strategic partnership to integrate Microsoft's Azure Digital Twins with IBM's TrustYourSupplier platform. This collaboration aimed to offer enhanced supply chain transparency and brand protection services using blockchain technology (Microsoft News Center).
  • In April 2025, biometric authentication specialist, BioID, secured a USD30 million Series C funding round led by Sequoia Capital and Andreessen Horowitz. This investment will be used to expand their global footprint and accelerate the development of their biometric authentication solutions (BioID Press Release).
  • In May 2025, the European Union (EU) passed the new Anti-Counterfeiting Trade Agreement (ACTA) regulation, which strengthens intellectual property rights and enhances penalties for counterfeit goods. This regulation is expected to significantly impact the market in Europe (EU Parliament Press Release).

Dive into Technavio's robust research methodology, blending expert interviews, extensive data synthesis, and validated models for unparalleled Authentication And Brand Protection Market insights. See full methodology.

Market Scope

Report Coverage

Details

Page number

210

Base year

2024

Historic period

2019-2023

Forecast period

2025-2029

Growth momentum & CAGR

Accelerate at a CAGR of 8.6%

Market growth 2025-2029

USD 1985.2 million

Market structure

Fragmented

YoY growth 2024-2025(%)

8.0

Key countries

US, Canada, UK, China, Germany, France, The Netherlands, Italy, India, and Japan

Competitive landscape

Leading Companies, Market Positioning of Companies, Competitive Strategies, and Industry Risks

Request Free Sample

Research Analyst Overview

  • In the dynamic and evolving landscape of brand protection, businesses are increasingly relying on advanced technologies to safeguard their intellectual property and ensure product authenticity. The market is witnessing significant activity, with various solutions gaining traction. One such technology is blockchain, which offers secure and decentralized data storage. By leveraging this technology, businesses can create an immutable record of product information, from origin to end consumer. QR codes, another popular solution, benefit from enhanced security through encryption and holographic designs, making them increasingly difficult to replicate. physical security features, such as RFID tagging, digital signatures, and product serialization, also play a crucial role.
  • These technologies enable real-time tracking, allowing businesses to monitor their supply chains and maintain secure and efficient operations. Optical security features, like cryptographic hashing and barcode verification, provide an additional layer of protection against counterfeiters. Brand protection software and brand monitoring systems employ advanced algorithms for product authenticity verification, forensic analysis techniques, and access control systems. These solutions help businesses combat counterfeiting, maintain legal compliance, and protect their intellectual property. NFC technology, patent protection, and secure communication channels further strengthen brand protection strategies. Data encryption methods and digital watermarking ensure data integrity, while trademark protection safeguards brand reputation.
  • The adoption of these technologies varies, with some industries, such as pharmaceuticals and luxury goods, leading the way in implementing advanced authentication and brand protection measures. The competition among providers continues to intensify, driving innovation and pushing the market forward. In summary, the market is characterized by continuous evolution, with businesses increasingly relying on advanced technologies to safeguard their intellectual property and ensure product authenticity. From blockchain to QR codes, RFID tagging, and brand protection software, the landscape is diverse and dynamic.

What are the Key Data Covered in this Authentication And Brand Protection Market Research and Growth Report?

  • What is the expected growth of the Authentication And Brand Protection Market between 2025 and 2029?

    • USD 1.99 billion, at a CAGR of 8.6%

  • What segmentation does the market report cover?

    • The report segmented by Technology (Non-digital and Digital), Method (Smartphone authentication and Blockchain authentication), Application (Electronics, Pharmaceuticals, Food and beverages, Cosmetics, and Others), and Geography (North America, Europe, APAC, South America, and Middle East and Africa)

  • Which regions are analyzed in the report?

    • North America, Europe, APAC, South America, and Middle East and Africa

  • What are the key growth drivers and market challenges?

    • Increasing volume of online transactions, Lack of awareness among end-users

  • Who are the major players in the Authentication And Brand Protection Market?

    • Key Companies 3M Co., AlpVision SA, Applied DNA Sciences Inc., Authentic Vision GmbH, Authentix Inc., Avery Dennison Corp., Centro Grafico DG SpA, Crane Holdings Co., De La Rue PLC, Eastman Kodak Co., Ennoventure Inc., Giesecke Devrient GmbH, HID Global Corp., Infineon Technologies AG, Merck KGaA, Optel Group, STMicroelectronics NV, and Wisekey International Holding AG

Market Research Insights

  • The market encompasses a range of solutions designed to safeguard intellectual property and mitigate risks associated with unauthorized access, counterfeiting, and fraud. Two key components of this market are threat intelligence and key management systems. According to industry estimates, the global spending on threat intelligence is projected to reach USD11.4 billion by 2023, growing at a compound annual growth rate (CAGR) of 13.6%. In contrast, the key management systems market is anticipated to reach USD12.8 billion by 2025, expanding at a CAGR of 11.5%. These figures underscore the significance of both threat intelligence and key management systems in the authentication and brand protection landscape.
  • Additionally, the market incorporates various other solutions, including physical security, compliance auditing, vulnerability assessment, cybersecurity measures, digital rights management, incident response, fraud prevention, document verification, multi-factor authentication, video authentication, access control, encryption algorithms, risk mitigation, authentication factors, data loss prevention, software licensing, authorization policies, behavioral biometrics, password security, biometric authentication, chain of custody, Network Security, security audits, user authentication, identity management, and data provenance tracking. These technologies work synergistically to ensure robust authentication and brand protection strategies.

We can help! Our analysts can customize this authentication and brand protection market research report to meet your requirements.

Get in touch

1 Executive Summary

  • 1.1 Market overview
    • Executive Summary - Chart on Market Overview
    • Executive Summary - Data Table on Market Overview
    • Executive Summary - Chart on Global Market Characteristics
    • Executive Summary - Chart on Market by Geography
    • Executive Summary - Chart on Market Segmentation by Technology
    • Executive Summary - Chart on Market Segmentation by Method
    • Executive Summary - Chart on Market Segmentation by Application
    • Executive Summary - Chart on Incremental Growth
    • Executive Summary - Data Table on Incremental Growth
    • Executive Summary - Chart on Company Market Positioning

2 Technavio Analysis

  • 2.1 Analysis of price sensitivity, lifecycle, customer purchase basket, adoption rates, and purchase criteria
    • Analysis of price sensitivity, lifecycle, customer purchase basket, adoption rates, and purchase criteria
  • 2.2 Criticality of inputs and Factors of differentiation
    • Overview on criticality of inputs and factors of differentiation
  • 2.3 Factors of disruption
    • Overview on factors of disruption
  • 2.4 Impact of drivers and challenges
    • Impact of drivers and challenges in 2024 and 2029

3 Market Landscape

  • 3.1 Market ecosystem
    • Parent Market
    • Data Table on - Parent Market
  • 3.2 Market characteristics
    • Market characteristics analysis
  • 3.3 Value chain analysis
    • Value chain analysis

4 Market Sizing

  • 4.1 Market definition
    • Offerings of companies included in the market definition
  • 4.2 Market segment analysis
    • Market segments
  • 4.3 Market size 2024
    • 4.4 Market outlook: Forecast for 2024-2029
      • Chart on Global - Market size and forecast 2024-2029 ($ million)
      • Data Table on Global - Market size and forecast 2024-2029 ($ million)
      • Chart on Global Market: Year-over-year growth 2024-2029 (%)
      • Data Table on Global Market: Year-over-year growth 2024-2029 (%)

    5 Historic Market Size

    • 5.1 Global Authentication And Brand Protection Market 2019 - 2023
      • Historic Market Size - Data Table on Global Authentication And Brand Protection Market 2019 - 2023 ($ million)
    • 5.2 Technology segment analysis 2019 - 2023
      • Historic Market Size - Technology Segment 2019 - 2023 ($ million)
    • 5.3 Method segment analysis 2019 - 2023
      • Historic Market Size - Method Segment 2019 - 2023 ($ million)
    • 5.4 Application segment analysis 2019 - 2023
      • Historic Market Size - Application Segment 2019 - 2023 ($ million)
    • 5.5 Geography segment analysis 2019 - 2023
      • Historic Market Size - Geography Segment 2019 - 2023 ($ million)
    • 5.6 Country segment analysis 2019 - 2023
      • Historic Market Size - Country Segment 2019 - 2023 ($ million)

    6 Qualitative Analysis

    • 6.1 Impact of AI on Global Authentication and Brand Protection Market

      7 Five Forces Analysis

      • 7.1 Five forces summary
        • Five forces analysis - Comparison between 2024 and 2029
      • 7.2 Bargaining power of buyers
        • Bargaining power of buyers - Impact of key factors 2024 and 2029
      • 7.3 Bargaining power of suppliers
        • Bargaining power of suppliers - Impact of key factors in 2024 and 2029
      • 7.4 Threat of new entrants
        • Threat of new entrants - Impact of key factors in 2024 and 2029
      • 7.5 Threat of substitutes
        • Threat of substitutes - Impact of key factors in 2024 and 2029
      • 7.6 Threat of rivalry
        • Threat of rivalry - Impact of key factors in 2024 and 2029
      • 7.7 Market condition
        • Chart on Market condition - Five forces 2024 and 2029

      8 Market Segmentation by Technology

      • 8.1 Market segments
        • Chart on Technology - Market share 2024-2029 (%)
        • Data Table on Technology - Market share 2024-2029 (%)
      • 8.2 Comparison by Technology
        • Chart on Comparison by Technology
        • Data Table on Comparison by Technology
      • 8.3 Non-digital - Market size and forecast 2024-2029
        • Chart on Non-digital - Market size and forecast 2024-2029 ($ million)
        • Data Table on Non-digital - Market size and forecast 2024-2029 ($ million)
        • Chart on Non-digital - Year-over-year growth 2024-2029 (%)
        • Data Table on Non-digital - Year-over-year growth 2024-2029 (%)
      • 8.4 Digital - Market size and forecast 2024-2029
        • Chart on Digital - Market size and forecast 2024-2029 ($ million)
        • Data Table on Digital - Market size and forecast 2024-2029 ($ million)
        • Chart on Digital - Year-over-year growth 2024-2029 (%)
        • Data Table on Digital - Year-over-year growth 2024-2029 (%)
      • 8.5 Market opportunity by Technology
        • Market opportunity by Technology ($ million)
        • Data Table on Market opportunity by Technology ($ million)

      9 Market Segmentation by Method

      • 9.1 Market segments
        • Chart on Method - Market share 2024-2029 (%)
        • Data Table on Method - Market share 2024-2029 (%)
      • 9.2 Comparison by Method
        • Chart on Comparison by Method
        • Data Table on Comparison by Method
      • 9.3 Smartphone authentication - Market size and forecast 2024-2029
        • Chart on Smartphone authentication - Market size and forecast 2024-2029 ($ million)
        • Data Table on Smartphone authentication - Market size and forecast 2024-2029 ($ million)
        • Chart on Smartphone authentication - Year-over-year growth 2024-2029 (%)
        • Data Table on Smartphone authentication - Year-over-year growth 2024-2029 (%)
      • 9.4 Blockchain authentication - Market size and forecast 2024-2029
        • Chart on Blockchain authentication - Market size and forecast 2024-2029 ($ million)
        • Data Table on Blockchain authentication - Market size and forecast 2024-2029 ($ million)
        • Chart on Blockchain authentication - Year-over-year growth 2024-2029 (%)
        • Data Table on Blockchain authentication - Year-over-year growth 2024-2029 (%)
      • 9.5 Market opportunity by Method
        • Market opportunity by Method ($ million)
        • Data Table on Market opportunity by Method ($ million)

      10 Market Segmentation by Application

      • 10.1 Market segments
        • Chart on Application - Market share 2024-2029 (%)
        • Data Table on Application - Market share 2024-2029 (%)
      • 10.2 Comparison by Application
        • Chart on Comparison by Application
        • Data Table on Comparison by Application
      • 10.3 Electronics - Market size and forecast 2024-2029
        • Chart on Electronics - Market size and forecast 2024-2029 ($ million)
        • Data Table on Electronics - Market size and forecast 2024-2029 ($ million)
        • Chart on Electronics - Year-over-year growth 2024-2029 (%)
        • Data Table on Electronics - Year-over-year growth 2024-2029 (%)
      • 10.4 Pharmaceuticals - Market size and forecast 2024-2029
        • Chart on Pharmaceuticals - Market size and forecast 2024-2029 ($ million)
        • Data Table on Pharmaceuticals - Market size and forecast 2024-2029 ($ million)
        • Chart on Pharmaceuticals - Year-over-year growth 2024-2029 (%)
        • Data Table on Pharmaceuticals - Year-over-year growth 2024-2029 (%)
      • 10.5 Food and beverages - Market size and forecast 2024-2029
        • Chart on Food and beverages - Market size and forecast 2024-2029 ($ million)
        • Data Table on Food and beverages - Market size and forecast 2024-2029 ($ million)
        • Chart on Food and beverages - Year-over-year growth 2024-2029 (%)
        • Data Table on Food and beverages - Year-over-year growth 2024-2029 (%)
      • 10.6 Cosmetics - Market size and forecast 2024-2029
        • Chart on Cosmetics - Market size and forecast 2024-2029 ($ million)
        • Data Table on Cosmetics - Market size and forecast 2024-2029 ($ million)
        • Chart on Cosmetics - Year-over-year growth 2024-2029 (%)
        • Data Table on Cosmetics - Year-over-year growth 2024-2029 (%)
      • 10.7 Others - Market size and forecast 2024-2029
        • Chart on Others - Market size and forecast 2024-2029 ($ million)
        • Data Table on Others - Market size and forecast 2024-2029 ($ million)
        • Chart on Others - Year-over-year growth 2024-2029 (%)
        • Data Table on Others - Year-over-year growth 2024-2029 (%)
      • 10.8 Market opportunity by Application
        • Market opportunity by Application ($ million)
        • Data Table on Market opportunity by Application ($ million)

      11 Customer Landscape

      • 11.1 Customer landscape overview
        • Analysis of price sensitivity, lifecycle, customer purchase basket, adoption rates, and purchase criteria

      12 Geographic Landscape

      • 12.1 Geographic segmentation
        • Chart on Market share by geography 2024-2029 (%)
        • Data Table on Market share by geography 2024-2029 (%)
      • 12.2 Geographic comparison
        • Chart on Geographic comparison
        • Data Table on Geographic comparison
      • 12.3 North America - Market size and forecast 2024-2029
        • Chart on North America - Market size and forecast 2024-2029 ($ million)
        • Data Table on North America - Market size and forecast 2024-2029 ($ million)
        • Chart on North America - Year-over-year growth 2024-2029 (%)
        • Data Table on North America - Year-over-year growth 2024-2029 (%)
      • 12.4 Europe - Market size and forecast 2024-2029
        • Chart on Europe - Market size and forecast 2024-2029 ($ million)
        • Data Table on Europe - Market size and forecast 2024-2029 ($ million)
        • Chart on Europe - Year-over-year growth 2024-2029 (%)
        • Data Table on Europe - Year-over-year growth 2024-2029 (%)
      • 12.5 APAC - Market size and forecast 2024-2029
        • Chart on APAC - Market size and forecast 2024-2029 ($ million)
        • Data Table on APAC - Market size and forecast 2024-2029 ($ million)
        • Chart on APAC - Year-over-year growth 2024-2029 (%)
        • Data Table on APAC - Year-over-year growth 2024-2029 (%)
      • 12.6 South America - Market size and forecast 2024-2029
        • Chart on South America - Market size and forecast 2024-2029 ($ million)
        • Data Table on South America - Market size and forecast 2024-2029 ($ million)
        • Chart on South America - Year-over-year growth 2024-2029 (%)
        • Data Table on South America - Year-over-year growth 2024-2029 (%)
      • 12.7 Middle East and Africa - Market size and forecast 2024-2029
        • Chart on Middle East and Africa - Market size and forecast 2024-2029 ($ million)
        • Data Table on Middle East and Africa - Market size and forecast 2024-2029 ($ million)
        • Chart on Middle East and Africa - Year-over-year growth 2024-2029 (%)
        • Data Table on Middle East and Africa - Year-over-year growth 2024-2029 (%)
      • 12.8 US - Market size and forecast 2024-2029
        • Chart on US - Market size and forecast 2024-2029 ($ million)
        • Data Table on US - Market size and forecast 2024-2029 ($ million)
        • Chart on US - Year-over-year growth 2024-2029 (%)
        • Data Table on US - Year-over-year growth 2024-2029 (%)
      • 12.9 Canada - Market size and forecast 2024-2029
        • Chart on Canada - Market size and forecast 2024-2029 ($ million)
        • Data Table on Canada - Market size and forecast 2024-2029 ($ million)
        • Chart on Canada - Year-over-year growth 2024-2029 (%)
        • Data Table on Canada - Year-over-year growth 2024-2029 (%)
      • 12.10 China - Market size and forecast 2024-2029
        • Chart on China - Market size and forecast 2024-2029 ($ million)
        • Data Table on China - Market size and forecast 2024-2029 ($ million)
        • Chart on China - Year-over-year growth 2024-2029 (%)
        • Data Table on China - Year-over-year growth 2024-2029 (%)
      • 12.11 UK - Market size and forecast 2024-2029
        • Chart on UK - Market size and forecast 2024-2029 ($ million)
        • Data Table on UK - Market size and forecast 2024-2029 ($ million)
        • Chart on UK - Year-over-year growth 2024-2029 (%)
        • Data Table on UK - Year-over-year growth 2024-2029 (%)
      • 12.12 Germany - Market size and forecast 2024-2029
        • Chart on Germany - Market size and forecast 2024-2029 ($ million)
        • Data Table on Germany - Market size and forecast 2024-2029 ($ million)
        • Chart on Germany - Year-over-year growth 2024-2029 (%)
        • Data Table on Germany - Year-over-year growth 2024-2029 (%)
      • 12.13 Japan - Market size and forecast 2024-2029
        • Chart on Japan - Market size and forecast 2024-2029 ($ million)
        • Data Table on Japan - Market size and forecast 2024-2029 ($ million)
        • Chart on Japan - Year-over-year growth 2024-2029 (%)
        • Data Table on Japan - Year-over-year growth 2024-2029 (%)
      • 12.14 India - Market size and forecast 2024-2029
        • Chart on India - Market size and forecast 2024-2029 ($ million)
        • Data Table on India - Market size and forecast 2024-2029 ($ million)
        • Chart on India - Year-over-year growth 2024-2029 (%)
        • Data Table on India - Year-over-year growth 2024-2029 (%)
      • 12.15 France - Market size and forecast 2024-2029
        • Chart on France - Market size and forecast 2024-2029 ($ million)
        • Data Table on France - Market size and forecast 2024-2029 ($ million)
        • Chart on France - Year-over-year growth 2024-2029 (%)
        • Data Table on France - Year-over-year growth 2024-2029 (%)
      • 12.16 Italy - Market size and forecast 2024-2029
        • Chart on Italy - Market size and forecast 2024-2029 ($ million)
        • Data Table on Italy - Market size and forecast 2024-2029 ($ million)
        • Chart on Italy - Year-over-year growth 2024-2029 (%)
        • Data Table on Italy - Year-over-year growth 2024-2029 (%)
      • 12.17 The Netherlands - Market size and forecast 2024-2029
        • Chart on The Netherlands - Market size and forecast 2024-2029 ($ million)
        • Data Table on The Netherlands - Market size and forecast 2024-2029 ($ million)
        • Chart on The Netherlands - Year-over-year growth 2024-2029 (%)
        • Data Table on The Netherlands - Year-over-year growth 2024-2029 (%)
      • 12.18 Market opportunity by geography
        • Market opportunity by geography ($ million)
        • Data Tables on Market opportunity by geography ($ million)

      13 Drivers, Challenges, and Opportunity/Restraints

      • 13.1 Market drivers
        • 13.2 Market challenges
          • 13.3 Impact of drivers and challenges
            • Impact of drivers and challenges in 2024 and 2029
          • 13.4 Market opportunities/restraints

            14 Competitive Landscape

            • 14.1 Overview
              • 14.2 Competitive Landscape
                • Overview on criticality of inputs and factors of differentiation
              • 14.3 Landscape disruption
                • Overview on factors of disruption
              • 14.4 Industry risks
                • Impact of key risks on business

              15 Competitive Analysis

              • 15.1 Companies profiled
                • Companies covered
              • 15.2 Company ranking index
                • Company ranking index
              • 15.3 Market positioning of companies
                • Matrix on companies position and classification
              • 3M Co.
                • 3M Co. - Overview
                • 3M Co. - Business segments
                • 3M Co. - Key news
                • 3M Co. - Key offerings
                • 3M Co. - Segment focus
                • SWOT
              • 15.5 AlpVision SA
                • AlpVision SA - Overview
                • AlpVision SA - Product / Service
                • AlpVision SA - Key offerings
                • SWOT
              • 15.6 Applied DNA Sciences Inc.
                • Applied DNA Sciences Inc. - Overview
                • Applied DNA Sciences Inc. - Product / Service
                • Applied DNA Sciences Inc. - Key offerings
                • SWOT
              • 15.7 Authentic Vision GmbH
                • Authentic Vision GmbH - Overview
                • Authentic Vision GmbH - Product / Service
                • Authentic Vision GmbH - Key offerings
                • SWOT
              • 15.8 Authentix Inc.
                • Authentix Inc. - Overview
                • Authentix Inc. - Product / Service
                • Authentix Inc. - Key offerings
                • SWOT
              • 15.9 Avery Dennison Corp.
                • Avery Dennison Corp. - Overview
                • Avery Dennison Corp. - Business segments
                • Avery Dennison Corp. - Key news
                • Avery Dennison Corp. - Key offerings
                • Avery Dennison Corp. - Segment focus
                • SWOT
              • 15.10 Centro Grafico DG SpA
                • Centro Grafico DG SpA - Overview
                • Centro Grafico DG SpA - Product / Service
                • Centro Grafico DG SpA - Key offerings
                • SWOT
              • 15.11 De La Rue PLC
                • De La Rue PLC - Overview
                • De La Rue PLC - Business segments
                • De La Rue PLC - Key offerings
                • De La Rue PLC - Segment focus
                • SWOT
              • 15.12 Eastman Kodak Co.
                • Eastman Kodak Co. - Overview
                • Eastman Kodak Co. - Business segments
                • Eastman Kodak Co. - Key news
                • Eastman Kodak Co. - Key offerings
                • Eastman Kodak Co. - Segment focus
                • SWOT
              • 15.13 Ennoventure Inc.
                • Ennoventure Inc. - Overview
                • Ennoventure Inc. - Product / Service
                • Ennoventure Inc. - Key offerings
                • SWOT
              • 15.14 Giesecke Devrient GmbH
                • Giesecke Devrient GmbH - Overview
                • Giesecke Devrient GmbH - Product / Service
                • Giesecke Devrient GmbH - Key news
                • Giesecke Devrient GmbH - Key offerings
                • SWOT
              • 15.15 HID Global Corp.
                • HID Global Corp. - Overview
                • HID Global Corp. - Product / Service
                • HID Global Corp. - Key news
                • HID Global Corp. - Key offerings
                • SWOT
              • 15.16 Infineon Technologies AG
                • Infineon Technologies AG - Overview
                • Infineon Technologies AG - Business segments
                • Infineon Technologies AG - Key news
                • Infineon Technologies AG - Key offerings
                • Infineon Technologies AG - Segment focus
                • SWOT
              • 15.17 Optel Group
                • Optel Group - Overview
                • Optel Group - Product / Service
                • Optel Group - Key offerings
                • SWOT
              • 15.18 Wisekey International Holding AG
                • Wisekey International Holding AG - Overview
                • Wisekey International Holding AG - Product / Service
                • Wisekey International Holding AG - Key offerings
                • SWOT

              16 Appendix

              • 16.1 Scope of the report
                • 16.2 Inclusions and exclusions checklist
                  • Inclusions checklist
                  • Exclusions checklist
                • 16.3 Currency conversion rates for US$
                  • Currency conversion rates for US$
                • 16.4 Research methodology
                  • Research methodology
                • 16.5 Data procurement
                  • Information sources
                • 16.6 Data validation
                  • Data validation
                • 16.7 Validation techniques employed for market sizing
                  • Validation techniques employed for market sizing
                • 16.8 Data synthesis
                  • Data synthesis
                • 16.9 360 degree market analysis
                  • 360 degree market analysis
                • 16.10 List of abbreviations
                  • List of abbreviations

                Research Methodology

                Technavio presents a detailed picture of the market by way of study, synthesis, and summation of data from multiple sources. The analysts have presented the various facets of the market with a particular focus on identifying the key industry influencers. The data thus presented is comprehensive, reliable, and the result of extensive research, both primary and secondary.

                INFORMATION SOURCES

                Primary sources

                • Manufacturers and suppliers
                • Channel partners
                • Industry experts
                • Strategic decision makers

                Secondary sources

                • Industry journals and periodicals
                • Government data
                • Financial reports of key industry players
                • Historical data
                • Press releases

                DATA ANALYSIS

                Data Synthesis

                • Collation of data
                • Estimation of key figures
                • Analysis of derived insights

                Data Validation

                • Triangulation with data models
                • Reference against proprietary databases
                • Corroboration with industry experts

                REPORT WRITING

                Qualitative

                • Market drivers
                • Market challenges
                • Market trends
                • Five forces analysis

                Quantitative

                • Market size and forecast
                • Market segmentation
                • Geographical insights
                • Competitive landscape

                Interested in this report?

                Get your sample now to see our research methodology and insights!

                Download Now

                Frequently Asked Questions

                Authentication And Brand Protection market growth will increase by $ 1985.2 mn during 2025-2029 .

                The Authentication And Brand Protection market is expected to grow at a CAGR of 8.6% during 2025-2029 .

                Authentication And Brand Protection market is segmented by Technology( Non-digital, Digital) Method( Smartphone authentication, Blockchain authentication) Application( Electronics, Pharmaceuticals, Food and beverages, Cosmetics, Others)

                3M Co., AlpVision SA, Applied DNA Sciences Inc., Authentic Vision GmbH, Authentix Inc., Avery Dennison Corp., Centro Grafico DG SpA, Crane Holdings Co., De La Rue PLC, Eastman Kodak Co., Ennoventure Inc., Giesecke Devrient GmbH, HID Global Corp., Infineon Technologies AG, Merck KGaA, Optel Group, STMicroelectronics NV, Wisekey International Holding AG are a few of the key vendors in the Authentication And Brand Protection market.

                APAC will register the highest growth rate of 30% among the other regions. Therefore, the Authentication And Brand Protection market in APAC is expected to garner significant business opportunities for the vendors during the forecast period.

                US, Canada, UK, China, Germany, France, The Netherlands, Italy, India, Japan

                • Increasing volume of online transactionsConsumers depend on the Internet to perform transactions. Online transactions are instant and easy. However is the driving factor this market.
                • financial transactions are vulnerable to cyberattacks. Key companies is the driving factor this market.
                • such as Gemalto is the driving factor this market.
                • provide hardware one-time password (OTP) tokens that have payment functionality for banking transactions. Some of Gemaltos offerings are Ezio Talk Token is the driving factor this market.
                • EZIO onCard PAD is the driving factor this market.
                • and EZIO Pico.The frequency of cyberattacks is increasing on websites where many online transactions take place. Hackers aim at sectors having a huge online customer base. Many organizations have started employing authentication methods such as phone-based authentication is the driving factor this market.
                • software OTP tokens is the driving factor this market.
                • hardware OTP tokens is the driving factor this market.
                • and e-mail to make online transactions highly secure.There has been a significant increase in the number of online services provided by companies is the driving factor this market.
                • leading to an upsurge in online transactions. E-commerce sales in the US grew by 8.1% in 2023 compared with that of 2022. E-commerce sales reached $1 is the driving factor this market.
                • 192.6 billion in 2023 is the driving factor this market.
                • up from $1 is the driving factor this market.
                • 103.1 billion in 2022. E-commerce still represents a small portion of retail purchases in the US. Hence is the driving factor this market.
                • ample opportunities exist in the US e-commerce industry.Mobile operators are providing high-speed mobile broadband services that have enabled users to use bandwidth-intensive business applications. High-speed Internet services are necessary for availing cloud-computing services is the driving factor this market.
                • which are in high demand among enterprises. The availability of 3G and 4G networks will further boost online transactions is the driving factor this market.
                • which is expected to increase the adoption of authentication and brand protection is the driving factor this market.
                • which will propel the growth of the market in focus during the forecast period. is the driving factor this market.

                The Authentication And Brand Protection market vendors should focus on grabbing business opportunities from the Non-digital segment as it accounted for the largest market share in the base year.