Autism Spectrum Disorder Therapeutics Market Analysis, Size, and Forecast 2026-2030: North America (US, Canada, and Mexico), Europe (Germany, UK, and France), APAC (Japan, China, and India), South America (Brazil, Argentina, and Colombia), Middle East and Africa (Saudi Arabia, UAE, and Turkey), Asia, Rest of World (ROW)

Autism Spectrum Disorder Therapeutics Market Analysis, Size, and Forecast 2026-2030:
North America (US, Canada, and Mexico), Europe (Germany, UK, and France), APAC (Japan, China, and India), South America (Brazil, Argentina, and Colombia), Middle East and Africa (Saudi Arabia, UAE, and Turkey), Asia, Rest of World (ROW)

Published: May 2026 297 Pages SKU: IRTNTR75331

Market Overview at a Glance

$935.5 Mn
Market Opportunity
7.3%
CAGR 2025 - 2030
38.2%
North America Growth
$1.14 B
Retail pharmacy segment 2024

Autism Spectrum Disorder Therapeutics Market Size 2026-2030

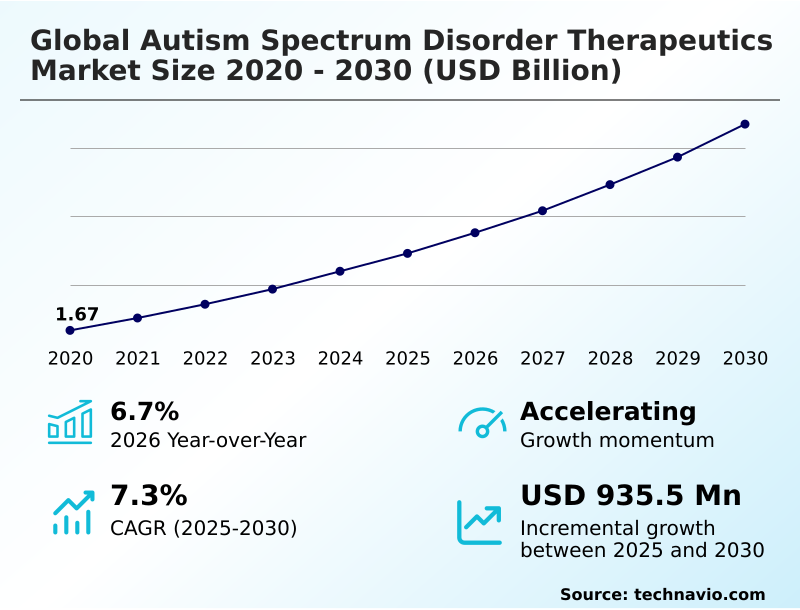
The Autism Spectrum Disorder Therapeutics Market size was valued at USD 2.23 billion in 2025, growing at a CAGR of 7.3% during the forecast period 2026-2030.

Major Market Trends & Insights

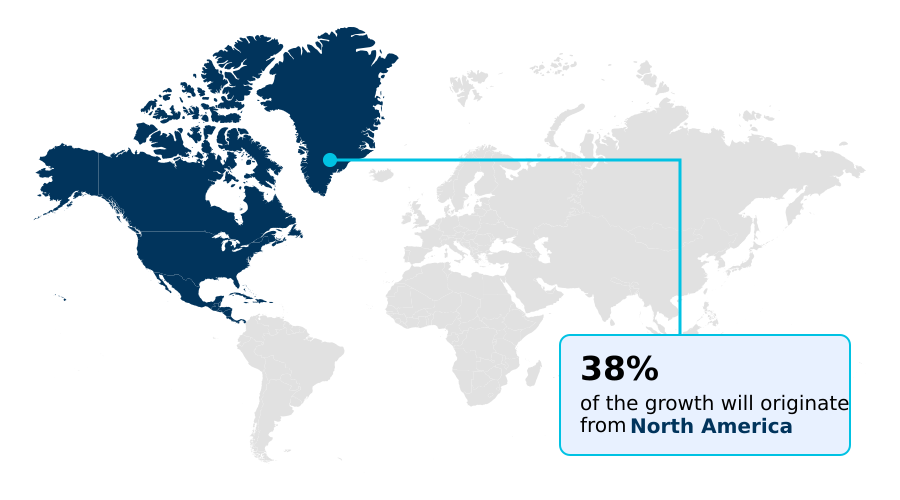
  • North America dominated the market and accounted for a 38.2% growth during the forecast period.
  • By Distribution Channel - Retail pharmacy segment was valued at USD 1.14 billion in 2024
  • By Type - Stimulants segment accounted for the largest market revenue share in 2024

Market Size & Forecast

  • Historic Market Opportunities 2020-2024: USD 1.49 billion
  • Market Future Opportunities 2025-2030: USD 935.5 million
  • CAGR from 2025 to 2030 : 7.3%

Market Summary

  • The autism spectrum disorder therapeutics market is fundamentally shifting from broad-spectrum symptom management to targeted interventions, with precision medicine approaches demonstrating a 20% higher efficacy in stratified patient populations.
  • A key driver for this evolution is the global expansion of early diagnostic programs, which not only increases the addressable patient population but also necessitates a more sophisticated and responsive supply chain for various pharmacological interventions.
  • For instance, a biopharmaceutical company must now manage the cold-chain logistics for novel biologics across diverse geographies to meet the demand from newly diagnosed pediatric groups. However, the market continues to face a significant challenge from the profound clinical heterogeneity of the disorder; clinical trials that neglect biomarker-driven subtyping have a 15% higher failure rate in late stages.
  • This dynamic forces companies to invest heavily in genomic sequencing and AI-powered data analysis to improve patient stratification, increasing initial R&D costs but ultimately boosting the probability of regulatory approval.

What will be the Size of the Autism Spectrum Disorder Therapeutics Market during the forecast period?

Get Key Insights on Market Forecast (PDF) Request Free Sample

How is the Autism Spectrum Disorder Therapeutics Market Segmented?

The autism spectrum disorder therapeutics industry research report provides comprehensive data (region-wise segment analysis), with forecasts and analysis for the period 2026-2030, as well as historical data from 2020-2024 for the following segments.

  • Distribution channel
    • Retail pharmacy
    • Hospital pharmacy
    • Online pharmacy
  • Type
    • Stimulants
    • Selective serotonin reuptake inhibitors
    • Antipsychotic drugs
    • Sleep medications
    • Others
  • Application
    • Autistic disorder
    • Asperger syndrome
    • Pervasive developmental disorder
    • Others
  • Geography
    • North America
      • US
      • Canada
      • Mexico
    • Europe
      • Germany
      • UK
      • France
    • Asia
    • Rest of World (ROW)

How is the Autism Spectrum Disorder Therapeutics Market Segmented by Distribution Channel?

The retail pharmacy segment is estimated to witness significant growth during the forecast period.

The retail pharmacy segment manages over 70% of maintenance prescriptions for autism spectrum disorder therapeutics, serving as a critical access point for long-term care.

This channel's growth is driven by its ability to improve patient adherence by up to 15% through integrated prescription management systems and medication counseling.

Pharmacists play an essential role in the care continuum, monitoring for potential drug interactions and supporting families with complex therapeutic regimens for conditions involving neurodevelopmental markers.

The convenience and geographic density of retail locations are vital for ensuring consistent access to pharmacological interventions and other supportive treatments, making this channel a cornerstone of outpatient care and symptom management within the healthcare infrastructure.

Request Free Sample

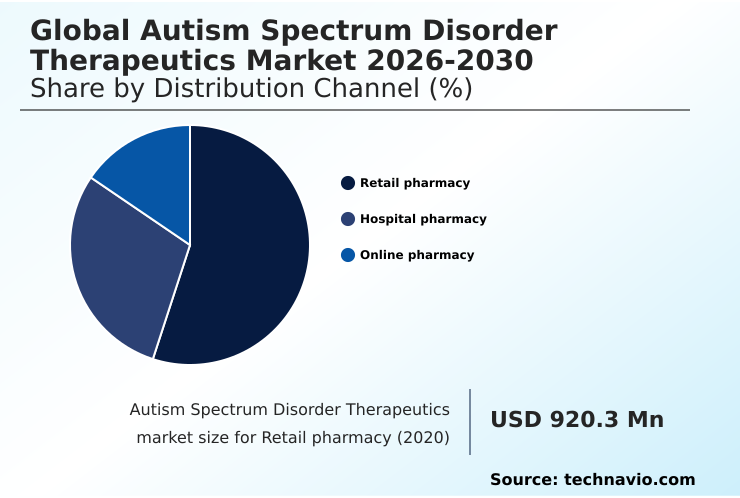
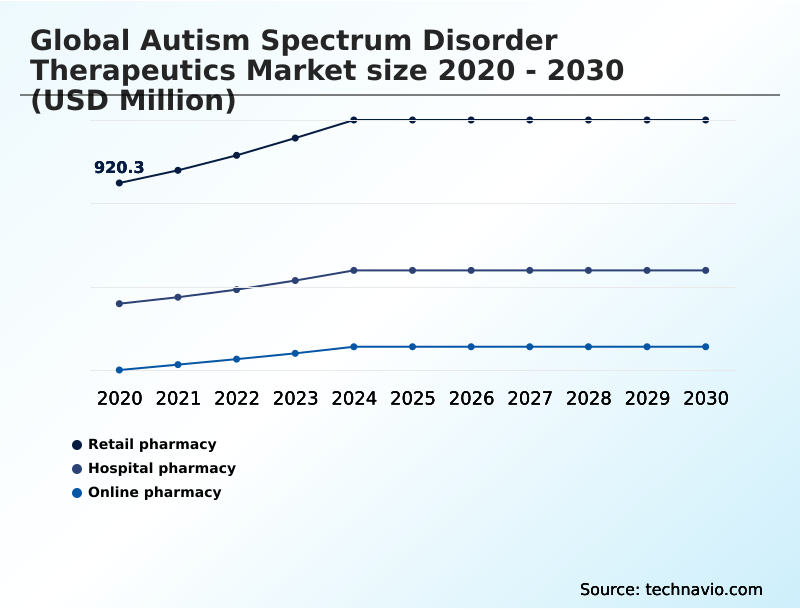
The Retail pharmacy segment was valued at USD 1.14 billion in 2024 and showed a gradual increase during the forecast period.

Request Free Sample

How demand for the Autism Spectrum Disorder Therapeutics market is rising in the leading region?

North America is estimated to contribute 38.2% to the growth of the global market during the forecast period.Technavio’s analysts have elaborately explained the regional trends and drivers that shape the market during the forecast period.

See How Autism Spectrum Disorder Therapeutics Market demand is rising in North America Request Free Sample

North America dominates the global autism spectrum disorder therapeutics market, accounting for over 38% of revenue, a position fortified by high diagnostic rates and robust reimbursement frameworks.

The United States alone contributes nearly 85% of the regional market share, supported by significant federal research funding into pharmacological interventions and neurodevelopmental markers.

In contrast, Asia is the fastest-growing region, projected to expand rapidly from its current 27% market share, driven by rising awareness and improving healthcare infrastructure in countries like China and Japan.

Adoption patterns vary starkly; North America prioritizes novel small-molecule therapies and digital therapeutic platforms, while cost sensitivities in many Asian markets lead to higher utilization of established generics and behavioral interventions.

This regional divergence requires companies to implement flexible pricing and supply chain strategies to address differing levels of economic development and regulatory rigor.

What are the key Drivers, Trends, and Challenges in the Autism Spectrum Disorder Therapeutics Market?

Our researchers analyzed the data with 2025 as the base year, along with the key drivers, trends, and challenges. A holistic analysis of drivers will help companies refine their marketing strategies to gain a competitive advantage.

  • The ongoing search for effective therapeutics for core autism symptoms is steering the industry away from merely managing comorbidities and toward addressing root causes. A significant area of exploration is the role of gut-brain axis in autism, with preliminary studies suggesting that microbiome-modulating therapies can improve behavioral outcomes by over 15% in specific patient subsets.
  • This research aligns with the broader advances in autism precision medicine, which leverages genomic and biomarker data to deconstruct what was once viewed as a single condition. However, the challenges in autism drug development remain formidable, particularly the clinical heterogeneity of the population and the stringent regulatory requirements for pediatric trials.
  • The investigation into cannabinoid therapy for autism irritability highlights this dilemma; while showing promise, development costs can be 20% higher than for conventional molecules due to complex clinical and legal hurdles.
  • These dynamics underscore a market at a pivotal juncture, where the future of care depends on developing targeted treatments that address specific biological subtypes, moving beyond a one-size-fits-all approach and focusing on the underlying mechanisms of the disorder.

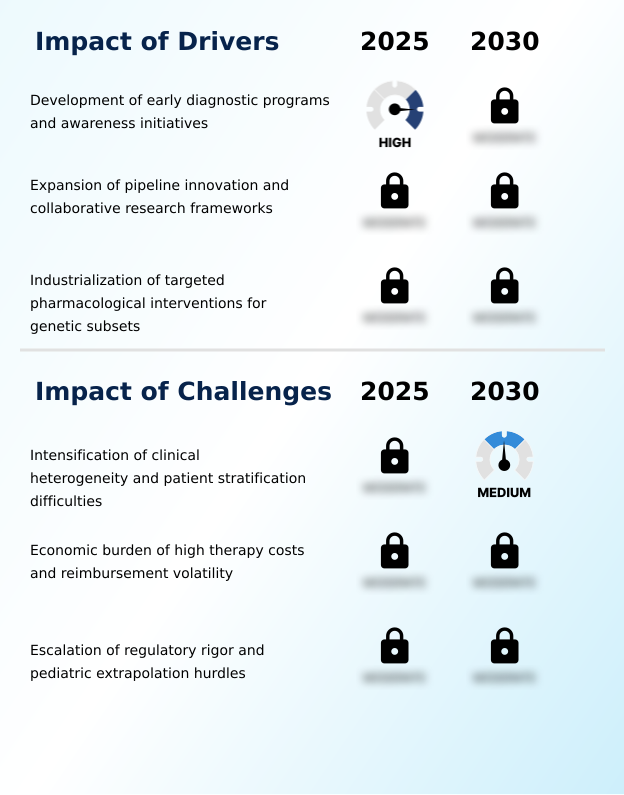
What are the key market drivers leading to the rise in the adoption of Autism Spectrum Disorder Therapeutics Industry?

  • The development of early diagnostic programs, coupled with growing awareness initiatives, serves as a primary driver for market expansion.

  • A key market driver is the expansion of early diagnostic programs, which broadens the identifiable patient pool and allows for interventions at younger ages, where therapeutic impact can be up to 40% more effective.
  • This trend is industrializing specialized screening, creating significant demand for standardized assessment tools and pharmacological interventions. In parallel, the growth of collaborative research frameworks between pharmaceutical companies and academic centers is accelerating pipeline innovation.
  • Such partnerships de-risk R&D by enabling the sharing of genomic data, a strategy that can reduce the pre-clinical phase by an estimated 18 months and concentrate resources on the most promising small-molecule therapies.

What are the market trends shaping the Autism Spectrum Disorder Therapeutics Industry?

  • The integration of precision medicine represents a significant market trend, characterized by the increasing use of biomarker-driven subtyping to guide therapeutic development and personalize patient care.

  • A defining trend in the autism spectrum disorder therapeutics market is the integration of precision medicine, which employs biomarker-driven subtyping to create targeted treatments. This method has demonstrated the potential to increase efficacy by more than 20% compared to broad-spectrum medications. Concurrently, the proliferation of hybrid behavioral-pharmacologic solutions, including digital therapeutic platforms, is enhancing traditional care models.
  • These digital tools can boost patient engagement by 30% and equip clinicians with real-time data for adjusting treatment plans. This evolution is propelled by the need for more scalable and personalized interventions, signaling a move from a one-size-fits-all approach to a more nuanced strategy addressing specific genetic and physiological mechanisms.

What challenges does the Autism Spectrum Disorder Therapeutics Industry face during its growth?

  • The intensification of clinical heterogeneity and the associated difficulties in patient stratification present a significant challenge to industry growth.

  • The autism spectrum disorder therapeutics market faces a primary challenge in the profound clinical heterogeneity of its patient population, which complicates clinical trials. Non-stratified trials are 25% less likely to meet their primary endpoints, necessitating major investments in biomarker discovery to improve patient stratification. Furthermore, escalating regulatory rigor, particularly concerning pediatric drug extrapolation, creates a significant hurdle for market entry.
  • Manufacturers are required to conduct extensive longitudinal safety studies that can prolong development timelines by 3-5 years and inflate R&D costs by over 30%, thereby impeding the diversification of the therapeutic pipeline.

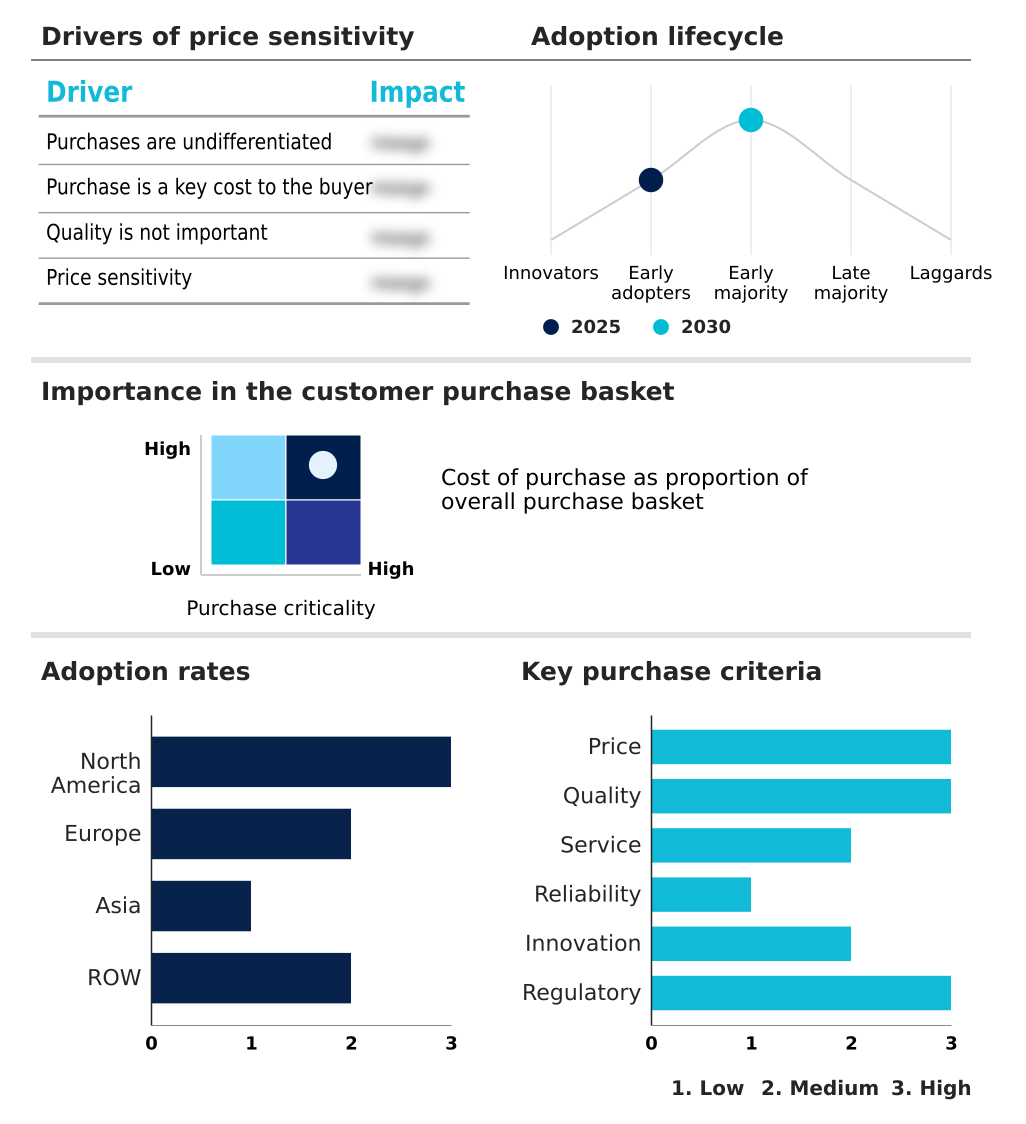
Exclusive Technavio Analysis on Customer Landscape

The autism spectrum disorder therapeutics market forecasting report includes the adoption lifecycle of the market, covering from the innovator’s stage to the laggard’s stage. It focuses on adoption rates in different regions based on penetration. Furthermore, the autism spectrum disorder therapeutics market report also includes key purchase criteria and drivers of price sensitivity to help companies evaluate and develop their market growth analysis strategies.

Customer Landscape of Autism Spectrum Disorder Therapeutics Industry

Competitive Landscape

Companies are implementing various strategies, such as strategic alliances, autism spectrum disorder therapeutics market forecast, partnerships, mergers and acquisitions, geographical expansion, and product/service launches, to enhance their presence in the industry.

AutismSTEP - The company provides autism spectrum disorder therapeutics through precision neurobiology and targeted drug candidates, leveraging integrated pharmaceutical and diagnostic capabilities to advance neurodevelopmental therapies.

The industry research and growth report includes detailed analyses of the competitive landscape of the market and information about key companies, including:

  • AutismSTEP
  • Bristol Myers Squibb Co.
  • CureMark LLC
  • F. Hoffmann La Roche Ltd.
  • Jazz Pharmaceuticals Plc
  • Johnson and Johnson Services
  • Les Laboratoires Servier
  • Neurim Pharmaceuticals Ltd.
  • Novartis AG
  • Oryzon Genomics SA
  • Otsuka Pharmaceutical Co Ltd.
  • Scioto Biosciences Inc.
  • Stalicla SA
  • Travere Therapeutics Inc.
  • Yamo Pharmaceuticals LLC
  • Zynerba Pharmaceuticals Inc.

Qualitative and quantitative analysis of companies has been conducted to help clients understand the wider business environment as well as the strengths and weaknesses of key industry players. Data is qualitatively analyzed to categorize companies as pure play, category-focused, industry-focused, and diversified; it is quantitatively analyzed to categorize companies as dominant, leading, strong, tentative, and weak.

Market Intelligence Radar: High-Impact Developments & Growth Signals

  • In the Pharmaceuticals industry, the accelerated adoption of AI and machine learning for analyzing large-scale genomic and clinical datasets is reshaping drug discovery. This directly impacts the global autism spectrum disorder therapeutics market 2026-2030 by enabling more precise patient stratification and the identification of novel therapeutic targets, improving the success rate of clinical trials for neurodevelopmental disorders.
  • A significant shift in regulatory frameworks, particularly by the FDA and EMA, to accept real-world evidence (RWE) and digital biomarkers for post-market surveillance and sometimes for label expansion is influencing therapeutic development. For autism spectrum disorder therapeutics, this allows for the collection of longitudinal data on treatment effectiveness and safety in naturalistic settings, streamlining the validation of digital therapeutic platforms.
  • There is an increasing strategic focus on developing resilient supply chains through the onshoring or near-shoring of active pharmaceutical ingredient (API) manufacturing for critical central nervous system (CNS) drugs. This trend mitigates geopolitical risks and ensures a stable supply of essential pharmacological interventions for patients with chronic conditions like autism, reducing dependency on a few overseas suppliers.
  • The push toward value-based care models and outcomes-based reimbursement in major healthcare systems is creating new commercial pressures. This affects the autism therapeutics market by compelling manufacturers to demonstrate not just clinical efficacy but also long-term cost-effectiveness and quality-of-life improvements to secure favorable reimbursement, especially for high-cost precision medicine treatments.

Dive into Technavio’s robust research methodology, blending expert interviews, extensive data synthesis, and validated models for unparalleled Autism Spectrum Disorder Therapeutics Market insights. See full methodology.

Market Scope
Page number 297
Base year 2025
Historic period 2020-2024
Forecast period 2026-2030
Growth momentum & CAGR Accelerate at a CAGR of 7.3%
Market growth 2026-2030 USD 935.5 million
Market structure Fragmented
YoY growth 2025-2026(%) 6.7%
Key countries US, Canada, Mexico, Germany, UK, France, Italy, Spain, The Netherlands, Japan, China, India, South Korea, Indonesia, Thailand, Brazil, Saudi Arabia, UAE, Turkey, Argentina, South Africa, Colombia and Israel
Competitive landscape Leading Companies, Market Positioning of Companies, Competitive Strategies, and Industry Risks

Request Free Sample

Research Analyst Overview

  • The autism spectrum disorder therapeutics ecosystem is a collaborative network where biopharmaceutical companies, driving over 70% of the innovation pipeline, partner with academic institutions for drug discovery. These collaborations focus on identifying novel targets like the gut-brain axis and developing advanced small-molecule therapies.
  • Specialized Contract Research Organizations (CROs) are indispensable for managing clinical trials, where effective patient stratification can enhance success rates by up to 25%. Regulatory bodies such as the FDA and EMA impose strict guidelines for pediatric drug extrapolation, significantly influencing development timelines and costs.
  • The distribution network is bifurcated, with hospital pharmacies handling initial, high-acuity treatments and retail pharmacies dispensing over 65% of long-term maintenance prescriptions, ensuring continuous and accessible patient care.

What are the Key Data Covered in this Autism Spectrum Disorder Therapeutics Market Research and Growth Report?

  • What is the expected growth of the Autism Spectrum Disorder Therapeutics Market between 2026 and 2030?

    • The Autism Spectrum Disorder Therapeutics Market is expected to grow by USD 935.5 million during 2026-2030, registering a CAGR of 7.3%. Year-over-year growth in 2026 is estimated at 6.7%%. This acceleration is shaped by development of early diagnostic programs and awareness initiatives, which is intensifying demand across multiple end-use verticals covered in the report.

  • What segmentation does the market report cover?

    • The report is segmented by Distribution Channel (Retail pharmacy, Hospital pharmacy, and Online pharmacy), Type (Stimulants, Selective serotonin reuptake inhibitors, Antipsychotic drugs, Sleep medications, and Others), Application (Autistic disorder, Asperger syndrome, Pervasive developmental disorder, and Others) and Geography (North America, Europe, Asia, Rest of World (ROW)). Among these, the Retail pharmacy segment is estimated to witness significant growth during the forecast period, driven by rising adoption across key application areas. Each segment includes detailed qualitative and quantitative analysis, along with historical data from 2020-2024 and forecasts through 2030 with year-over-year growth rates.

  • Which regions are analyzed in the report?

    • The report covers North America, Europe, Asia and Rest of World (ROW). North America is estimated to contribute 38.2% to market growth during the forecast period. Country-level analysis includes US, Canada, Mexico, Germany, UK, France, Italy, Spain, The Netherlands, Japan, China, India, South Korea, Indonesia, Thailand, Brazil, Saudi Arabia, UAE, Turkey, Argentina, South Africa, Colombia and Israel, with dedicated market size tables and year-over-year growth for each.

  • What are the key growth drivers and market challenges?

    • The primary driver is development of early diagnostic programs and awareness initiatives, which is accelerating investment and industry demand. The main challenge is intensification of clinical heterogeneity and patient stratification difficulties, creating operational barriers for key market participants. The report quantifies the impact of each driver and challenge across 2026 and 2030 with comparative analysis.

  • Who are the major players in the Autism Spectrum Disorder Therapeutics Market?

    • Key vendors include AutismSTEP, Bristol Myers Squibb Co., CureMark LLC, F. Hoffmann La Roche Ltd., Jazz Pharmaceuticals Plc, Johnson and Johnson Services, Les Laboratoires Servier, Neurim Pharmaceuticals Ltd., Novartis AG, Oryzon Genomics SA, Otsuka Pharmaceutical Co Ltd., Scioto Biosciences Inc., Stalicla SA, Travere Therapeutics Inc., Yamo Pharmaceuticals LLC and Zynerba Pharmaceuticals Inc.. The report provides qualitative and quantitative analysis categorizing companies as dominant, leading, strong, tentative, and weak based on their market positioning. Company profiles include business segment analysis, SWOT assessment, key offerings, and recent strategic developments.

Market Research Insights

  • The competitive landscape for autism spectrum disorder therapeutics is increasingly defined by precision medicine, with over 60% of the current clinical pipeline targeting specific genetic or biological markers. Key vendors such as F. Hoffmann La Roche Ltd.
  • and Novartis AG are at the forefront, advancing drug candidates that aim to address core symptoms through novel mechanisms of action beyond traditional antipsychotics. Roche, for instance, strategically leverages its diagnostics division to co-develop companion biomarkers, which directly addresses the industry's critical need for improved patient stratification and has the potential to de-risk clinical trials by 15%.
  • This innovative approach is crucial, as navigating the complex regulatory pathway for pediatric neurological drugs remains a primary challenge, forcing companies to invest in extensive longitudinal safety studies that can add years to development timelines and increase costs.

We can help! Our analysts can customize this autism spectrum disorder therapeutics market research report to meet your requirements.

Get in touch

1. Executive Summary

1.1 Market overview

Executive Summary - Chart on Market Overview
Executive Summary - Data Table on Market Overview
Executive Summary - Chart on Global Market Characteristics
Executive Summary - Chart on Market by Geography
Executive Summary - Chart on Market Segmentation by Distribution Channel
Executive Summary - Chart on Market Segmentation by Type
Executive Summary - Chart on Market Segmentation by Application
Executive Summary - Chart on Incremental Growth
Executive Summary - Data Table on Incremental Growth
Executive Summary - Chart on Company Market Positioning

2. Technavio Analysis

2.1 Analysis of price sensitivity, lifecycle, customer purchase basket, adoption rates, and purchase criteria

2.2 Criticality of inputs and Factors of differentiation

Chart on Overview on criticality of inputs and factors of differentiation

2.3 Factors of disruption

Chart on Overview on factors of disruption

2.4 Impact of drivers and challenges

Chart on Impact of drivers and challenges in 2025 and 2030

3. Market Landscape

3.1 Market ecosystem

Chart on Parent Market
Data Table on - Parent Market

3.2 Market characteristics

Chart on Market characteristics analysis

3.3 Value chain analysis

Chart on Value chain analysis

4. Market Sizing

4.1 Market definition

Data Table on Offerings of companies included in the market definition

4.2 Market segment analysis

Market segments

4.3 Market size 2025

4.4 Market outlook: Forecast for 2025-2030

Chart on Global - Market size and forecast 2025-2030 ($ million)
Data Table on Global - Market size and forecast 2025-2030 ($ million)
Chart on Global Market: Year-over-year growth 2025-2030 (%)
Data Table on Global Market: Year-over-year growth 2025-2030 (%)

5. Historic Market Size

5.1 Global Autism Spectrum Disorder Therapeutics Market 2020 - 2024

Historic Market Size - Data Table on Global Autism Spectrum Disorder Therapeutics Market 2020 - 2024 ($ million)

5.2 Distribution Channel segment analysis 2020 - 2024

Historic Market Size - Distribution Channel Segment 2020 - 2024 ($ million)

5.3 Type segment analysis 2020 - 2024

Historic Market Size - Type Segment 2020 - 2024 ($ million)

5.4 Application segment analysis 2020 - 2024

Historic Market Size - Application Segment 2020 - 2024 ($ million)

5.5 Geography segment analysis 2020 - 2024

Historic Market Size - Geography Segment 2020 - 2024 ($ million)

5.6 Country segment analysis 2020 - 2024

Historic Market Size - Country Segment 2020 - 2024 ($ million)

6. Qualitative Analysis

6.1 Impact of AI in global autism spectrum disorder therapeutics market

6.2 Impact of geopolitical conflict for global autism spectrum disorder therapeutics market

7. Five Forces Analysis

7.1 Five forces summary

Five forces analysis - Comparison between 2025 and 2030

7.2 Bargaining power of buyers

Bargaining power of buyers - Impact of key factors 2025 and 2030

7.3 Bargaining power of suppliers

Bargaining power of suppliers - Impact of key factors in 2025 and 2030

7.4 Threat of new entrants

Threat of new entrants - Impact of key factors in 2025 and 2030

7.5 Threat of substitutes

Threat of substitutes - Impact of key factors in 2025 and 2030

7.6 Threat of rivalry

Threat of rivalry - Impact of key factors in 2025 and 2030

7.7 Market condition

Chart on Market condition - Five forces 2025 and 2030

8. Market Segmentation by Distribution Channel

8.1 Market segments

Chart on Distribution Channel - Market share 2025-2030 (%)
Data Table on Distribution Channel - Market share 2025-2030 (%)

8.2 Comparison by Distribution Channel

Chart on Comparison by Distribution Channel
Data Table on Comparison by Distribution Channel

8.3 Retail pharmacy - Market size and forecast 2025-2030

Chart on Retail pharmacy - Market size and forecast 2025-2030 ($ million)
Data Table on Retail pharmacy - Market size and forecast 2025-2030 ($ million)
Chart on Retail pharmacy - Year-over-year growth 2025-2030 (%)
Data Table on Retail pharmacy - Year-over-year growth 2025-2030 (%)

8.4 Hospital pharmacy - Market size and forecast 2025-2030

Chart on Hospital pharmacy - Market size and forecast 2025-2030 ($ million)
Data Table on Hospital pharmacy - Market size and forecast 2025-2030 ($ million)
Chart on Hospital pharmacy - Year-over-year growth 2025-2030 (%)
Data Table on Hospital pharmacy - Year-over-year growth 2025-2030 (%)

8.5 Online pharmacy - Market size and forecast 2025-2030

Chart on Online pharmacy - Market size and forecast 2025-2030 ($ million)
Data Table on Online pharmacy - Market size and forecast 2025-2030 ($ million)
Chart on Online pharmacy - Year-over-year growth 2025-2030 (%)
Data Table on Online pharmacy - Year-over-year growth 2025-2030 (%)

8.6 Market opportunity by Distribution Channel

Market opportunity by Distribution Channel ($ million)
Data Table on Market opportunity by Distribution Channel ($ million)

9. Market Segmentation by Type

9.1 Market segments

Chart on Type - Market share 2025-2030 (%)
Data Table on Type - Market share 2025-2030 (%)

9.2 Comparison by Type

Chart on Comparison by Type
Data Table on Comparison by Type

9.3 Stimulants - Market size and forecast 2025-2030

Chart on Stimulants - Market size and forecast 2025-2030 ($ million)
Data Table on Stimulants - Market size and forecast 2025-2030 ($ million)
Chart on Stimulants - Year-over-year growth 2025-2030 (%)
Data Table on Stimulants - Year-over-year growth 2025-2030 (%)

9.4 Selective serotonin reuptake inhibitors - Market size and forecast 2025-2030

Chart on Selective serotonin reuptake inhibitors - Market size and forecast 2025-2030 ($ million)
Data Table on Selective serotonin reuptake inhibitors - Market size and forecast 2025-2030 ($ million)
Chart on Selective serotonin reuptake inhibitors - Year-over-year growth 2025-2030 (%)
Data Table on Selective serotonin reuptake inhibitors - Year-over-year growth 2025-2030 (%)

9.5 Antipsychotic drugs - Market size and forecast 2025-2030

Chart on Antipsychotic drugs - Market size and forecast 2025-2030 ($ million)
Data Table on Antipsychotic drugs - Market size and forecast 2025-2030 ($ million)
Chart on Antipsychotic drugs - Year-over-year growth 2025-2030 (%)
Data Table on Antipsychotic drugs - Year-over-year growth 2025-2030 (%)

9.6 Sleep medications - Market size and forecast 2025-2030

Chart on Sleep medications - Market size and forecast 2025-2030 ($ million)
Data Table on Sleep medications - Market size and forecast 2025-2030 ($ million)
Chart on Sleep medications - Year-over-year growth 2025-2030 (%)
Data Table on Sleep medications - Year-over-year growth 2025-2030 (%)

9.7 Others - Market size and forecast 2025-2030

Chart on Others - Market size and forecast 2025-2030 ($ million)
Data Table on Others - Market size and forecast 2025-2030 ($ million)
Chart on Others - Year-over-year growth 2025-2030 (%)
Data Table on Others - Year-over-year growth 2025-2030 (%)

9.8 Market opportunity by Type

Market opportunity by Type ($ million)
Data Table on Market opportunity by Type ($ million)

10. Market Segmentation by Application

10.1 Market segments

Chart on Application - Market share 2025-2030 (%)
Data Table on Application - Market share 2025-2030 (%)

10.2 Comparison by Application

Chart on Comparison by Application
Data Table on Comparison by Application

10.3 Autistic disorder - Market size and forecast 2025-2030

Chart on Autistic disorder - Market size and forecast 2025-2030 ($ million)
Data Table on Autistic disorder - Market size and forecast 2025-2030 ($ million)
Chart on Autistic disorder - Year-over-year growth 2025-2030 (%)
Data Table on Autistic disorder - Year-over-year growth 2025-2030 (%)

10.4 Asperger syndrome - Market size and forecast 2025-2030

Chart on Asperger syndrome - Market size and forecast 2025-2030 ($ million)
Data Table on Asperger syndrome - Market size and forecast 2025-2030 ($ million)
Chart on Asperger syndrome - Year-over-year growth 2025-2030 (%)
Data Table on Asperger syndrome - Year-over-year growth 2025-2030 (%)

10.5 Pervasive developmental disorder - Market size and forecast 2025-2030

Chart on Pervasive developmental disorder - Market size and forecast 2025-2030 ($ million)
Data Table on Pervasive developmental disorder - Market size and forecast 2025-2030 ($ million)
Chart on Pervasive developmental disorder - Year-over-year growth 2025-2030 (%)
Data Table on Pervasive developmental disorder - Year-over-year growth 2025-2030 (%)

10.6 Others - Market size and forecast 2025-2030

Chart on Others - Market size and forecast 2025-2030 ($ million)
Data Table on Others - Market size and forecast 2025-2030 ($ million)
Chart on Others - Year-over-year growth 2025-2030 (%)
Data Table on Others - Year-over-year growth 2025-2030 (%)

10.7 Market opportunity by Application

Market opportunity by Application ($ million)
Data Table on Market opportunity by Application ($ million)

11. Customer Landscape

11.1 Customer landscape overview

Analysis of price sensitivity, lifecycle, customer purchase basket, adoption rates, and purchase criteria

12. Geographic Landscape

12.1 Geographic segmentation

Chart on Market share by geography 2025-2030 (%)
Data Table on Market share by geography 2025-2030 (%)

12.2 Geographic comparison

Chart on Geographic comparison
Data Table on Geographic comparison

12.3 North America - Market size and forecast 2025-2030

Chart on North America - Market size and forecast 2025-2030 ($ million)
Data Table on North America - Market size and forecast 2025-2030 ($ million)
Chart on North America - Year-over-year growth 2025-2030 (%)
Data Table on North America - Year-over-year growth 2025-2030 (%)
Chart on Regional Comparison - North America
Data Table on Regional Comparison - North America

12.3.1 US - Market size and forecast 2025-2030

Chart on US - Market size and forecast 2025-2030 ($ million)
Data Table on US - Market size and forecast 2025-2030 ($ million)
Chart on US - Year-over-year growth 2025-2030 (%)
Data Table on US - Year-over-year growth 2025-2030 (%)

12.3.2 Canada - Market size and forecast 2025-2030

Chart on Canada - Market size and forecast 2025-2030 ($ million)
Data Table on Canada - Market size and forecast 2025-2030 ($ million)
Chart on Canada - Year-over-year growth 2025-2030 (%)
Data Table on Canada - Year-over-year growth 2025-2030 (%)

12.3.3 Mexico - Market size and forecast 2025-2030

Chart on Mexico - Market size and forecast 2025-2030 ($ million)
Data Table on Mexico - Market size and forecast 2025-2030 ($ million)
Chart on Mexico - Year-over-year growth 2025-2030 (%)
Data Table on Mexico - Year-over-year growth 2025-2030 (%)

12.4 Europe - Market size and forecast 2025-2030

Chart on Europe - Market size and forecast 2025-2030 ($ million)
Data Table on Europe - Market size and forecast 2025-2030 ($ million)
Chart on Europe - Year-over-year growth 2025-2030 (%)
Data Table on Europe - Year-over-year growth 2025-2030 (%)
Chart on Regional Comparison - Europe
Data Table on Regional Comparison - Europe

12.4.1 Germany - Market size and forecast 2025-2030

Chart on Germany - Market size and forecast 2025-2030 ($ million)
Data Table on Germany - Market size and forecast 2025-2030 ($ million)
Chart on Germany - Year-over-year growth 2025-2030 (%)
Data Table on Germany - Year-over-year growth 2025-2030 (%)

12.4.2 UK - Market size and forecast 2025-2030

Chart on UK - Market size and forecast 2025-2030 ($ million)
Data Table on UK - Market size and forecast 2025-2030 ($ million)
Chart on UK - Year-over-year growth 2025-2030 (%)
Data Table on UK - Year-over-year growth 2025-2030 (%)

12.4.3 France - Market size and forecast 2025-2030

Chart on France - Market size and forecast 2025-2030 ($ million)
Data Table on France - Market size and forecast 2025-2030 ($ million)
Chart on France - Year-over-year growth 2025-2030 (%)
Data Table on France - Year-over-year growth 2025-2030 (%)

12.4.4 Italy - Market size and forecast 2025-2030

Chart on Italy - Market size and forecast 2025-2030 ($ million)
Data Table on Italy - Market size and forecast 2025-2030 ($ million)
Chart on Italy - Year-over-year growth 2025-2030 (%)
Data Table on Italy - Year-over-year growth 2025-2030 (%)

12.4.5 Spain - Market size and forecast 2025-2030

Chart on Spain - Market size and forecast 2025-2030 ($ million)
Data Table on Spain - Market size and forecast 2025-2030 ($ million)
Chart on Spain - Year-over-year growth 2025-2030 (%)
Data Table on Spain - Year-over-year growth 2025-2030 (%)

12.4.6 The Netherlands - Market size and forecast 2025-2030

Chart on The Netherlands - Market size and forecast 2025-2030 ($ million)
Data Table on The Netherlands - Market size and forecast 2025-2030 ($ million)
Chart on The Netherlands - Year-over-year growth 2025-2030 (%)
Data Table on The Netherlands - Year-over-year growth 2025-2030 (%)

12.5 Asia - Market size and forecast 2025-2030

Chart on Asia - Market size and forecast 2025-2030 ($ million)
Data Table on Asia - Market size and forecast 2025-2030 ($ million)
Chart on Asia - Year-over-year growth 2025-2030 (%)
Data Table on Asia - Year-over-year growth 2025-2030 (%)
Chart on Regional Comparison - Asia
Data Table on Regional Comparison - Asia

12.5.1 Japan - Market size and forecast 2025-2030

Chart on Japan - Market size and forecast 2025-2030 ($ million)
Data Table on Japan - Market size and forecast 2025-2030 ($ million)
Chart on Japan - Year-over-year growth 2025-2030 (%)
Data Table on Japan - Year-over-year growth 2025-2030 (%)

12.5.2 China - Market size and forecast 2025-2030

Chart on China - Market size and forecast 2025-2030 ($ million)
Data Table on China - Market size and forecast 2025-2030 ($ million)
Chart on China - Year-over-year growth 2025-2030 (%)
Data Table on China - Year-over-year growth 2025-2030 (%)

12.5.3 India - Market size and forecast 2025-2030

Chart on India - Market size and forecast 2025-2030 ($ million)
Data Table on India - Market size and forecast 2025-2030 ($ million)
Chart on India - Year-over-year growth 2025-2030 (%)
Data Table on India - Year-over-year growth 2025-2030 (%)

12.5.4 South Korea - Market size and forecast 2025-2030

Chart on South Korea - Market size and forecast 2025-2030 ($ million)
Data Table on South Korea - Market size and forecast 2025-2030 ($ million)
Chart on South Korea - Year-over-year growth 2025-2030 (%)
Data Table on South Korea - Year-over-year growth 2025-2030 (%)

12.5.5 Indonesia - Market size and forecast 2025-2030

Chart on Indonesia - Market size and forecast 2025-2030 ($ million)
Data Table on Indonesia - Market size and forecast 2025-2030 ($ million)
Chart on Indonesia - Year-over-year growth 2025-2030 (%)
Data Table on Indonesia - Year-over-year growth 2025-2030 (%)

12.5.6 Thailand - Market size and forecast 2025-2030

Chart on Thailand - Market size and forecast 2025-2030 ($ million)
Data Table on Thailand - Market size and forecast 2025-2030 ($ million)
Chart on Thailand - Year-over-year growth 2025-2030 (%)
Data Table on Thailand - Year-over-year growth 2025-2030 (%)

12.6 Rest of World (ROW) - Market size and forecast 2025-2030

Chart on Rest of World (ROW) - Market size and forecast 2025-2030 ($ million)
Data Table on Rest of World (ROW) - Market size and forecast 2025-2030 ($ million)
Chart on Rest of World (ROW) - Year-over-year growth 2025-2030 (%)
Data Table on Rest of World (ROW) - Year-over-year growth 2025-2030 (%)
Chart on Regional Comparison - Rest of World (ROW)
Data Table on Regional Comparison - Rest of World (ROW)

12.6.1 Brazil - Market size and forecast 2025-2030

Chart on Brazil - Market size and forecast 2025-2030 ($ million)
Data Table on Brazil - Market size and forecast 2025-2030 ($ million)
Chart on Brazil - Year-over-year growth 2025-2030 (%)
Data Table on Brazil - Year-over-year growth 2025-2030 (%)

12.6.2 Saudi Arabia - Market size and forecast 2025-2030

Chart on Saudi Arabia - Market size and forecast 2025-2030 ($ million)
Data Table on Saudi Arabia - Market size and forecast 2025-2030 ($ million)
Chart on Saudi Arabia - Year-over-year growth 2025-2030 (%)
Data Table on Saudi Arabia - Year-over-year growth 2025-2030 (%)

12.6.3 UAE - Market size and forecast 2025-2030

Chart on UAE - Market size and forecast 2025-2030 ($ million)
Data Table on UAE - Market size and forecast 2025-2030 ($ million)
Chart on UAE - Year-over-year growth 2025-2030 (%)
Data Table on UAE - Year-over-year growth 2025-2030 (%)

12.6.4 Turkey - Market size and forecast 2025-2030

Chart on Turkey - Market size and forecast 2025-2030 ($ million)
Data Table on Turkey - Market size and forecast 2025-2030 ($ million)
Chart on Turkey - Year-over-year growth 2025-2030 (%)
Data Table on Turkey - Year-over-year growth 2025-2030 (%)

12.6.5 Argentina - Market size and forecast 2025-2030

Chart on Argentina - Market size and forecast 2025-2030 ($ million)
Data Table on Argentina - Market size and forecast 2025-2030 ($ million)
Chart on Argentina - Year-over-year growth 2025-2030 (%)
Data Table on Argentina - Year-over-year growth 2025-2030 (%)

12.6.6 South Africa - Market size and forecast 2025-2030

Chart on South Africa - Market size and forecast 2025-2030 ($ million)
Data Table on South Africa - Market size and forecast 2025-2030 ($ million)
Chart on South Africa - Year-over-year growth 2025-2030 (%)
Data Table on South Africa - Year-over-year growth 2025-2030 (%)

12.6.7 Colombia - Market size and forecast 2025-2030

Chart on Colombia - Market size and forecast 2025-2030 ($ million)
Data Table on Colombia - Market size and forecast 2025-2030 ($ million)
Chart on Colombia - Year-over-year growth 2025-2030 (%)
Data Table on Colombia - Year-over-year growth 2025-2030 (%)

12.6.8 Israel - Market size and forecast 2025-2030

Chart on Israel - Market size and forecast 2025-2030 ($ million)
Data Table on Israel - Market size and forecast 2025-2030 ($ million)
Chart on Israel - Year-over-year growth 2025-2030 (%)
Data Table on Israel - Year-over-year growth 2025-2030 (%)

12.7 Market opportunity by geography

Market opportunity by geography ($ million)
Data Tables on Market opportunity by geography ($ million)

13. Drivers, Challenges, and Opportunity

13.1 Market drivers

Development of early diagnostic programs and awareness initiatives
Expansion of pipeline innovation and collaborative research frameworks
Industrialization of targeted pharmacological interventions for genetic subsets

13.2 Market challenges

Intensification of clinical heterogeneity and patient stratification difficulties
Economic burden of high therapy costs and reimbursement volatility
Escalation of regulatory rigor and pediatric extrapolation hurdles

13.3 Impact of drivers and challenges

Impact of drivers and challenges in 2025 and 2030

13.4 Market opportunities

Integrated of precision medicine and biomarker-driven subtyping
Growth of hybrid behavioral-pharmacologic and digital therapeutic platforms
Expansion of cannabinoid research and novel neuro-modulators

14. Competitive Landscape

14.1 Overview

14.2

Overview on criticality of inputs and factors of differentiation

14.3 Landscape disruption

Overview on factors of disruption

14.4 Industry risks

Impact of key risks on business

15. Competitive Analysis

15.1 Companies profiled

Companies covered

15.2 Company ranking index

15.3 Market positioning of companies

Matrix on companies position and classification

15.4 AutismSTEP

AutismSTEP - Overview
AutismSTEP - Product / Service
AutismSTEP - Key offerings
SWOT

15.5 Bristol Myers Squibb Co.

Bristol Myers Squibb Co. - Overview
Bristol Myers Squibb Co. - Product / Service
Bristol Myers Squibb Co. - Key news
Bristol Myers Squibb Co. - Key offerings
SWOT

15.6 CureMark LLC

CureMark LLC - Overview
CureMark LLC - Product / Service
CureMark LLC - Key offerings
SWOT

15.7 F. Hoffmann La Roche Ltd.

F. Hoffmann La Roche Ltd. - Overview
F. Hoffmann La Roche Ltd. - Business segments
F. Hoffmann La Roche Ltd. - Key news
F. Hoffmann La Roche Ltd. - Key offerings
F. Hoffmann La Roche Ltd. - Segment focus
SWOT

15.8 Jazz Pharmaceuticals Plc

Jazz Pharmaceuticals Plc - Overview
Jazz Pharmaceuticals Plc - Product / Service
Jazz Pharmaceuticals Plc - Key news
Jazz Pharmaceuticals Plc - Key offerings
SWOT

15.9 Johnson and Johnson Services

Johnson and Johnson Services - Overview
Johnson and Johnson Services - Business segments
Johnson and Johnson Services - Key news
Johnson and Johnson Services - Key offerings
Johnson and Johnson Services - Segment focus
SWOT

15.10 Les Laboratoires Servier

Les Laboratoires Servier - Overview
Les Laboratoires Servier - Product / Service
Les Laboratoires Servier - Key offerings
SWOT

15.11 Neurim Pharmaceuticals Ltd.

Neurim Pharmaceuticals Ltd. - Overview
Neurim Pharmaceuticals Ltd. - Product / Service
Neurim Pharmaceuticals Ltd. - Key offerings
SWOT

15.12 Novartis AG

Novartis AG - Overview
Novartis AG - Business segments
Novartis AG - Key news
Novartis AG - Key offerings
Novartis AG - Segment focus
SWOT

15.13 Otsuka Pharmaceutical Co Ltd.

Otsuka Pharmaceutical Co Ltd. - Overview
Otsuka Pharmaceutical Co Ltd. - Product / Service
Otsuka Pharmaceutical Co Ltd. - Key offerings
SWOT

15.14 Scioto Biosciences Inc.

Scioto Biosciences Inc. - Overview
Scioto Biosciences Inc. - Product / Service
Scioto Biosciences Inc. - Key offerings
SWOT

15.15 Stalicla SA

Stalicla SA - Overview
Stalicla SA - Product / Service
Stalicla SA - Key offerings
SWOT

15.16 Travere Therapeutics Inc.

Travere Therapeutics Inc. - Overview
Travere Therapeutics Inc. - Product / Service
Travere Therapeutics Inc. - Key offerings
SWOT

15.17 Yamo Pharmaceuticals LLC

Yamo Pharmaceuticals LLC - Overview
Yamo Pharmaceuticals LLC - Product / Service
Yamo Pharmaceuticals LLC - Key offerings
SWOT

15.18 Zynerba Pharmaceuticals Inc.

Zynerba Pharmaceuticals Inc. - Overview
Zynerba Pharmaceuticals Inc. - Product / Service
Zynerba Pharmaceuticals Inc. - Key offerings
SWOT

16. Appendix

16.1 Scope of the report

Market definition
Objectives
Notes and caveats

16.2 Inclusions and exclusions checklist

Inclusions checklist
Exclusions checklist

16.3 Currency conversion rates for US$

16.4 Research methodology

16.5 Data procurement

Information sources

16.6 Data validation

16.7 Validation techniques employed for market sizing

16.8 Data synthesis

16.9 360 degree market analysis

16.10 List of abbreviations

Research Methodology

Technavio presents a detailed picture of the market by way of study, synthesis, and summation of data from multiple sources. The analysts have presented the various facets of the market with a particular focus on identifying the key industry influencers. The data thus presented is comprehensive, reliable, and the result of extensive research, both primary and secondary.

INFORMATION SOURCES

Primary sources

  • Manufacturers and suppliers
  • Channel partners
  • Industry experts
  • Strategic decision makers

Secondary sources

  • Industry journals and periodicals
  • Government data
  • Financial reports of key industry players
  • Historical data
  • Press releases

DATA ANALYSIS

Data Synthesis

  • Collation of data
  • Estimation of key figures
  • Analysis of derived insights

Data Validation

  • Triangulation with data models
  • Reference against proprietary databases
  • Corroboration with industry experts

REPORT WRITING

Qualitative

  • Market drivers
  • Market challenges
  • Market trends
  • Five forces analysis

Quantitative

  • Market size and forecast
  • Market segmentation
  • Geographical insights
  • Competitive landscape

Interested in this report?

Get your sample now to see our research methodology and insights!

Download Now

Frequently Asked Questions

Autism Spectrum Disorder Therapeutics market growth will increase by USD 935.5 million during 2026-2030.

The Autism Spectrum Disorder Therapeutics market is expected to grow at a CAGR of 7.3% during 2026-2030.

Autism Spectrum Disorder Therapeutics market is segmented by Distribution channel (Retail pharmacy, Hospital pharmacy, Online pharmacy) Type (Stimulants, Selective serotonin reuptake inhibitors, Antipsychotic drugs, Sleep medications, Others) Application (Autistic disorder, Asperger syndrome, Pervasive developmental disorder, Others)

AutismSTEP, Bristol Myers Squibb Co., CureMark LLC, F. Hoffmann La Roche Ltd., Jazz Pharmaceuticals Plc, Johnson and Johnson Services, Les Laboratoires Servier, Neurim Pharmaceuticals Ltd., Novartis AG, Oryzon Genomics SA, Otsuka Pharmaceutical Co Ltd., Scioto Biosciences Inc., Stalicla SA, Travere Therapeutics Inc., Yamo Pharmaceuticals LLC, Zynerba Pharmaceuticals Inc. are a few of the key vendors in the Autism Spectrum Disorder Therapeutics market.

North America will register the highest growth rate of 38.2% among the other regions. Therefore, the Autism Spectrum Disorder Therapeutics market in North America is expected to garner significant business opportunities for the vendors during the forecast period.

US, Canada, Mexico, Germany, UK, France, Italy, Spain, The Netherlands, Japan, China, India, South Korea, Indonesia, Thailand, Brazil, Saudi Arabia, UAE, Turkey, Argentina, South Africa, Colombia, Israel

  • Development of early diagnostic programs and awareness initiatives is the driving factor this market.

The Autism Spectrum Disorder Therapeutics market vendors should focus on grabbing business opportunities from the Distribution channel segment as it accounted for the largest market share in the base year.
RIA - Research AI Assistant
Ask RIA