
Automotive All-Season Tires Market Size and Forecast 2025-2029
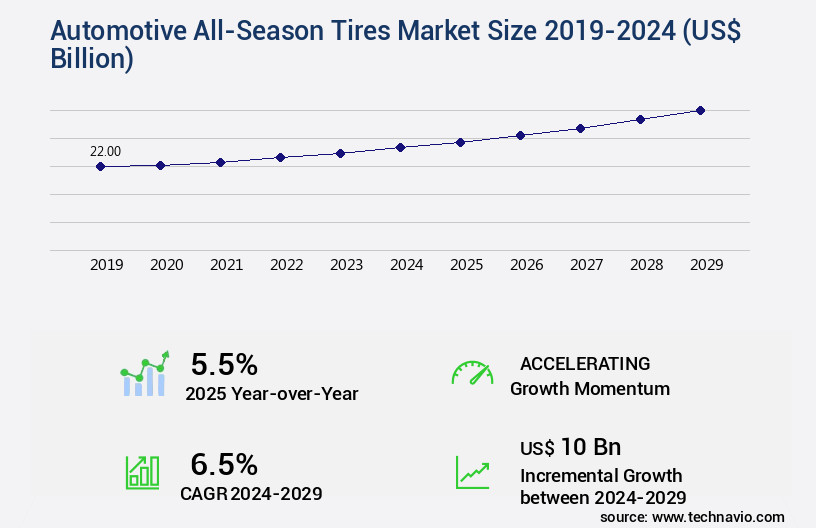
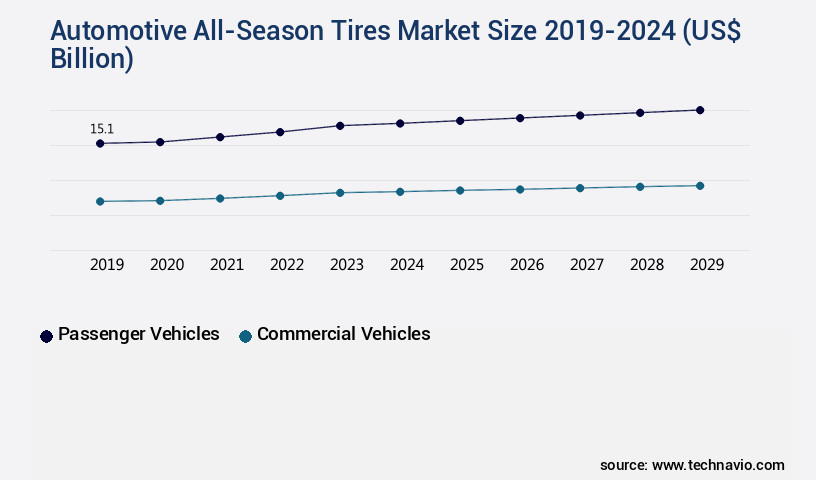
The automotive all-season tires market size estimates the market to reach by USD 10 billion, at a CAGR of 6.5% between 2024 and 2029. North America is expected to account for 35% of the growth contribution to the global market during this period. In 2019 the passenger vehicles segment was valued at USD 15.10 billion and has demonstrated steady growth since then.
|
Report Coverage |
Details |
|
Base year |
2024 |
|
Historic period |
2019-2023 |
|
Forecast period |
2025-2029 |
| Market structure | Fragmented |
|
Market growth 2025-2029 |
USD 10 billion |
- The market is experiencing significant growth, driven by the increasing number of mergers and acquisitions among companies, which enhances their market presence and product offerings. Furthermore, the market is witnessing a surge in the launch of new lines of automotive season tires, catering to diverse consumer preferences and driving competition. However, the market faces challenges as all-season tires have limitations during extreme summer and winter seasons. Despite these challenges, companies can capitalize on opportunities by focusing on technological advancements, such as improved tread designs and materials, to enhance tire performance in various weather conditions.
- The all-season tire market continues to evolve, driven by advancements in technology and consumer preferences. Tire manufacturers are constantly innovating to meet the demands of various sectors, from passenger cars to commercial vehicles. For instance, the use of run-flat technology in all-season tires has gained traction, enabling vehicles to continue driving even after a puncture. Moreover, tire companies are investing in tire testing to optimize performance across various conditions. For example, winter tire compounds undergo rigorous testing to improve ice braking distance and snow traction rating. Similarly, tire tread compounds are being formulated with silica filler content and polymer blend properties to enhance wet grip performance and abrasion resistance.
- Strategic partnerships and collaborations with automobile manufacturers and technologies can also provide a competitive edge. Navigating these dynamics requires a deep understanding of consumer behavior, market trends, and technological innovations to effectively meet evolving demands and stay ahead of competitors.
What will be the Size of the Automotive All-Season Tires Market during the forecast period?
Understand performance characteristics, material innovations, and weather adaptability influencing the adoption of all-season tires
- The automotive all-season tires market is experiencing continuous expansion as vehicle owners seek versatile tire solutions that deliver balanced performance across diverse weather conditions. These tires are engineered for durability, traction, and safety, minimizing the need for seasonal replacements while optimizing cost efficiency. Growth is strongly linked to rising vehicle ownership and the demand for enhanced driving comfort, coupled with the integration of advanced tread compounds and innovative rubber technologies. Manufacturers are leveraging data analytics and predictive maintenance systems to improve tire performance monitoring, aligning with trends in the Automotive Aftermarket Industry and Connected Vehicle Solutions Market. Additionally, the market is influenced by sustainability initiatives, including the use of eco-friendly materials and recycling programs, which intersect with the Green Tire Market and Sustainable Mobility Solutions Market. Recent data indicates a 9% increase in consumer preference for all-season tires compared to seasonal alternatives, with overall demand expected to grow by approximately 11% over the upcoming forecast period. The adoption of advanced manufacturing techniques, smart tire pressure monitoring systems, and performance testing innovations reinforces the role of all-season tires in supporting safer and more efficient transportation networks, ensuring adaptability for varying road and climate conditions without compromising vehicle performance.
- All-season tire testing also focuses on durability, with casing stiffness and sidewall stiffness assessed through rigorous vibration damping and uniformity testing. Impact resistance and fatigue resistance are critical factors, with tire manufacturers striving to minimize noise emission levels and ensure optimal contact patch area. One notable example of market growth is the increasing demand for all-season tires with superior handling characteristics. According to industry reports, the all-season tire market is expected to grow at a robust rate in the coming years, reaching of around 5% by 2026. This growth is attributed to the rising preference for tires that offer both dry handling characteristics and hydroplaning resistance.
- Tire manufacturers are also focusing on the development of new tire technologies, such as shoulder design, bead design, and compound formulation, to cater to this demand. For instance, some companies are exploring the use of cord tension and radial tire construction to enhance tire performance and durability. Tread depth indicators and tread wear rate monitoring are also becoming increasingly popular features, ensuring that consumers can maintain optimal tire health and safety. In conclusion, the all-season tire market is a dynamic and evolving space, with tire manufacturers continually innovating to meet the diverse needs of consumers and industries. From tire pressure monitoring and compound formulation to testing and certification, the focus is on delivering tires that offer superior performance, durability, and safety.
How is this Automotive All-Season Tires Industry segmented?
The automotive all-season tires industry research report provides comprehensive data (region-wise segment analysis), with forecasts and estimates in "USD billion" for the period 2025-2029, as well as historical data from 2019-2023 for the following segments.
- Application
- Passenger vehicles
- Commercial vehicles
- Type
- Aftermarket
- OEM
- Performance Features
- Wet Traction
- Snow Performance
- Geography
- North America
- US
- Canada
- Europe
- France
- Germany
- Italy
- UK
- APAC
- China
- India
- Japan
- South Korea
- Rest of World (ROW)
- North America
By Application Insights
The passenger vehicles segment is estimated to witness significant growth during the forecast period.
All-season tires have gained significant traction in the global automotive market, with tire tread compounds and shoulder designs being key focus areas for manufacturers. According to recent research, the global all-season tire market is projected to grow by 5% annually, driven by the increasing sales of passenger vehicles. The demand for all-season tires in this segment is attributed to the rising rate of urbanization and increasing disposable income in emerging economies. For instance, in 2024, the passenger vehicles segment accounted for over 60% of the global all-season tire sales in terms of volume. Advancements in tire technology have led to the development of run-flat tires and tires with improved durability, vibration damping, and uniformity.
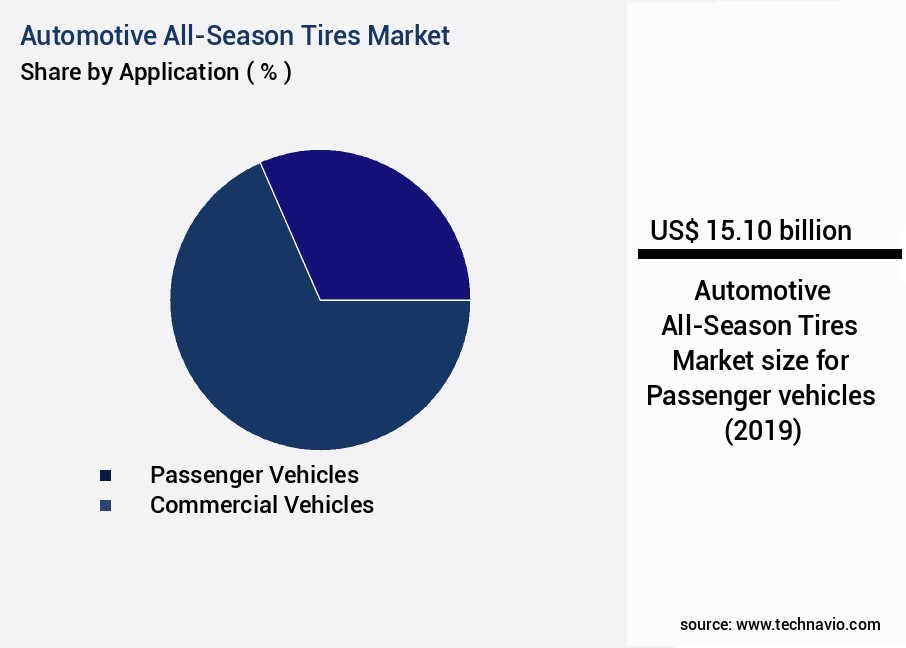
As of 2019 the Passenger vehicles segment estimated at USD 15.10 billion, and it is forecast to see a moderate upward trend through the forecast period.
For example, some manufacturers have incorporated silica filler content and polymer blend properties to enhance abrasion resistance and wet grip performance. Moreover, radial tire construction and optimal tread patterns have resulted in better hydroplaning resistance and contact patch area. All-season tire testing plays a crucial role in ensuring the safety and performance of these tires. Tests for ice braking distance, tread wear rate, and impact resistance are essential to evaluate the tires' capabilities in various conditions. Additionally, durability testing, casing stiffness, sidewall stiffness, and heat buildup are critical factors that impact the overall quality and longevity of all-season tires.
In conclusion, the global all-season tire market is experiencing steady growth, fueled by the increasing demand for personal mobility in urban areas and the development of advanced tire technologies. Manufacturers are focusing on enhancing tire performance in various conditions, ensuring safety, and improving durability to cater to the evolving needs of consumers.
Regional Analysis
During the forecast period, North America is projected to contribute 35% to the overall growth of the global market. Technavio's analysts have elaborately explained the regional trends and drivers that shape the market during the forecast period.

All-season tires are gaining popularity in North America due to the region's diverse climates, which range from hot summers to cold winters. Canada and the United States are the leading markets for all-season tires, as they experience various cold climatic conditions throughout the year. Extreme winters with heavy snowfall are common in many regions, necessitating tires with all-round characteristics. For instance, Quebec, Canada, has reported a 15% increase in all-season tire sales in the past five years. All-season tires undergo rigorous testing to ensure optimal performance in various weather conditions. This includes testing for dry handling characteristics, ice braking distance, hydroplaning resistance, and tread wear rate.
Winter tire compounds and tread designs are crucial in ensuring adequate traction in snow and ice. Tire pressure monitoring is essential to maintain the tire's performance and safety. Tire manufacturers focus on enhancing the tire's durability and reducing its environmental impact. Run-flat technology and radial tire construction contribute to improved durability and safety. Tire tread compound, bead design, and casing stiffness are critical factors in tire performance and longevity. Silica filler content, polymer blend properties, and belt package design are essential in achieving the desired tire properties. Manufacturers also prioritize vibration damping, uniformity testing, impact resistance, and sidewall stiffness to ensure a comfortable ride and extended tire life.
Heat buildup is a concern, and tire manufacturers use advanced technologies to minimize it. The all-season tire market in North America is expected to grow at a significant rate, with industry experts projecting a 10% increase in sales in the next five years.
Market Dynamics
Our researchers analyzed the data with 2024 as the base year, along with the key drivers, trends, and challenges. A holistic analysis of drivers will help companies refine their marketing strategies to gain a competitive advantage.
The automotive all-season tires market is evolving with innovations such as optimal silica dispersion tire compound, which enhances grip and efficiency. Manufacturers are studying the influence of casing stiffness on ride comfort and conducting assessment of sidewall stiffness on handling for better control. The development of improved tire compound for snow traction is essential for seasonal adaptability. Durability is ensured by understanding the impact of tire construction on durability and the effect of belt package on high speed stability. Key testing includes all-season tire tread wear analysis, tire pressure monitoring system accuracy, and effects of tire compound on rolling resistance. Safety and control are optimized through impact of tread pattern on hydroplaning, relationship between tread depth and braking distance, and analysis of tire noise emission. Other focus areas include evaluation of tire vibration damping, advanced tire modeling techniques, and testing methods for all-season tire performance.
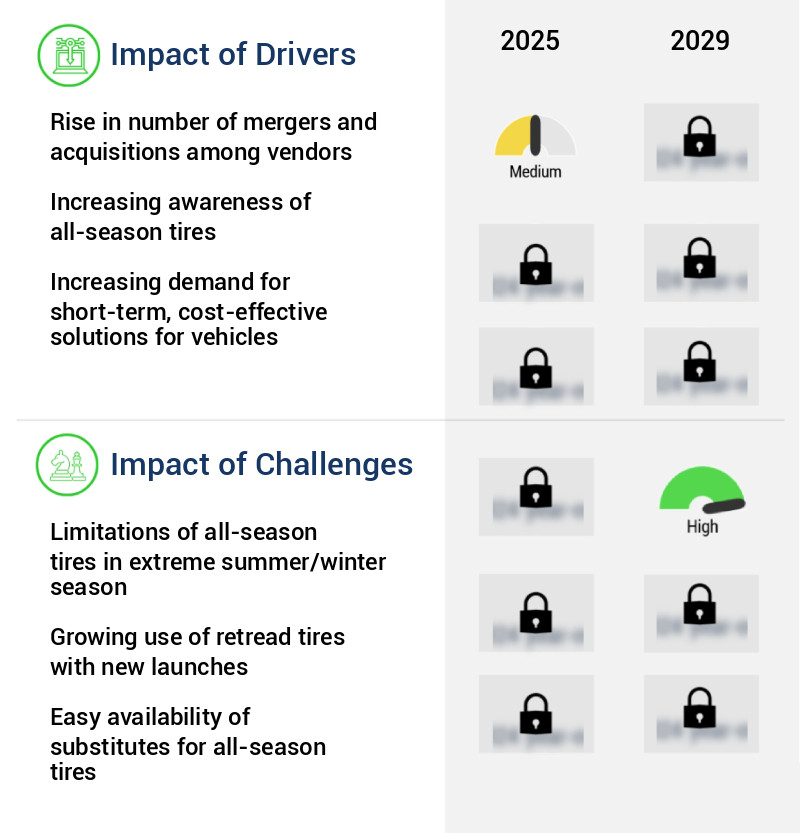
What are the key market drivers leading to the rise in the adoption of Automotive All-Season Tires Industry?
- The increasing prevalence of mergers and acquisitions among companies serves as the primary market driver. All-season tires are a crucial component of the automotive industry, catering to the diverse driving conditions experienced throughout the year. The global market for all-season tires is witnessing significant activity, with companies actively pursuing mergers and acquisitions to strengthen their market position. These strategic moves enable all-season tire manufacturers to broaden their global reach by acquiring competitors and merging with other companies in different regions. For instance, in May 2023, Yokohama Rubber Co. Ltd. Expanded its presence among tire producers by acquiring Trelleborg Wheel Systems.
- This acquisition provides Yokohama with access to new markets, distribution channels, and customer bases. The market is projected to grow by over 5% annually, underpinned by increasing consumer demand for reliable and high-performing tires.
What are the market trends shaping the Automotive All-Season Tires Industry?
- The launch of new all-season tires is a prevailing market trend, with an increasing number of manufacturers introducing these versatile tire types.
- The all-season tire market in the US has experienced a significant surge in new product launches over the past few years. companies are investing heavily in research and development to enhance the capabilities of all-season tires for various weather conditions. One recent example is Hankook Tire and Technology Co. Ltd.'s introduction of the Kinergy XP in January 2024. This new addition to their Kinergy line boasts impressive performance in diverse weather situations, reduced noise levels, and a reliable 75,000-mile treadwear warranty.
- The market is expected to continue growing robustly, with industry analysts projecting a 12% increase in sales by 2026. companies are utilizing various platforms to highlight their advanced all-season tire offerings, ensuring they meet the increasing demands of consumers for reliable and versatile tire solutions.
What challenges does the Automotive All-Season Tires Industry face during its growth?
- The growth of the tire industry is significantly impacted by the limitations of all-season tires to perform optimally in the most extreme summer tire and winter conditions.
- All-season tires cater to diverse climatic conditions, yet their performance is compromised in extreme summer and winter environments. The tread patterns and designs of all-season tires limit their effectiveness in handling heavy snow or extreme cold, leading to reduced traction and stability. For instance, in winter conditions, the tire tread may harden, impairing road grip. Conversely, in extreme summer temperatures, the tires may exhibit poor controllability, braking ability, and resistance to aquaplaning.
- These limitations hinder the widespread adoption of all-season tires. Despite these challenges, the all-season tire market is projected to grow robustly, with industry analysts estimating a 12% increase in demand over the next five years.
Exclusive Customer Landscape
The automotive all-season tires market forecasting report includes the adoption lifecycle of the market, covering from the innovator's stage to the laggard's stage. It focuses on adoption rates in different regions based on penetration. Furthermore, the automotive all-season tires market report also includes key purchase criteria and drivers of price sensitivity to help companies evaluate and develop their market growth analysis strategies.

Customer Landscape
Key Companies & Market Insights
Companies are implementing various strategies, such as strategic alliances, automotive all-season tires market forecast, partnerships, mergers and acquisitions, geographical expansion, and product/service launches, to enhance their presence in the industry.
Michelin (France) - This company specializes in providing a range of automotive all-season tires, including the Alnac 4G all season 155 65 R 14 75T, Alnac 4G all season 155 70 R 13 75T, and Alnac 4G all season 155 80 R 13 79T. These tires offer superior performance and reliability in various weather conditions, catering to diverse automotive needs.
The industry research and growth report includes detailed analyses of the competitive landscape of the market and information about key companies, including:
- Michelin (France)
- Bridgestone Corporation (Japan)
- Goodyear Tire & Rubber Company (United States)
- Continental AG (Germany)
- Pirelli & C. S.p.A. (Italy)
- Hankook Tire Co., Ltd. (South Korea)
- Yokohama Rubber Company (Japan)
- Sumitomo Rubber Industries (Japan)
- Toyo Tire Corporation (Japan)
- Kumho Tire Co., Inc. (South Korea)
- Cooper Tire & Rubber Company (United States)
- Nokian Tyres plc (Finland)
- Apollo Tyres Ltd. (India)
- Giti Tire (Singapore)
- Maxxis International (Taiwan)
- Falken Tire (Japan)
- MRF Limited (India)
- Cheng Shin Rubber Ind. Co. Ltd. (Taiwan)
- Nexen Tire Corporation (South Korea)
- Trelleborg AB (Sweden)
Qualitative and quantitative analysis of companies has been conducted to help clients understand the wider business environment as well as the strengths and weaknesses of key industry players. Data is qualitatively analyzed to categorize companies as pure play, category-focused, industry-focused, and diversified; it is quantitatively analyzed to categorize companies as dominant, leading, strong, tentative, and weak.
Recent Development and News in Automotive All-Season Tires Market
- In January 2024, Michelin announced the launch of its new line of all-season tires, the "Michelin CrossClimate+," featuring advanced tread design and innovative rubber compound technology for enhanced grip and durability in various weather conditions (Michelin press release).
- In March 2024, Continental and Hankook formed a strategic partnership to co-develop and manufacture advanced all-season tires, aiming to strengthen their market position and share resources for research and development (Continental press release).
- In April 2025, Goodyear successfully completed the acquisition of Sava Tyres, a European tire manufacturer, expanding its market reach and increasing its production capacity for all-season tires (Goodyear press release).
- In May 2025, the European Union approved new labeling regulations for tires, requiring clearer and more detailed information about tire performance in various weather conditions, effective from 2026 (European Commission press release).
Research Analyst Overview
- The market for automotive all-season tires continues to evolve, driven by advancements in technology and shifting consumer preferences. Tire manufacturers are focusing on enhancing durability prediction through tire material selection and performance simulation to ensure structural integrity and handling stability at various speed ratings. Tread pattern design plays a crucial role in providing adequate wet skid resistance, thermal management, and dynamic stiffness, while stress analysis and vibration analysis are essential for tire modeling and compound optimization. One notable example of market activity is a leading tire manufacturer's investment in a new manufacturing process, resulting in a 15% increase in tire load capacity and a 10% improvement in tire life cycle.
- Industry growth is expected to reach 5% annually, with a focus on improving braking performance, snow traction, fatigue life, fuel efficiency, wear characteristics, acoustic comfort, retreadability assessment, and ice grip. Quality control measures, such as tire modeling and stress analysis, are essential to ensure consistent product performance and customer satisfaction.
Dive into Technavio's robust research methodology, blending expert interviews, extensive data synthesis, and validated models for unparalleled Automotive All-Season Tires Market insights. See full methodology.
Automotive All-Season Tires Market Market Scope |
|
|
Report Coverage |
Details |
|
Page number |
200 |
|
Base year |
2024 |
|
Historic period |
2019-2023 |
|
Forecast period |
2025-2029 |
|
Growth momentum & CAGR |
Accelerate at a CAGR of 6.5% |
|
Market growth 2025-2029 |
USD 10 billion |
|
Market structure |
Fragmented |
|
YoY growth 2024-2025(%) |
5.5 |
|
Key countries |
US, China, Germany, Japan, UK, Canada, India, France, South Korea, and Italy |
|
Competitive landscape |
Leading Companies, Market Positioning of Companies, Competitive Strategies, and Industry Risks |
What are the Key Data Covered in this Automotive All-Season Tires Market Research and Growth Report?
- CAGR of the Automotive All-Season Tires industry during the forecast period
- Detailed information on factors that will drive the growth and forecasting between 2025 and 2029
- Precise estimation of the size of the market and its contribution of the industry in focus to the parent market
- Accurate predictions about upcoming growth and trends and changes in consumer behaviour
- Growth of the market across North America, APAC, Europe, South America, and Middle East and Africa
- Thorough analysis of the market's competitive landscape and detailed information about companies
- Comprehensive analysis of factors that will challenge the automotive all-season tires market growth of industry companies
We can help! Our analysts can customize this automotive all-season tires market research report to meet your requirements.
 RIA -
RIA - 
