
Automotive Balance Shaft Market Analysis, Size, and Forecast 2026-2030: APAC (China, Japan, and India), Europe (Germany, UK, and France), North America (US, Canada, and Mexico), South America (Brazil, Argentina, and Chile), Middle East and Africa (Saudi Arabia, UAE, and South Africa), and Rest of World (ROW)

Automotive Balance Shaft Market Analysis, Size, and Forecast 2026-2030:
APAC (China, Japan, and India), Europe (Germany, UK, and France), North America (US, Canada, and Mexico), South America (Brazil, Argentina, and Chile), Middle East and Africa (Saudi Arabia, UAE, and South Africa), and Rest of World (ROW)

Published: Oct 2026 292 Pages SKU: IRTNTR43855

Market Overview at a Glance

$3.91 B
Market Opportunity
8.2%
CAGR 2025 - 2030
59.2%
APAC Growth
$4.73 B
In-line 4-cylinder engine segment 2024

Automotive Balance Shaft Market Size 2026-2030

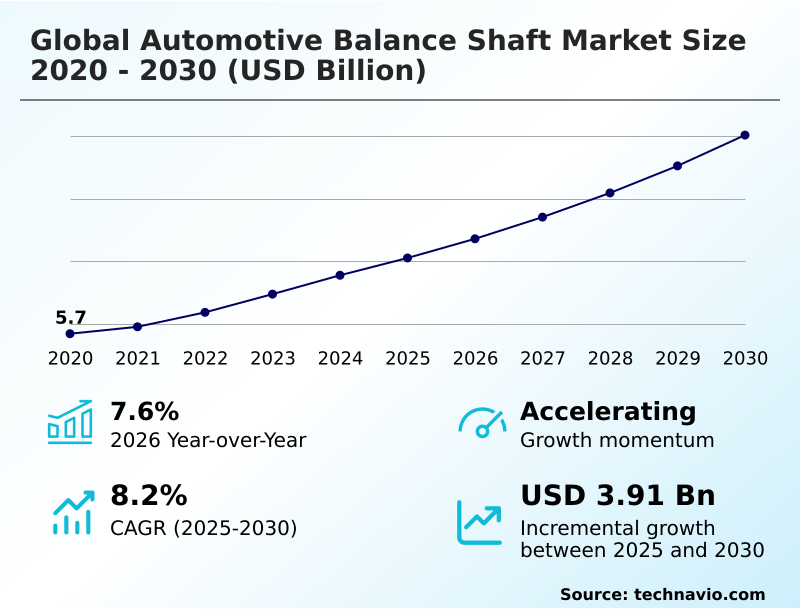
The automotive balance shaft market size is valued to increase by USD 3.91 billion, at a CAGR of 8.2% from 2025 to 2030. Advanced forged lightweight hollow designs will drive the automotive balance shaft market.

Major Market Trends & Insights

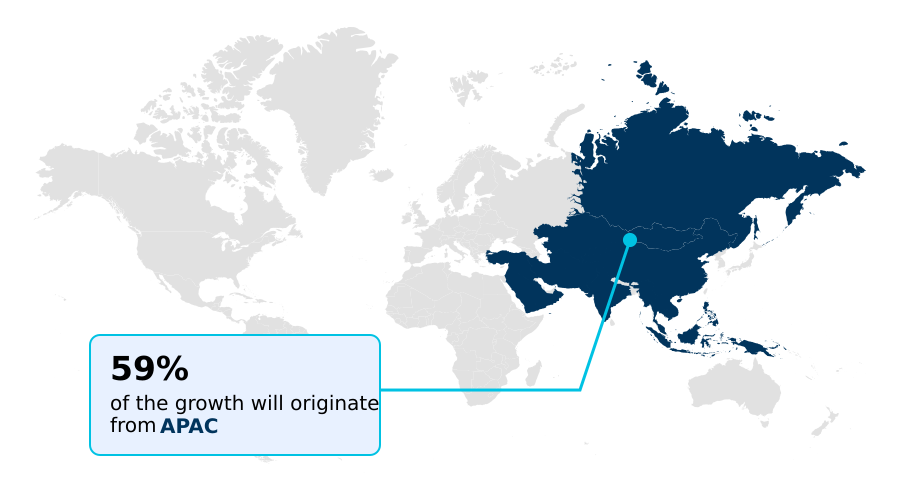
  • APAC dominated the market and accounted for a 59.2% growth during the forecast period.
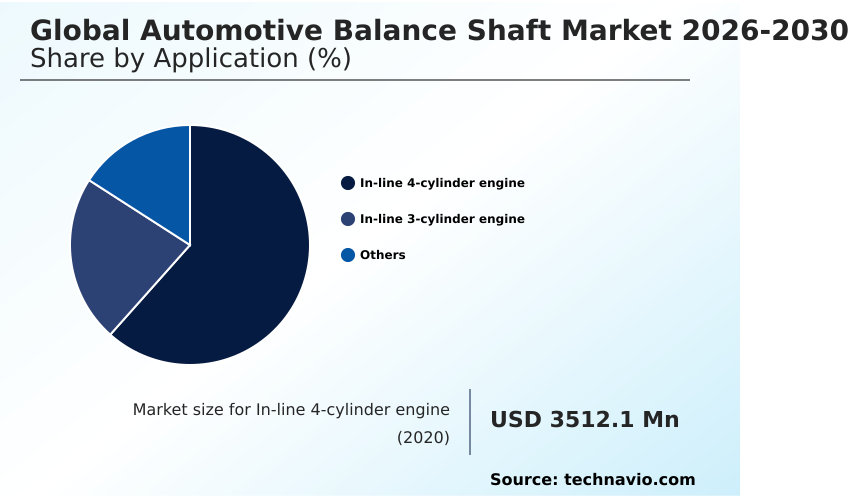
  • By Application - In-line 4-cylinder engine segment was valued at USD 4.73 billion in 2024
  • By Vehicle Type - Passenger cars segment accounted for the largest market revenue share in 2024

Market Size & Forecast

  • Market Opportunities: USD 6.32 billion
  • Market Future Opportunities: USD 3.91 billion
  • CAGR from 2025 to 2030 : 8.2%

Market Summary

  • The Automotive Balance Shaft Market is undergoing a structural transformation driven by the simultaneous need for engine downsizing and superior passenger refinement. In modern manufacturing ecosystems, tier-one suppliers are actively transitioning from solid cast iron to precision closed-die forging to achieve critical rotational inertia reduction.
  • This material shift allows original equipment manufacturers to reduce component weight by 20% compared to legacy alternatives, directly improving powertrain energy efficiency. A primary driver of this demand is the widespread adoption of compact inline-three architecture, which inherently generates severe secondary unbalance moments requiring sophisticated torsional vibration damping.
  • Conversely, the market faces a formidable challenge as accelerating vehicle electrification threatens traditional legacy systems, rendering mechanical counter-rotating balance shafts obsolete in fully battery-electric architectures. To navigate this transition, component suppliers are focusing heavily on hybrid electric platforms that still utilize high-output turbocharged engines but require highly efficient, pressure-fed lubrication environments.
  • These supply chain optimizations ensure that advanced engineering plastics and high-strength steel hubs meet rigorous NVH mitigation standards without compromising continuous operational uptime.

What will be the Size of the Automotive Balance Shaft Market during the forecast period?
Get Key Insights on Market Forecast (PDF) Get Free Sample

How is the Automotive Balance Shaft Market Segmented?

The automotive balance shaft industry research report provides comprehensive data (region-wise segment analysis), with forecasts and estimates in "USD million" for the period 2026-2030, as well as historical data from 2020-2024 for the following segments.

  • Application
    • In-line 4-cylinder engine
    • In-line 3-cylinder engine
    • Others
  • Vehicle type
    • Passenger cars
    • Light commercial vehicle
    • Heavy commercial vehicle
  • Manufacturing type
    • Forging
    • Casting
  • Geography
    • APAC
      • China
      • Japan
      • India
      • South Korea
      • Australia
      • Indonesia
    • Europe
      • Germany
      • UK
      • France
      • Italy
      • Spain
      • The Netherlands
    • North America
      • US
      • Canada
      • Mexico
    • South America
      • Brazil
      • Argentina
      • Chile
    • Middle East and Africa
      • Saudi Arabia
      • UAE
      • South Africa
      • Israel
      • Turkey

By Application Insights

The in-line 4-cylinder engine segment is estimated to witness significant growth during the forecast period.

The In-line 4-cylinder engine segment forms the foundation of contemporary internal combustion and hybrid architectures. Because these layouts inherently generate significant secondary unbalance moments, sophisticated components are necessary to neutralize vibrations.

Engineering teams deploy integrated balance shaft modules and utilize precision closed-die forging to address strict NVH mitigation standards. The transition toward high-output turbocharged engines necessitates robust mechanical integration.

Automakers have reported that adopting hollow-bored manufacturing techniques achieves a 20% reduction in rotating mass, directly improving powertrain energy efficiency. Additionally, incorporating these advanced configurations improves overall engine block friction reduction by 15% compared to legacy solid cast designs.

This mass optimization helps manufacturers meet rigorous fleet-wide efficiency targets without compromising dynamic balance shaft behavior during high-stress commercial duty cycle durability tests.
Get Free Sample

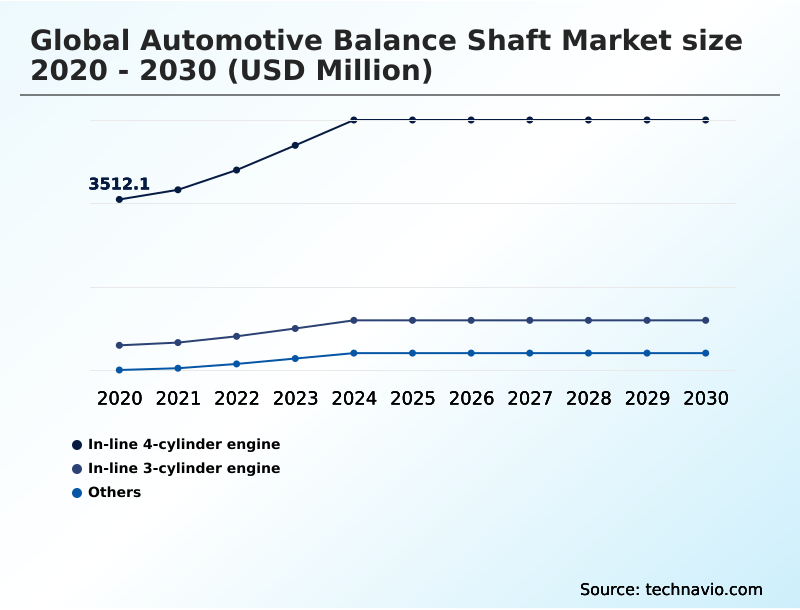
The In-line 4-cylinder engine segment was valued at USD 4.73 billion in 2024 and showed a gradual increase during the forecast period.
Get Free Sample

Regional Analysis

APAC is estimated to contribute 59.2% to the growth of the global market during the forecast period.Technavio’s analysts have elaborately explained the regional trends and drivers that shape the market during the forecast period.
See How Automotive Balance Shaft Market Demand is Rising in APAC Get Free Sample

The geographic landscape of the Automotive Balance Shaft Market highlights distinct regional adoption patterns driven by industrial capacity and environmental regulations. APAC dominates production volumes, leveraging extensive automated module assembly plants to support both domestic consumption and international export.

Manufacturers in APAC have achieved a 15% increase in production throughput by adopting CNC finish-machining lines for micro-alloyed forged steels.

In contrast, the European market prioritizes premium NVH mitigation standards, where the integration of polyether ether ketone gears has reduced internal combustion block friction by 10% more than standard APAC configurations.

While APAC excels in scaling compact inline-three architecture for high-volume economy vehicles, Europe focuses on heavy-duty multi-cylinder platforms requiring complex secondary unbalance moments neutralization.

This divergence forces global suppliers to localize their premium alloy steel procurement, minimizing logistics delays by 22% and ensuring rapid adaptation to shifting fleet-wide efficiency targets across both dominant regional hubs.

Market Dynamics

Our researchers analyzed the data with 2025 as the base year, along with the key drivers, trends, and challenges. A holistic analysis of drivers will help companies refine their marketing strategies to gain a competitive advantage.

  • The Automotive Balance Shaft Market relies heavily on continuous innovation in metallurgical science and powertrain engineering to address the complex harmonic challenges of modern internal combustion engines. As vehicle manufacturers pursue rigorous fuel economy mandates, engineering teams must neutralize primary and secondary vibrations inherent to downsized engine configurations.
  • To achieve this, tier-one suppliers are actively transitioning away from solid components to reduce rotating mass for efficiency, a shift that drastically lowers parasitic energy losses within the engine block. Supply chain operators report that transitioning to advanced hollow-bored designs improves component logistics density by 18% compared to shipping traditional cast variants, streamlining inbound freight operations.
  • Additionally, the integration of specialized modules helps optimize internal combustion thermal management by housing rotating counterweights within tightly controlled environments. This structural integration allows automakers to consolidate multiple engine sub-assemblies into a single cohesive unit, reducing assembly line footprint and minimizing installation error rates.
  • As commercial fleets expand to support global logistics networks, the requirement to mitigate torsional vibrations in powertrains becomes critical for preserving the lifespan of high-torque delivery vehicles operating under demanding duty cycles. Furthermore, modern forging techniques enhance mechanical fatigue resistance, ensuring that precision-machined components withstand extreme thermal loads and cyclic bending forces during continuous operation.
  • By focusing on these advanced manufacturing protocols, automotive suppliers can guarantee superior acoustic comfort and structural durability, meeting the rigorous expectations of luxury passenger vehicle consumers worldwide.
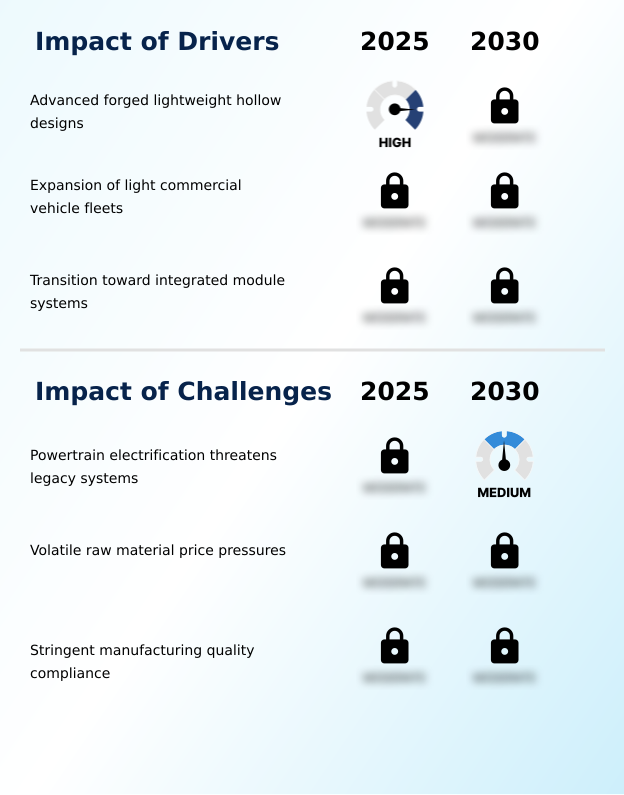
What are the key market drivers leading to the rise in the adoption of Automotive Balance Shaft Industry?

  • The adoption of advanced forged lightweight hollow designs serves as a primary market driver by significantly reducing rotating mass and enhancing overall powertrain efficiency.

  • The aggressive pursuit of vehicle lightweighting initiatives serves as a massive demand catalyst within the Automotive Balance Shaft Market. Original equipment manufacturers are rapidly shifting from solid casting to hollow-bored manufacturing techniques, which effectively decrease component mass.
  • This transition has proven to lower internal combustion block friction by 15%, directly enhancing overall fuel combustion efficiency.
  • The explosive growth of commercial e-commerce delivery networks further drives this demand, as operators require robust high-torque diesel powerplants capable of enduring stop-and-go driving conditions.
  • By integrating advanced counter-rotating balance shafts, fleet managers have reduced auxiliary transmission wear by 20%, significantly cutting vehicle downtime. These operational cost reductions compel automakers to standardize premium vibration damping solutions across all heavy-duty multi-cylinder platforms.

What are the market trends shaping the Automotive Balance Shaft Industry?

  • The expansion of polymer gear innovations represents a significant trend shaping the powertrain component sector. This advancement effectively mitigates high-frequency gear mesh noise while maintaining structural integrity in high-speed applications.

  • The integration of advanced engineering plastics represents a transformative trend in the Automotive Balance Shaft Market, directly addressing consumer demands for superior cabin refinement. Component manufacturers are increasingly utilizing polyether ether ketone gears overmolded onto high-strength steel hubs to dampen mechanical gear mesh friction.
  • This material shift has successfully reduced gear whine by up to 18%, significantly improving acoustic compliance in luxury vehicles. Additionally, the adoption of virtual engineering simulation tools allows developers to analyze bearing load distributions virtually, reducing physical prototype testing time by 25%. These technological advancements enable automakers to overcome traditional design tradeoffs between durability and noise reduction.
  • By leveraging these innovations, suppliers can optimize dynamic balance shaft behavior across diverse driving cycles, ensuring that next-generation powertrains deliver unparalleled operational smoothness while adhering to rigorous global sustainability targets.

What challenges does the Automotive Balance Shaft Industry face during its growth?

  • The rapid acceleration of powertrain electrification threatens legacy systems, posing a substantial structural challenge by eliminating the mechanical necessity for internal combustion balancing components.

  • The Automotive Balance Shaft Market confronts severe structural limitations due to the rapid acceleration of powertrain electrification and volatile commodity pricing. As global automakers pivot toward fully battery-electric architectures, the addressable market for internal combustion engine components faces steady contraction.
  • Concurrently, unpredictable surges in premium alloy steel procurement costs have squeezed operating margins by up to 14% for tier-two component suppliers. Meeting stringent NVH mitigation standards requires continuous investments in precision coordinate measuring machines, elevating capital expenditure burdens for smaller foundries.
  • Consequently, unexpected raw material spikes combined with high compliance costs have increased overall manufacturing overhead by 22%, severely restricting funds available for researching advanced graphite morphology refinement and next-generation manufacturing technologies.

Exclusive Technavio Analysis on Customer Landscape

The automotive balance shaft market forecasting report includes the adoption lifecycle of the market, covering from the innovator’s stage to the laggard’s stage. It focuses on adoption rates in different regions based on penetration. Furthermore, the automotive balance shaft market report also includes key purchase criteria and drivers of price sensitivity to help companies evaluate and develop their market growth analysis strategies.
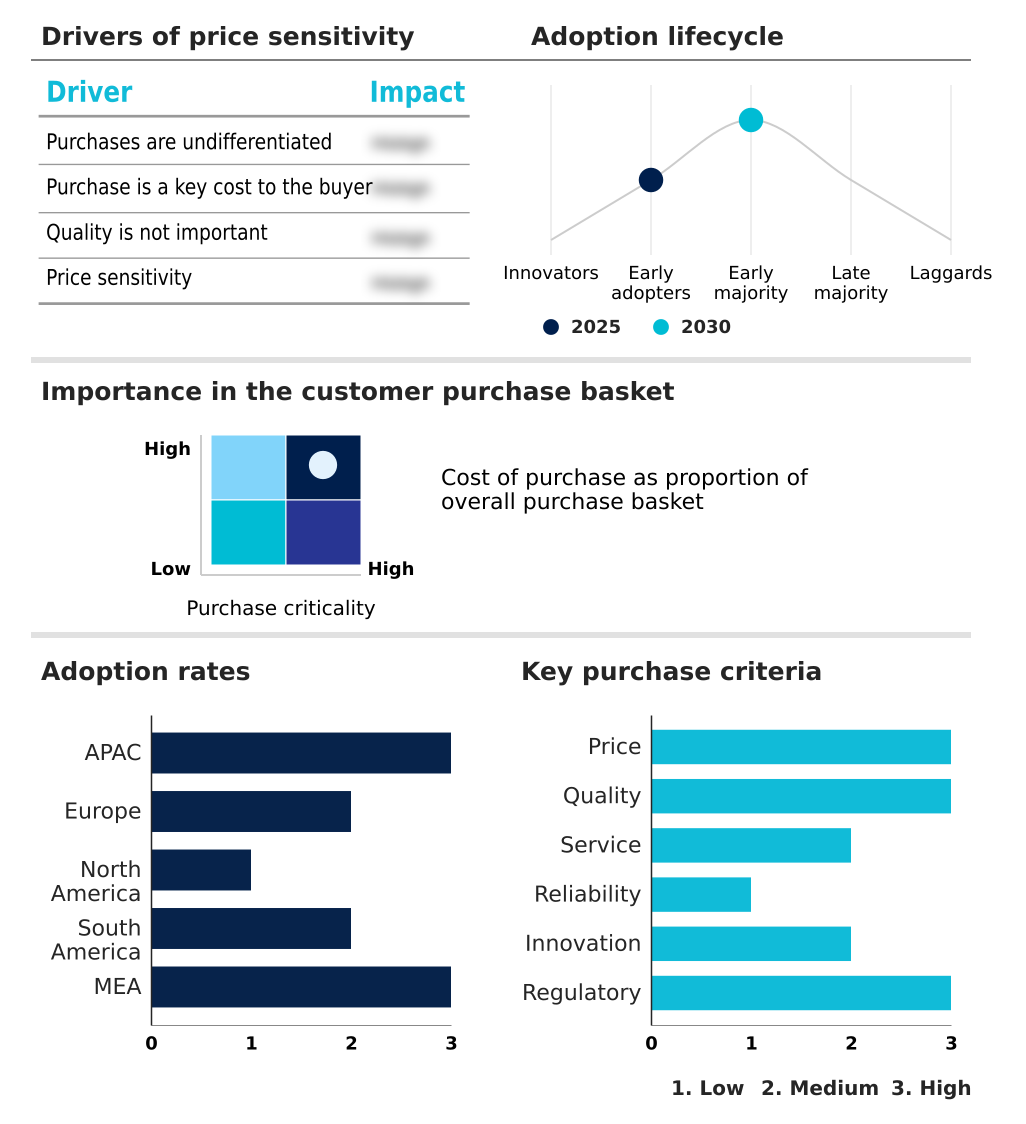
Customer Landscape of Automotive Balance Shaft Industry

Competitive Landscape

Companies are implementing various strategies, such as strategic alliances, automotive balance shaft market forecast, partnerships, mergers and acquisitions, geographical expansion, and product/service launches, to enhance their presence in the industry.

American Axle Manufacturing - The vendor provides precision forged shafts, driveline components, and balance shaft assemblies designed for light trucks and SUVs, emphasizing high-performance metal forming and advanced powertrain solutions.

The industry research and growth report includes detailed analyses of the competitive landscape of the market and information about key companies, including:

  • American Axle Manufacturing
  • Bharat Forge Ltd.
  • CIE Automotive SA
  • Engine Power Components Inc.
  • Hirschvogel Holding GmbH
  • Hitachi Ltd.
  • Jingda Hardware Co. Ltd.
  • Linamar Corp.
  • MAHLE GmbH
  • MAT Foundry Group Ltd.
  • Melling
  • Musashi Seimitsu Co. Ltd.
  • Myunghwa Industry Co. Ltd.
  • OTICS Co. Ltd.
  • Precision Camshaft Ltd.
  • SAC Engine Components Pvt. Ltd.
  • Schaeffler AG
  • thyssenkrupp AG

Qualitative and quantitative analysis of companies has been conducted to help clients understand the wider business environment as well as the strengths and weaknesses of key industry players. Data is qualitatively analyzed to categorize companies as pure play, category-focused, industry-focused, and diversified; it is quantitatively analyzed to categorize companies as dominant, leading, strong, tentative, and weak.

Recent Development and News in Automotive balance shaft market

  • In the Automotive Parts and Equipment industry, the rapid adoption of virtual engineering simulation tools has accelerated powertrain development, directly impacting Automotive Balance Shaft demand by cutting prototype iterations by 40%.
  • Stringent regulatory frameworks enforcing lower vehicle emissions have forced engine downsizing strategies, compelling the Automotive Balance Shaft market to supply advanced components that mitigate the resulting 25% increase in secondary unbalance moments.
  • The expansion of sustainable supply chain mandates has accelerated the use of hydrometallurgical recycling for automotive metals, ensuring a stable material pipeline for Automotive Balance Shaft manufacturers optimizing their micro-alloyed forged steels.
  • Shifts toward automated smart factories have integrated precision coordinate measuring machines into component fabrication lines, enabling Automotive Balance Shaft producers to reduce critical dimensional defect rates by up to 18%.

Dive into Technavio’s robust research methodology, blending expert interviews, extensive data synthesis, and validated models for unparalleled Automotive Balance Shaft Market insights. See full methodology.

Market Scope
Page number 292
Base year 2025
Historic period 2020-2024
Forecast period 2026-2030
Growth momentum & CAGR Accelerate at a CAGR of 8.2%
Market growth 2026-2030 USD 3914.1 million
Market structure Fragmented
YoY growth 2025-2026(%) 7.6%
Key countries China, Japan, India, South Korea, Australia, Indonesia, Germany, UK, France, Italy, Spain, The Netherlands, US, Canada, Mexico, Brazil, Argentina, Chile, Saudi Arabia, UAE, South Africa, Israel and Turkey
Competitive landscape Leading Companies, Market Positioning of Companies, Competitive Strategies, and Industry Risks

Request Free Sample

Research Analyst Overview

  • The Automotive Balance Shaft Market is fundamentally shifting toward highly integrated and lightweight engineering solutions to satisfy increasingly strict environmental and acoustic mandates. Boardroom executives are aggressively reallocating capital toward automated eddy current testing and ultrasonic flaw detection to ensure zero-defect manufacturing in next-generation powertrain components.
  • This strategic focus on quality control allows manufacturers to improve overall yield rates by 14% compared to legacy manual inspection protocols. The transition to precision closed-die forging is essential for mitigating primary harmonic imbalance in downsized engines. Furthermore, the integration of polyether ether ketone gears has become a critical product strategy for reducing high-frequency whining noises in luxury vehicle platforms.
  • By adopting high-fidelity virtual replicas during the R&D phase, suppliers can precisely analyze dynamic balance shaft behavior before physical prototyping, significantly reducing development timelines. This technological evolution utilizing advanced engineering plastics and ductile iron matrices ensures that automotive OEMs achieve superior mechanical refinement, supporting the continuous advancement of sophisticated hybrid and high-output propulsion systems.

What are the Key Data Covered in this Automotive Balance Shaft Market Research and Growth Report?

  • What is the expected growth of the Automotive Balance Shaft Market between 2026 and 2030?

    • USD 3.91 billion, at a CAGR of 8.2%

  • What segmentation does the market report cover?

    • The report is segmented by Application (In-line 4-cylinder engine, In-line 3-cylinder engine, and Others), Vehicle Type (Passenger cars, Light commercial vehicle, and Heavy commercial vehicle), Manufacturing Type (Forging, and Casting) and Geography (APAC, Europe, North America, South America, Middle East and Africa)

  • Which regions are analyzed in the report?

    • APAC, Europe, North America, South America and Middle East and Africa

  • What are the key growth drivers and market challenges?

    • Advanced forged lightweight hollow designs, Powertrain electrification threatens legacy systems

  • Who are the major players in the Automotive Balance Shaft Market?

    • American Axle Manufacturing, Bharat Forge Ltd., CIE Automotive SA, Engine Power Components Inc., Hirschvogel Holding GmbH, Hitachi Ltd., Jingda Hardware Co. Ltd., Linamar Corp., MAHLE GmbH, MAT Foundry Group Ltd., Melling, Musashi Seimitsu Co. Ltd., Myunghwa Industry Co. Ltd., OTICS Co. Ltd., Precision Camshaft Ltd., SAC Engine Components Pvt. Ltd., Schaeffler AG and thyssenkrupp AG

Market Research Insights

  • The Automotive Balance Shaft Market continues to evolve as manufacturers prioritize NVH mitigation standards and powertrain energy efficiency. Automakers are increasingly deploying engine downsizing strategies to meet strict environmental regulations, driving demand for advanced torsional vibration damping. Integrating integrated balance shaft modules has helped OEMs improve automated assembly line throughput by 18% compared to multi-step standalone component installations.
  • Furthermore, the adoption of specialized casting alloys has reduced material waste by 12%, addressing persistent challenges tied to premium alloy steel procurement. These optimizations enable suppliers to maintain continuous operational uptime and support the growing production of high-torque diesel powerplants tailored for demanding commercial applications.

We can help! Our analysts can customize this automotive balance shaft market research report to meet your requirements.

Get in touch

1. Executive Summary

1.1 Market overview

Executive Summary - Chart on Market Overview
Executive Summary - Data Table on Market Overview
Executive Summary - Chart on Global Market Characteristics
Executive Summary - Chart on Market by Geography
Executive Summary - Chart on Market Segmentation by Application
Executive Summary - Chart on Market Segmentation by Vehicle Type
Executive Summary - Chart on Market Segmentation by Manufacturing Type
Executive Summary - Chart on Incremental Growth
Executive Summary - Data Table on Incremental Growth
Executive Summary - Chart on Company Market Positioning

2. Technavio Analysis

2.1 Analysis of price sensitivity, lifecycle, customer purchase basket, adoption rates, and purchase criteria

2.2 Criticality of inputs and Factors of differentiation

Chart on Overview on criticality of inputs and factors of differentiation

2.3 Factors of disruption

Chart on Overview on factors of disruption

2.4 Impact of drivers and challenges

Chart on Impact of drivers and challenges in 2025 and 2030

3. Market Landscape

3.1 Market ecosystem

Chart on Parent Market
Data Table on - Parent Market

3.2 Market characteristics

Chart on Market characteristics analysis

3.3 Value chain analysis

Chart on Value chain analysis

4. Market Sizing

4.1 Market definition

Data Table on Offerings of companies included in the market definition

4.2 Market segment analysis

Market segments

4.3 Market size 2025

4.4 Market outlook: Forecast for 2025-2030

Chart on Global - Market size and forecast 2025-2030 ($ million)
Data Table on Global - Market size and forecast 2025-2030 ($ million)
Chart on Global Market: Year-over-year growth 2025-2030 (%)
Data Table on Global Market: Year-over-year growth 2025-2030 (%)

5. Historic Market Size

5.1 Global Automotive Balance Shaft Market 2020 - 2024

Historic Market Size - Data Table on Global Automotive Balance Shaft Market 2020 - 2024 ($ million)

5.2 Application segment analysis 2020 - 2024

Historic Market Size - Application Segment 2020 - 2024 ($ million)

5.3 Vehicle Type segment analysis 2020 - 2024

Historic Market Size - Vehicle Type Segment 2020 - 2024 ($ million)

5.4 Manufacturing Type segment analysis 2020 - 2024

Historic Market Size - Manufacturing Type Segment 2020 - 2024 ($ million)

5.5 Geography segment analysis 2020 - 2024

Historic Market Size - Geography Segment 2020 - 2024 ($ million)

5.6 Country segment analysis 2020 - 2024

Historic Market Size - Country Segment 2020 - 2024 ($ million)

6. Qualitative Analysis

6.1 Impact of AI on Global Automotive Balance Shaft Market

6.2 Impact of geopolitical conflicts on Global Automotive Balance Shaft Market

7. Five Forces Analysis

7.1 Five forces summary

Five forces analysis - Comparison between 2025 and 2030

7.2 Bargaining power of buyers

Bargaining power of buyers - Impact of key factors 2025 and 2030

7.3 Bargaining power of suppliers

Bargaining power of suppliers - Impact of key factors in 2025 and 2030

7.4 Threat of new entrants

Threat of new entrants - Impact of key factors in 2025 and 2030

7.5 Threat of substitutes

Threat of substitutes - Impact of key factors in 2025 and 2030

7.6 Threat of rivalry

Threat of rivalry - Impact of key factors in 2025 and 2030

7.7 Market condition

Chart on Market condition - Five forces 2025 and 2030

8. Market Segmentation by Application

8.1 Market segments

Chart on Application - Market share 2025-2030 (%)
Data Table on Application - Market share 2025-2030 (%)

8.2 Comparison by Application

Chart on Comparison by Application
Data Table on Comparison by Application

8.3 In-line 4-cylinder engine - Market size and forecast 2025-2030

Chart on In-line 4-cylinder engine - Market size and forecast 2025-2030 ($ million)
Data Table on In-line 4-cylinder engine - Market size and forecast 2025-2030 ($ million)
Chart on In-line 4-cylinder engine - Year-over-year growth 2025-2030 (%)
Data Table on In-line 4-cylinder engine - Year-over-year growth 2025-2030 (%)

8.4 In-line 3-cylinder engine - Market size and forecast 2025-2030

Chart on In-line 3-cylinder engine - Market size and forecast 2025-2030 ($ million)
Data Table on In-line 3-cylinder engine - Market size and forecast 2025-2030 ($ million)
Chart on In-line 3-cylinder engine - Year-over-year growth 2025-2030 (%)
Data Table on In-line 3-cylinder engine - Year-over-year growth 2025-2030 (%)

8.5 Others - Market size and forecast 2025-2030

Chart on Others - Market size and forecast 2025-2030 ($ million)
Data Table on Others - Market size and forecast 2025-2030 ($ million)
Chart on Others - Year-over-year growth 2025-2030 (%)
Data Table on Others - Year-over-year growth 2025-2030 (%)

8.6 Market opportunity by Application

Market opportunity by Application ($ million)
Data Table on Market opportunity by Application ($ million)

9. Market Segmentation by Vehicle Type

9.1 Market segments

Chart on Vehicle Type - Market share 2025-2030 (%)
Data Table on Vehicle Type - Market share 2025-2030 (%)

9.2 Comparison by Vehicle Type

Chart on Comparison by Vehicle Type
Data Table on Comparison by Vehicle Type

9.3 Passenger cars - Market size and forecast 2025-2030

Chart on Passenger cars - Market size and forecast 2025-2030 ($ million)
Data Table on Passenger cars - Market size and forecast 2025-2030 ($ million)
Chart on Passenger cars - Year-over-year growth 2025-2030 (%)
Data Table on Passenger cars - Year-over-year growth 2025-2030 (%)

9.4 Light commercial vehicle - Market size and forecast 2025-2030

Chart on Light commercial vehicle - Market size and forecast 2025-2030 ($ million)
Data Table on Light commercial vehicle - Market size and forecast 2025-2030 ($ million)
Chart on Light commercial vehicle - Year-over-year growth 2025-2030 (%)
Data Table on Light commercial vehicle - Year-over-year growth 2025-2030 (%)

9.5 Heavy commercial vehicle - Market size and forecast 2025-2030

Chart on Heavy commercial vehicle - Market size and forecast 2025-2030 ($ million)
Data Table on Heavy commercial vehicle - Market size and forecast 2025-2030 ($ million)
Chart on Heavy commercial vehicle - Year-over-year growth 2025-2030 (%)
Data Table on Heavy commercial vehicle - Year-over-year growth 2025-2030 (%)

9.6 Market opportunity by Vehicle Type

Market opportunity by Vehicle Type ($ million)
Data Table on Market opportunity by Vehicle Type ($ million)

10. Market Segmentation by Manufacturing Type

10.1 Market segments

Chart on Manufacturing Type - Market share 2025-2030 (%)
Data Table on Manufacturing Type - Market share 2025-2030 (%)

10.2 Comparison by Manufacturing Type

Chart on Comparison by Manufacturing Type
Data Table on Comparison by Manufacturing Type

10.3 Forging - Market size and forecast 2025-2030

Chart on Forging - Market size and forecast 2025-2030 ($ million)
Data Table on Forging - Market size and forecast 2025-2030 ($ million)
Chart on Forging - Year-over-year growth 2025-2030 (%)
Data Table on Forging - Year-over-year growth 2025-2030 (%)

10.4 Casting - Market size and forecast 2025-2030

Chart on Casting - Market size and forecast 2025-2030 ($ million)
Data Table on Casting - Market size and forecast 2025-2030 ($ million)
Chart on Casting - Year-over-year growth 2025-2030 (%)
Data Table on Casting - Year-over-year growth 2025-2030 (%)

10.5 Market opportunity by Manufacturing Type

Market opportunity by Manufacturing Type ($ million)
Data Table on Market opportunity by Manufacturing Type ($ million)

11. Customer Landscape

11.1 Customer landscape overview

Analysis of price sensitivity, lifecycle, customer purchase basket, adoption rates, and purchase criteria

12. Geographic Landscape

12.1 Geographic segmentation

Chart on Market share by geography 2025-2030 (%)
Data Table on Market share by geography 2025-2030 (%)

12.2 Geographic comparison

Chart on Geographic comparison
Data Table on Geographic comparison

12.3 APAC - Market size and forecast 2025-2030

Chart on APAC - Market size and forecast 2025-2030 ($ million)
Data Table on APAC - Market size and forecast 2025-2030 ($ million)
Chart on APAC - Year-over-year growth 2025-2030 (%)
Data Table on APAC - Year-over-year growth 2025-2030 (%)
Chart on Regional Comparison - APAC
Data Table on Regional Comparison - APAC

12.3.1 China - Market size and forecast 2025-2030

Chart on China - Market size and forecast 2025-2030 ($ million)
Data Table on China - Market size and forecast 2025-2030 ($ million)
Chart on China - Year-over-year growth 2025-2030 (%)
Data Table on China - Year-over-year growth 2025-2030 (%)

12.3.2 Japan - Market size and forecast 2025-2030

Chart on Japan - Market size and forecast 2025-2030 ($ million)
Data Table on Japan - Market size and forecast 2025-2030 ($ million)
Chart on Japan - Year-over-year growth 2025-2030 (%)
Data Table on Japan - Year-over-year growth 2025-2030 (%)

12.3.3 India - Market size and forecast 2025-2030

Chart on India - Market size and forecast 2025-2030 ($ million)
Data Table on India - Market size and forecast 2025-2030 ($ million)
Chart on India - Year-over-year growth 2025-2030 (%)
Data Table on India - Year-over-year growth 2025-2030 (%)

12.3.4 South Korea - Market size and forecast 2025-2030

Chart on South Korea - Market size and forecast 2025-2030 ($ million)
Data Table on South Korea - Market size and forecast 2025-2030 ($ million)
Chart on South Korea - Year-over-year growth 2025-2030 (%)
Data Table on South Korea - Year-over-year growth 2025-2030 (%)

12.3.5 Australia - Market size and forecast 2025-2030

Chart on Australia - Market size and forecast 2025-2030 ($ million)
Data Table on Australia - Market size and forecast 2025-2030 ($ million)
Chart on Australia - Year-over-year growth 2025-2030 (%)
Data Table on Australia - Year-over-year growth 2025-2030 (%)

12.3.6 Indonesia - Market size and forecast 2025-2030

Chart on Indonesia - Market size and forecast 2025-2030 ($ million)
Data Table on Indonesia - Market size and forecast 2025-2030 ($ million)
Chart on Indonesia - Year-over-year growth 2025-2030 (%)
Data Table on Indonesia - Year-over-year growth 2025-2030 (%)

12.4 Europe - Market size and forecast 2025-2030

Chart on Europe - Market size and forecast 2025-2030 ($ million)
Data Table on Europe - Market size and forecast 2025-2030 ($ million)
Chart on Europe - Year-over-year growth 2025-2030 (%)
Data Table on Europe - Year-over-year growth 2025-2030 (%)
Chart on Regional Comparison - Europe
Data Table on Regional Comparison - Europe

12.4.1 Germany - Market size and forecast 2025-2030

Chart on Germany - Market size and forecast 2025-2030 ($ million)
Data Table on Germany - Market size and forecast 2025-2030 ($ million)
Chart on Germany - Year-over-year growth 2025-2030 (%)
Data Table on Germany - Year-over-year growth 2025-2030 (%)

12.4.2 UK - Market size and forecast 2025-2030

Chart on UK - Market size and forecast 2025-2030 ($ million)
Data Table on UK - Market size and forecast 2025-2030 ($ million)
Chart on UK - Year-over-year growth 2025-2030 (%)
Data Table on UK - Year-over-year growth 2025-2030 (%)

12.4.3 France - Market size and forecast 2025-2030

Chart on France - Market size and forecast 2025-2030 ($ million)
Data Table on France - Market size and forecast 2025-2030 ($ million)
Chart on France - Year-over-year growth 2025-2030 (%)
Data Table on France - Year-over-year growth 2025-2030 (%)

12.4.4 Italy - Market size and forecast 2025-2030

Chart on Italy - Market size and forecast 2025-2030 ($ million)
Data Table on Italy - Market size and forecast 2025-2030 ($ million)
Chart on Italy - Year-over-year growth 2025-2030 (%)
Data Table on Italy - Year-over-year growth 2025-2030 (%)

12.4.5 Spain - Market size and forecast 2025-2030

Chart on Spain - Market size and forecast 2025-2030 ($ million)
Data Table on Spain - Market size and forecast 2025-2030 ($ million)
Chart on Spain - Year-over-year growth 2025-2030 (%)
Data Table on Spain - Year-over-year growth 2025-2030 (%)

12.4.6 The Netherlands - Market size and forecast 2025-2030

Chart on The Netherlands - Market size and forecast 2025-2030 ($ million)
Data Table on The Netherlands - Market size and forecast 2025-2030 ($ million)
Chart on The Netherlands - Year-over-year growth 2025-2030 (%)
Data Table on The Netherlands - Year-over-year growth 2025-2030 (%)

12.5 North America - Market size and forecast 2025-2030

Chart on North America - Market size and forecast 2025-2030 ($ million)
Data Table on North America - Market size and forecast 2025-2030 ($ million)
Chart on North America - Year-over-year growth 2025-2030 (%)
Data Table on North America - Year-over-year growth 2025-2030 (%)
Chart on Regional Comparison - North America
Data Table on Regional Comparison - North America

12.5.1 US - Market size and forecast 2025-2030

Chart on US - Market size and forecast 2025-2030 ($ million)
Data Table on US - Market size and forecast 2025-2030 ($ million)
Chart on US - Year-over-year growth 2025-2030 (%)
Data Table on US - Year-over-year growth 2025-2030 (%)

12.5.2 Canada - Market size and forecast 2025-2030

Chart on Canada - Market size and forecast 2025-2030 ($ million)
Data Table on Canada - Market size and forecast 2025-2030 ($ million)
Chart on Canada - Year-over-year growth 2025-2030 (%)
Data Table on Canada - Year-over-year growth 2025-2030 (%)

12.5.3 Mexico - Market size and forecast 2025-2030

Chart on Mexico - Market size and forecast 2025-2030 ($ million)
Data Table on Mexico - Market size and forecast 2025-2030 ($ million)
Chart on Mexico - Year-over-year growth 2025-2030 (%)
Data Table on Mexico - Year-over-year growth 2025-2030 (%)

12.6 South America - Market size and forecast 2025-2030

Chart on South America - Market size and forecast 2025-2030 ($ million)
Data Table on South America - Market size and forecast 2025-2030 ($ million)
Chart on South America - Year-over-year growth 2025-2030 (%)
Data Table on South America - Year-over-year growth 2025-2030 (%)
Chart on Regional Comparison - South America
Data Table on Regional Comparison - South America

12.6.1 Brazil - Market size and forecast 2025-2030

Chart on Brazil - Market size and forecast 2025-2030 ($ million)
Data Table on Brazil - Market size and forecast 2025-2030 ($ million)
Chart on Brazil - Year-over-year growth 2025-2030 (%)
Data Table on Brazil - Year-over-year growth 2025-2030 (%)

12.6.2 Argentina - Market size and forecast 2025-2030

Chart on Argentina - Market size and forecast 2025-2030 ($ million)
Data Table on Argentina - Market size and forecast 2025-2030 ($ million)
Chart on Argentina - Year-over-year growth 2025-2030 (%)
Data Table on Argentina - Year-over-year growth 2025-2030 (%)

12.6.3 Chile - Market size and forecast 2025-2030

Chart on Chile - Market size and forecast 2025-2030 ($ million)
Data Table on Chile - Market size and forecast 2025-2030 ($ million)
Chart on Chile - Year-over-year growth 2025-2030 (%)
Data Table on Chile - Year-over-year growth 2025-2030 (%)

12.7 Middle East and Africa - Market size and forecast 2025-2030

Chart on Middle East and Africa - Market size and forecast 2025-2030 ($ million)
Data Table on Middle East and Africa - Market size and forecast 2025-2030 ($ million)
Chart on Middle East and Africa - Year-over-year growth 2025-2030 (%)
Data Table on Middle East and Africa - Year-over-year growth 2025-2030 (%)
Chart on Regional Comparison - Middle East and Africa
Data Table on Regional Comparison - Middle East and Africa

12.7.1 Saudi Arabia - Market size and forecast 2025-2030

Chart on Saudi Arabia - Market size and forecast 2025-2030 ($ million)
Data Table on Saudi Arabia - Market size and forecast 2025-2030 ($ million)
Chart on Saudi Arabia - Year-over-year growth 2025-2030 (%)
Data Table on Saudi Arabia - Year-over-year growth 2025-2030 (%)

12.7.2 UAE - Market size and forecast 2025-2030

Chart on UAE - Market size and forecast 2025-2030 ($ million)
Data Table on UAE - Market size and forecast 2025-2030 ($ million)
Chart on UAE - Year-over-year growth 2025-2030 (%)
Data Table on UAE - Year-over-year growth 2025-2030 (%)

12.7.3 South Africa - Market size and forecast 2025-2030

Chart on South Africa - Market size and forecast 2025-2030 ($ million)
Data Table on South Africa - Market size and forecast 2025-2030 ($ million)
Chart on South Africa - Year-over-year growth 2025-2030 (%)
Data Table on South Africa - Year-over-year growth 2025-2030 (%)

12.7.4 Israel - Market size and forecast 2025-2030

Chart on Israel - Market size and forecast 2025-2030 ($ million)
Data Table on Israel - Market size and forecast 2025-2030 ($ million)
Chart on Israel - Year-over-year growth 2025-2030 (%)
Data Table on Israel - Year-over-year growth 2025-2030 (%)

12.7.5 Turkey - Market size and forecast 2025-2030

Chart on Turkey - Market size and forecast 2025-2030 ($ million)
Data Table on Turkey - Market size and forecast 2025-2030 ($ million)
Chart on Turkey - Year-over-year growth 2025-2030 (%)
Data Table on Turkey - Year-over-year growth 2025-2030 (%)

12.8 Market opportunity by geography

Market opportunity by geography ($ million)
Data Tables on Market opportunity by geography ($ million)

13. Drivers, Challenges, and Opportunity

13.1 Market drivers

Advanced forged lightweight hollow designs
Expansion of light commercial vehicle fleets
Transition toward integrated module systems

13.2 Market challenges

Powertrain electrification threatens legacy systems
Volatile raw material price pressures
Stringent manufacturing quality compliance

13.3 Impact of drivers and challenges

Impact of drivers and challenges in 2025 and 2030

13.4 Market opportunities

Expansion of polymer gear innovations
Rise of V6 engine subsegments
Advanced digital twin prototyping

14. Competitive Landscape

14.1 Overview

14.2

Overview on criticality of inputs and factors of differentiation

14.3 Landscape disruption

Overview on factors of disruption

14.4 Industry risks

Impact of key risks on business

15. Competitive Analysis

15.1 Companies profiled

Companies covered

15.2 Company ranking index

15.3 Market positioning of companies

Matrix on companies position and classification

15.4 American Axle Manufacturing

American Axle Manufacturing - Overview
American Axle Manufacturing - Business segments
American Axle Manufacturing - Key offerings
American Axle Manufacturing - Segment focus
SWOT

15.5 Bharat Forge Ltd.

Bharat Forge Ltd. - Overview
Bharat Forge Ltd. - Business segments
Bharat Forge Ltd. - Key offerings
Bharat Forge Ltd. - Segment focus
SWOT

15.6 CIE Automotive SA

CIE Automotive SA - Overview
CIE Automotive SA - Product / Service
CIE Automotive SA - Key offerings
SWOT

15.7 Hirschvogel Holding GmbH

Hirschvogel Holding GmbH - Overview
Hirschvogel Holding GmbH - Product / Service
Hirschvogel Holding GmbH - Key offerings
SWOT

15.8 Hitachi Ltd.

Hitachi Ltd. - Overview
Hitachi Ltd. - Business segments
Hitachi Ltd. - Key offerings
Hitachi Ltd. - Segment focus
SWOT

15.9 Linamar Corp.

Linamar Corp. - Overview
Linamar Corp. - Business segments
Linamar Corp. - Key news
Linamar Corp. - Key offerings
Linamar Corp. - Segment focus
SWOT

15.10 MAHLE GmbH

MAHLE GmbH - Overview
MAHLE GmbH - Product / Service
MAHLE GmbH - Key offerings
SWOT

15.11 MAT Foundry Group Ltd.

MAT Foundry Group Ltd. - Overview
MAT Foundry Group Ltd. - Product / Service
MAT Foundry Group Ltd. - Key offerings
SWOT

15.12 Melling

Melling - Overview
Melling - Product / Service
Melling - Key offerings
SWOT

15.13 Musashi Seimitsu Co. Ltd.

Musashi Seimitsu Co. Ltd. - Overview
Musashi Seimitsu Co. Ltd. - Product / Service
Musashi Seimitsu Co. Ltd. - Key offerings
SWOT

15.14 Myunghwa Industry Co. Ltd.

Myunghwa Industry Co. Ltd. - Overview
Myunghwa Industry Co. Ltd. - Product / Service
Myunghwa Industry Co. Ltd. - Key offerings
SWOT

15.15 OTICS Co. Ltd.

OTICS Co. Ltd. - Overview
OTICS Co. Ltd. - Product / Service
OTICS Co. Ltd. - Key offerings
SWOT

15.16 Precision Camshaft Ltd.

Precision Camshaft Ltd. - Overview
Precision Camshaft Ltd. - Product / Service
Precision Camshaft Ltd. - Key offerings
SWOT

15.17 Schaeffler AG

Schaeffler AG - Overview
Schaeffler AG - Business segments
Schaeffler AG - Key news
Schaeffler AG - Key offerings
Schaeffler AG - Segment focus
SWOT

15.18 thyssenkrupp AG

thyssenkrupp AG - Overview
thyssenkrupp AG - Business segments
thyssenkrupp AG - Key offerings
thyssenkrupp AG - Segment focus
SWOT

16. Appendix

16.1 Scope of the report

Market definition
Objectives
Notes and caveats

16.2 Inclusions and exclusions checklist

Inclusions checklist
Exclusions checklist

16.3 Currency conversion rates for US$

16.4 Research methodology

16.5 Data procurement

Information sources

16.6 Data validation

16.7 Validation techniques employed for market sizing

16.8 Data synthesis

16.9 360 degree market analysis

16.10 List of abbreviations

Research Methodology

Technavio presents a detailed picture of the market by way of study, synthesis, and summation of data from multiple sources. The analysts have presented the various facets of the market with a particular focus on identifying the key industry influencers. The data thus presented is comprehensive, reliable, and the result of extensive research, both primary and secondary.

INFORMATION SOURCES

Primary sources

  • Manufacturers and suppliers
  • Channel partners
  • Industry experts
  • Strategic decision makers

Secondary sources

  • Industry journals and periodicals
  • Government data
  • Financial reports of key industry players
  • Historical data
  • Press releases

DATA ANALYSIS

Data Synthesis

  • Collation of data
  • Estimation of key figures
  • Analysis of derived insights

Data Validation

  • Triangulation with data models
  • Reference against proprietary databases
  • Corroboration with industry experts

REPORT WRITING

Qualitative

  • Market drivers
  • Market challenges
  • Market trends
  • Five forces analysis

Quantitative

  • Market size and forecast
  • Market segmentation
  • Geographical insights
  • Competitive landscape

Interested in this report?

Get your sample now to see our research methodology and insights!

Download Now

Frequently Asked Questions

Automotive Balance Shaft market growth will increase by USD 3914.1 million during 2026-2030.

The Automotive Balance Shaft market is expected to grow at a CAGR of 8.2% during 2026-2030.

Automotive Balance Shaft market is segmented by Application (In-line 4-cylinder engine, In-line 3-cylinder engine, Others) Vehicle type (Passenger cars, Light commercial vehicle, Heavy commercial vehicle) Manufacturing type (Forging, Casting)

American Axle Manufacturing, Bharat Forge Ltd., CIE Automotive SA, Engine Power Components Inc., Hirschvogel Holding GmbH, Hitachi Ltd., Jingda Hardware Co. Ltd., Linamar Corp., MAHLE GmbH, MAT Foundry Group Ltd., Melling, Musashi Seimitsu Co. Ltd., Myunghwa Industry Co. Ltd., OTICS Co. Ltd., Precision Camshaft Ltd., SAC Engine Components Pvt. Ltd., Schaeffler AG, thyssenkrupp AG are a few of the key vendors in the Automotive Balance Shaft market.

APAC will register the highest growth rate of 59.2% among the other regions. Therefore, the Automotive Balance Shaft market in APAC is expected to garner significant business opportunities for the vendors during the forecast period.

China, Japan, India, South Korea, Australia, Indonesia, Germany, UK, France, Italy, Spain, The Netherlands, US, Canada, Mexico, Brazil, Argentina, Chile, Saudi Arabia, UAE, South Africa, Israel, Turkey

  • Advanced forged lightweight hollow designs is the driving factor this market.

The Automotive Balance Shaft market vendors should focus on grabbing business opportunities from the Application segment as it accounted for the largest market share in the base year.
RIA - Research AI Assistant
Ask RIA
