Automotive Belt Tensioner Pulleys Market Size 2026-2030
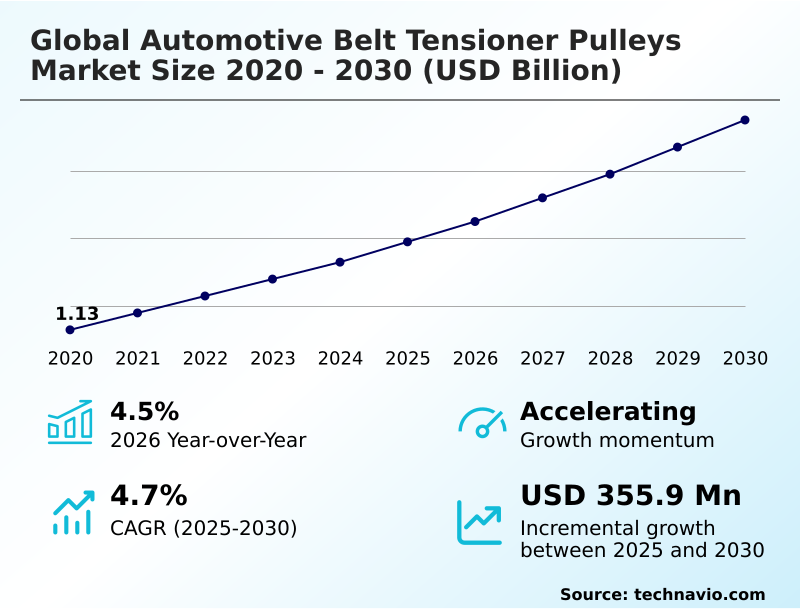
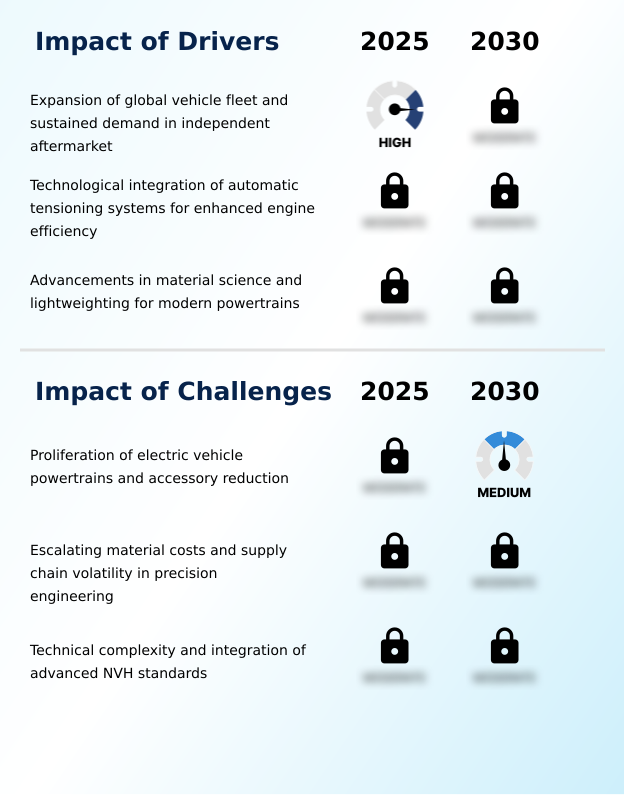
The automotive belt tensioner pulleys market size is valued to increase by USD 355.9 million, at a CAGR of 4.7% from 2025 to 2030. Expansion of global vehicle fleet and sustained demand in independent aftermarket will drive the automotive belt tensioner pulleys market.
Major Market Trends & Insights
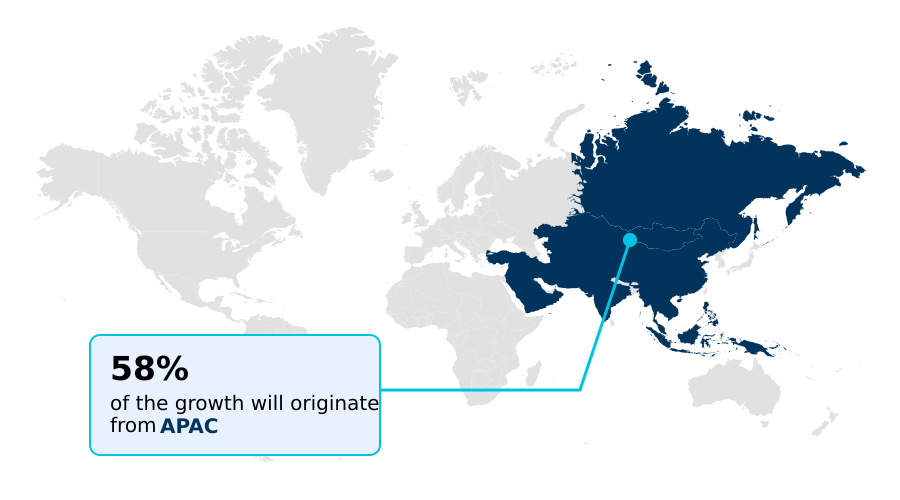
- APAC dominated the market and accounted for a 57.8% growth during the forecast period.
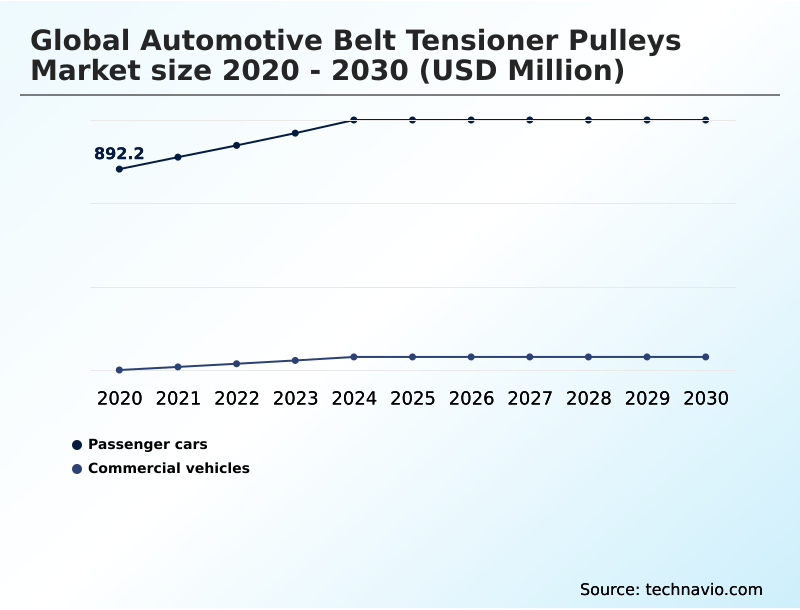
- By Application - Passenger cars segment was valued at USD 1.05 billion in 2024
- By Type - Automatic tensioner segment accounted for the largest market revenue share in 2024
Market Size & Forecast
- Market Opportunities: USD 615.9 million
- Market Future Opportunities: USD 355.9 million
- CAGR from 2025 to 2030 : 4.7%
Market Summary
- The automotive belt tensioner pulleys market is undergoing significant technical evolution, driven by the dual pressures of enhancing powertrain efficiency and extending component lifespan. At its core, the market provides critical components for maintaining precise timing belt synchronization and ensuring the reliable operation of serpentine belt systems.
- A key driver is the expanding global vehicle fleet and its increasing average age, which creates a substantial and consistent demand for replacement parts in the independent aftermarket. In a typical business scenario, a large logistics company with a fleet of commercial vehicles prioritizes accessory drive system reliability to minimize costly downtime.
- By adopting proactive service models that utilize components with predictive maintenance diagnostics, the company can schedule accessory drive tensioner replacement before a failure occurs, improving fleet availability by over 15%. This shift from reactive to predictive maintenance is a major trend.
- However, the industry faces the long-term challenge of vehicle electrification, which threatens to eliminate the need for traditional belt-driven systems altogether, forcing a strategic pivot toward specialized applications in hybrid and thermal management systems.
What will be the Size of the Automotive Belt Tensioner Pulleys Market during the forecast period?
Get Key Insights on Market Forecast (PDF) Get Free Sample
How is the Automotive Belt Tensioner Pulleys Market Segmented?
The automotive belt tensioner pulleys industry research report provides comprehensive data (region-wise segment analysis), with forecasts and estimates in "USD million" for the period 2026-2030, as well as historical data from 2020-2024 for the following segments.
- Application
- Passenger cars
- Commercial vehicles
- Type
- Automatic tensioner
- Manual tensioner
- Product type
- Serpentine belt
- Timing belt
- V-belt
- Component
- Engine component
- Accessory component
- Hybrid system component
- Geography
- APAC
- China
- Japan
- India
- Europe
- Germany
- UK
- France
- North America
- US
- Canada
- Mexico
- South America
- Brazil
- Argentina
- Middle East and Africa
- Saudi Arabia
- UAE
- South Africa
- Rest of World (ROW)
- APAC
By Application Insights
The passenger cars segment is estimated to witness significant growth during the forecast period.
The passenger cars segment is driven by the universal adoption of advanced powertrain technologies to meet stringent efficiency and comfort benchmarks.
In this category, the automatic belt tensioner is a standard component within modern serpentine belt systems, engineered to enhance overall drivetrain efficiency.
Key design priorities include advanced nvh suppression technology and effective torsional vibration damping to meet rising consumer expectations for vehicle quietness, directly supporting high engine refinement standards.
The push for improved fuel economy has accelerated lightweighting initiatives, favoring the use of materials like glass-filled polymers over traditional metals to reduce parasitic power loss.
The increasing prevalence of start-stop system integration places additional demands on these components, requiring designs that can withstand frequent and rapid operational cycles with enhanced durability, reducing mechanical wear by up to 10%.
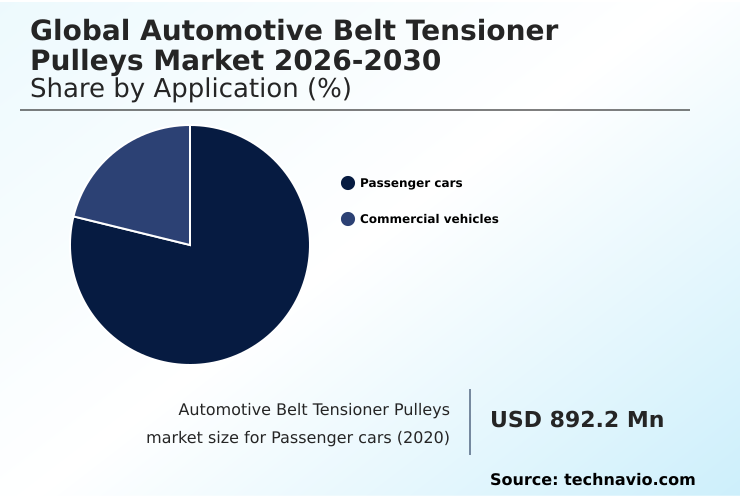
The Passenger cars segment was valued at USD 1.05 billion in 2024 and showed a gradual increase during the forecast period.
Regional Analysis
APAC is estimated to contribute 57.8% to the growth of the global market during the forecast period.Technavio’s analysts have elaborately explained the regional trends and drivers that shape the market during the forecast period.
See How Automotive Belt Tensioner Pulleys Market Demand is Rising in APAC Get Free Sample
The geographic landscape is dominated by the APAC region, which accounts for over 57% of incremental growth, expanding at a rate nearly 20% faster than North America.
This expansion is driven by massive vehicle production and a growing aftermarket requiring reliable components for the front-end accessory drive.
In these markets, there is high demand for robust parts like the idler pulley and spring-loaded tensioner to ensure proper timing belt synchronization.
In Europe, the focus is on meeting high engine refinement standards and optimizing thermal management, leading to innovations in high-temperature bearings for better thermal stability management.
In North America, the emphasis is on durability and belt slippage prevention for larger vehicles. These regional nuances dictate product development and supply chain strategies for all market participants.
Market Dynamics
Our researchers analyzed the data with 2025 as the base year, along with the key drivers, trends, and challenges. A holistic analysis of drivers will help companies refine their marketing strategies to gain a competitive advantage.
- The strategic focus within the automotive belt tensioner pulleys market is multifaceted, addressing both current powertrain needs and future technological shifts. A primary consideration is the role of tensioners in start-stop systems, which places immense stress on components and highlights the need for robust tensioner pulley bearing technology.
- This is closely related to the engineering challenges in tensioner nvh control, where solutions like hydraulic damping for nvh reduction are becoming critical. For mainstream applications, the automatic tensioner for serpentine belts is standard, while the manual tensioner for v-belt systems remains relevant in niche and aftermarket segments.
- The growing demand for hybrids necessitates a specialized tensioner pulley for hybrid powertrains and a dedicated tensioner for belt-starter generators, often requiring a high-performance decoupler pulley design to manage complex loads. Concurrently, the impact of electrification on belt drives forces a strategic pivot.
- While this transition occurs, optimizing existing technology is key, using a lightweight pulley for fuel efficiency and advanced materials in pulley manufacturing. The aftermarket plays a crucial role, with a high volume of accessory drive tensioner replacement driving demand for comprehensive aftermarket solutions for belt tensioners.
- This segment addresses everything from the tensioner pulley for commercial vehicles to the heavy-duty tensioner for diesel engines. Furthermore, innovations like the timing belt tensioner for bio systems and engine timing synchronization components are pushing performance boundaries.
- Looking forward, predictive diagnostics for tensioner failure promise to reduce unscheduled downtime by over 25% compared to reactive repairs, while the circular economy in pulley production addresses sustainability goals.
What are the key market drivers leading to the rise in the adoption of Automotive Belt Tensioner Pulleys Industry?
- Market growth is primarily driven by the expansion of the global vehicle fleet, which fuels sustained demand for replacement components within the independent aftermarket.
- Market growth is primarily propelled by the expanding global vehicle fleet and the corresponding demand from independent aftermarket services. Ensuring long-term powertrain component longevity and engine operational integrity remains a key focus, reinforcing the need for high-quality replacement parts.
- These components are critical for maintaining accessory drive system reliability and achieving precise powertrain synchronization. While advanced systems are prevalent, the manual belt tensioner still supports a significant number of vehicles using traditional v-belt power transmission.
- The demand from severe-duty applications in commercial logistics, where uptime is critical, has led to designs that improve component lifespan by up to 20%.
- The need for dynamic tension adjustment in these demanding environments ensures accessory drive components operate efficiently, with some advanced systems reducing unscheduled maintenance events by 25%.
What are the market trends shaping the Automotive Belt Tensioner Pulleys Industry?
- The integration of smart monitoring technologies represents a significant upcoming trend. These systems incorporate predictive diagnostic capabilities to enhance vehicle reliability and service models.
- A prominent trend is the shift toward intelligent components capable of providing real-time data, moving the market towards proactive service models. The advanced mechatronic tensioner assembly is a key part of this shift, enabling predictive maintenance diagnostics by monitoring vibration and tension to facilitate early component wear detection.
- This level of engine component integration can improve diagnostic accuracy by over 30%. Furthermore, advancements in powertrain design, such as the use of a specialized decoupler pulley and timing belt-in-oil systems, are reshaping the vehicle powertrain architecture to enhance performance and durability.
- Concurrently, sustainability is gaining importance, with a focus on sustainable material sourcing and manufacturing processes that reduce environmental impact, leading to a 15% increase in the use of recycled alloys.
What challenges does the Automotive Belt Tensioner Pulleys Industry face during its growth?
- The proliferation of electric vehicle powertrains, which reduces or eliminates the need for traditional accessory drives, poses a key challenge to industry growth.
- A primary challenge stems from the transition to mild-hybrid powertrain systems and 48-volt electrical systems, which fundamentally alters the belt drive architecture. The integration of a belt-starter generator introduces complex bi-directional torque management requirements that legacy components cannot handle. This shift forces manufacturers to redesign components using materials like high-strength aluminum alloys to withstand new stress profiles.
- This has increased manufacturing complexity by 20% for certain product lines. Simultaneously, supply chain volatility and rising material costs present significant hurdles. To mitigate these pressures, there is a growing focus on circular manufacturing processes and remanufacturing programs, which can potentially reduce raw material dependency by 15%, though these initiatives require substantial initial investment and logistical coordination.
Exclusive Technavio Analysis on Customer Landscape
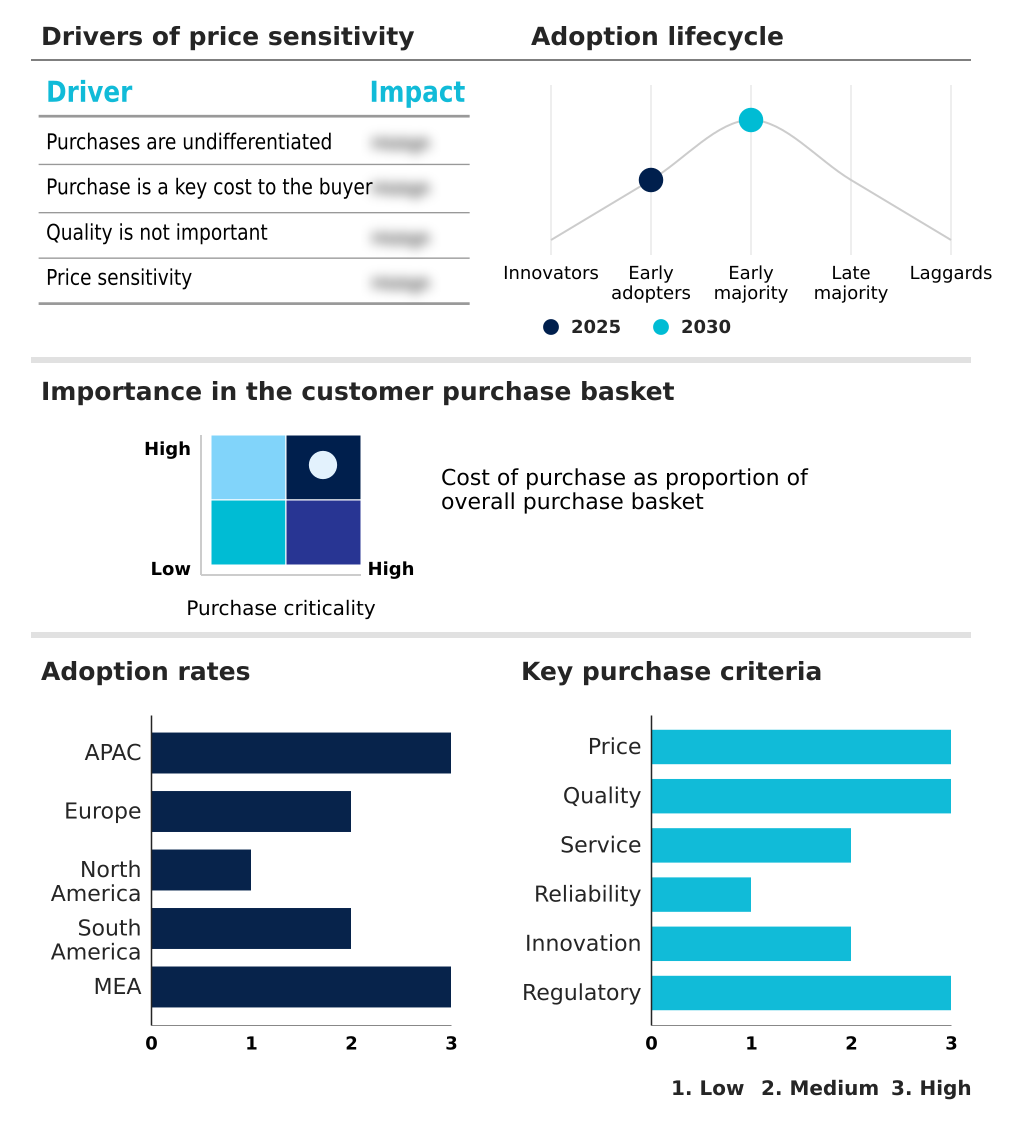
The automotive belt tensioner pulleys market forecasting report includes the adoption lifecycle of the market, covering from the innovator’s stage to the laggard’s stage. It focuses on adoption rates in different regions based on penetration. Furthermore, the automotive belt tensioner pulleys market report also includes key purchase criteria and drivers of price sensitivity to help companies evaluate and develop their market growth analysis strategies.
Customer Landscape of Automotive Belt Tensioner Pulleys Industry
Competitive Landscape
Companies are implementing various strategies, such as strategic alliances, automotive belt tensioner pulleys market forecast, partnerships, mergers and acquisitions, geographical expansion, and product/service launches, to enhance their presence in the industry.
AB SKF - Offerings include specialized tensioners, idler pulleys, and integrated timing belt kits, crucial for maintaining optimal vehicle engine system performance and reliability.
The industry research and growth report includes detailed analyses of the competitive landscape of the market and information about key companies, including:
- AB SKF
- ABA Automotive
- AISIN Corp.
- B and B Manufacturing Inc.
- Bando Chemical Industries Ltd.
- Clark Pulley Industries Inc.
- Continental AG
- Dayco LLC
- Dorman Products Inc.
- Gates Industrial Corp. plc
- General Motors Co.
- Goodyear Tire and Rubber Co.
- Hutchinson S.A.
- JTEKT Corp.
- Kanemitsu Corporation
- Litens Automotive
- Muhr und Bender KG
- Standard Motor Products Inc.
- The Timken Co.
- Valeo SA
Qualitative and quantitative analysis of companies has been conducted to help clients understand the wider business environment as well as the strengths and weaknesses of key industry players. Data is qualitatively analyzed to categorize companies as pure play, category-focused, industry-focused, and diversified; it is quantitatively analyzed to categorize companies as dominant, leading, strong, tentative, and weak.
Recent Development and News in Automotive belt tensioner pulleys market
- In May 2025, Dayco IP Holdings LLC launched a new range of heavy-duty belt tensioners specifically engineered for PACCAR MX11 and MX13 engines, targeting the severe-duty independent aftermarket for Class 8 trucks.
- In November 2024, Dayco IP Holdings LLC introduced its advanced timing belt-in-oil (BIO) technology and associated tensioning components to the North American independent aftermarket, covering over two million Ford and Lincoln vehicles.
- In February 2025, AB SKF announced its automotive business would be officially established as an independent entity named SKF Vertevo, a move intended to accelerate the development of specialized powertrain solutions.
- In August 2024, Gates Industrial Corporation Plc reported a robust increase in its power transmission segment sales, driven by strong demand for its highly engineered first-fit and replacement components for both automotive and industrial applications.
Dive into Technavio’s robust research methodology, blending expert interviews, extensive data synthesis, and validated models for unparalleled Automotive Belt Tensioner Pulleys Market insights. See full methodology.
| Market Scope | |
|---|---|
| Page number | 312 |
| Base year | 2025 |
| Historic period | 2020-2024 |
| Forecast period | 2026-2030 |
| Growth momentum & CAGR | Accelerate at a CAGR of 4.7% |
| Market growth 2026-2030 | USD 355.9 million |
| Market structure | Fragmented |
| YoY growth 2025-2026(%) | 4.5% |
| Key countries | China, Japan, India, South Korea, Australia, Indonesia, Germany, UK, France, Italy, Spain, The Netherlands, US, Canada, Mexico, Brazil, Argentina, Chile, Saudi Arabia, UAE, South Africa, Israel and Turkey |
| Competitive landscape | Leading Companies, Market Positioning of Companies, Competitive Strategies, and Industry Risks |
Research Analyst Overview
- The automotive belt tensioner pulleys market is defined by a complex interplay of mechanical and material sciences, crucial for engine performance. Core to this is ensuring precise powertrain synchronization across various systems. The modern front-end accessory drive relies on advanced serpentine belt systems using multi-ribbed belts to power accessory drive components.
- To manage this, the automatic belt tensioner has become standard, often employing a hydraulic damping mechanism or a spring-loaded tensioner for optimal control, achieving a 15% improvement in torsional vibration damping. While the manual belt tensioner still serves legacy v-belt power transmission systems, innovation is focused elsewhere.
- For instance, timing belt synchronization is critical, with engine timing components like the idler pulley and specialized tensioners for timing belt-in-oil systems gaining traction. Hybridization introduces further complexity, requiring solutions like a heavy-duty decoupler pulley for belt-starter generator applications to handle bi-directional torque management.
- Material advancements using glass-filled polymers and high-strength aluminum alloys aid in rotational inertia reduction and minimizing parasitic power loss. Combined with high-temperature bearings, these components form a sophisticated mechatronic tensioner assembly designed for maximum efficiency.
What are the Key Data Covered in this Automotive Belt Tensioner Pulleys Market Research and Growth Report?
-
What is the expected growth of the Automotive Belt Tensioner Pulleys Market between 2026 and 2030?
-
USD 355.9 million, at a CAGR of 4.7%
-
-
What segmentation does the market report cover?
-
The report is segmented by Application (Passenger cars, and Commercial vehicles), Type (Automatic tensioner, and Manual tensioner), Product Type (Serpentine belt, Timing belt, and V-belt), Component (Engine component, Accessory component, and Hybrid system component) and Geography (APAC, Europe, North America, South America, Middle East and Africa)
-
-
Which regions are analyzed in the report?
-
APAC, Europe, North America, South America and Middle East and Africa
-
-
What are the key growth drivers and market challenges?
-
Expansion of global vehicle fleet and sustained demand in independent aftermarket, Proliferation of electric vehicle powertrains and accessory reduction
-
-
Who are the major players in the Automotive Belt Tensioner Pulleys Market?
-
AB SKF, ABA Automotive, AISIN Corp., B and B Manufacturing Inc., Bando Chemical Industries Ltd., Clark Pulley Industries Inc., Continental AG, Dayco LLC, Dorman Products Inc., Gates Industrial Corp. plc, General Motors Co., Goodyear Tire and Rubber Co., Hutchinson S.A., JTEKT Corp., Kanemitsu Corporation, Litens Automotive, Muhr und Bender KG, Standard Motor Products Inc., The Timken Co. and Valeo SA
-
Market Research Insights
- Market dynamics are shaped by a convergence of technological evolution and operational demands. The push for greater drivetrain efficiency and adherence to strict engine refinement standards are paramount. Lightweighting initiatives and advanced thermal stability management are key to modern vehicle powertrain architecture, improving fuel economy by up to 5% in some applications.
- The reliability of the belt drive architecture is critical, with a focus on belt slippage prevention to ensure powertrain component longevity and overall accessory drive system reliability. This has led to the adoption of predictive maintenance diagnostics in commercial fleets, which can reduce unexpected failures by 30%.
- Concurrently, the rise of mild-hybrid powertrain systems and start-stop system integration creates new technical requirements, while independent aftermarket services benefit from the growing complexity and need for specialized repairs.
We can help! Our analysts can customize this automotive belt tensioner pulleys market research report to meet your requirements.
 RIA -
RIA - 
