Automotive Bicycle Rack Market Analysis North America, Europe, APAC, South America, Middle East and Africa - US, Canada, China, Germany, France - Size and Forecast 2023-2027

Automotive Bicycle Rack Market Analysis North America, Europe, APAC, South America, Middle East and Africa - US, Canada, China, Germany, France - Size and Forecast 2023-2027

Published: Dec 2022 162 Pages SKU: IRTNTR43886

Market Overview at a Glance

$457.24 Mn
Market Opportunity
3.24%
CAGR
2.64
YoY growth 2022-2023(%)

Automotive Bicycle Rack Market Size 2023-2027 

The automotive bicycle rack market size is forecast to increase by USD 457.24 billion at a CAGR of 3.24% between 2022 and 2027.

  • The market is witnessing significant growth due to the rising popularity of urban commuting and adventure tourism. Urban commuters are increasingly opting for eco-friendly transportation options, such as bicycles, to reduce their carbon footprint and save on fuel costs. This trend is driving the demand for bicycle racks that can easily be attached to cars for convenient commuting. Additionally, the adventure tourism industry is experiencing a surge in popularity, with more people exploring mountain trails and participating in cycling events. Camping sites are also becoming popular destinations for outdoor enthusiasts, leading to an increased demand for bicycle racks that can accommodate various types of bicycles, including e-bikes.

    Furthermore, the decreased fuel efficiency of vehicles is pushing consumers to explore alternative modes of transportation for long-distance travel, making bicycle racks a practical solution. The telescoping arm design of bicycle racks is gaining popularity due to its ease of use and versatility. This market trend is expected to continue as more consumers seek convenient and cost-effective transportation solutions for their bicycles.

What will be the Size of the Market During the Forecast Period?

Automotive Bicycle Rack Market Size

 Request Free Sample

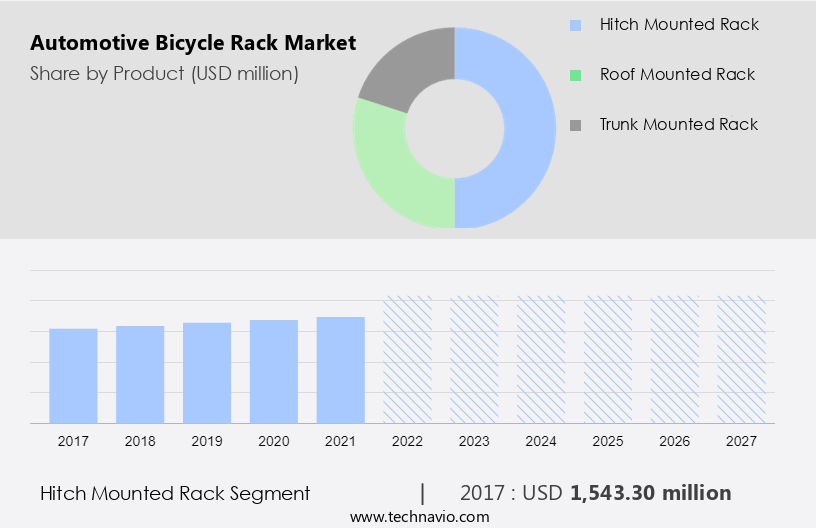
  • The automotive bicycle carrier market is a significant segment within the larger bicycle industry, catering to the transportation needs of outdoor enthusiasts, cyclists, and various sectors including household, commercial use, and public services. This market encompasses three primary types of bicycle carriers: hitch mounted racks, roof mounted racks, and trunk mounted racks. Hitch mounted racks are designed for pickup trucks and SUVs, offering the ability to carry multiple bicycles and providing easy access to roof space for other cargo. These racks are popular among adventure tourism enthusiasts and those with larger vehicles.

    Hitch receiver compatibility and weight capacity are essential considerations for this type of carrier. Roof mounted raks are a popular choice for urban commuters and those with sedans or smaller vehicles. They offer a streamlined profile, utilizing lightweight materials and aerodynamic shapes to minimize wind resistance and reduce fuel consumption. Integrated locking systems ensure the security of the bicycles during transportation. Trunk mounted racks are a more budget-friendly option, designed for compact vehicles with limited roof space. They attach to the trunk or hatchback and can be easily installed and removed. While they offer convenience and flexibility, they may not be as secure or stable as hitch or roof mounted racks.

    The automotive bicycle carrier market is driven by the increasing popularity of cycling as a recreational and commuting activity, as well as the growing demand for versatile transportation solutions for outdoor enthusiasts and commercial applications. Key trends include the development of lighter, more aerodynamic designs, and the integration of advanced locking systems to ensure the safety and security of the bicycles during transportation. In conclusion, the automotive bicycle carrier market continues to evolve, catering to the diverse needs of cyclists, outdoor enthusiasts, and various industries. With a focus on lightweight materials, aerodynamic shapes, and integrated locking systems, these carriers offer a practical and secure solution for transporting bicycles, enabling users to enjoy their cycling adventures while ensuring the safety and protection of their valuable bicycles.

How is this market segmented and which is the largest segment?

The market research report provides comprehensive data (region-wise segment analysis), with forecasts and estimates in "USD million" for the period 2023-2027, as well as historical data from 2017-2021 for the following segments.

  • Product
    • Hitch mounted rack
    • Roof mounted rack
    • Trunk mounted rack
  • Application
    • Household
    • Commercial use
    • Public services
  • Geography
    • North America
      • Canada
      • US
    • Europe
      • Germany
      • France
    • APAC
      • China
    • South America
    • Middle East and Africa

By Product Insights

  • The hitch mounted rack segment is estimated to witness significant growth during the forecast period.

Hitch-mounted bicycle racks remain the preferred choice for consumers looking to transport their premium range bicycles. These racks come in two main types: tray-style and arm-support racks. In tray-style racks, the bicycle wheels are secured while the weight is supported by the tray, making loading effortless. These racks can accommodate up to four bicycles. Alternatively, arm-type racks offer a lower loading height and attach to the bicycle frame, which could potentially cause damage during transportation. Despite this, hitch-mounted racks continue to gain popularity due to several reasons. Their wide range of models, including cost-effective options, makes them accessible to a large consumer base.

Additionally, their ease of installation and detachment when not in use adds to their convenience. Some models even feature foldable designs, allowing for clearance in parking situations. Leading companies in the market include Allen Sports USA, Kuat Innovations, and Tyger Auto Inc. These companies cater to health-conscious consumers who prioritize social distancing and prefer using their own bicycles instead of public transport or gyms. By offering reliable and functional solutions, these companies have established a strong presence in the market.

Automotive Bicycle Rack Market Size

Get a glance at the market report of share of various segments Request Free Sample

The Hitch mounted rack segment was valued at USD 1.54 billion in 2017 and showed a gradual increase during the forecast period.

Regional Analysis

  • North America is estimated to contribute 41% to the growth of the global market during the forecast period.

Technavio's analysts have elaborately explained the regional trends and drivers that shape the market during the forecast period.

Automotive Bicycle Rack Market Share by Geography

For more insights on the market share of various regions Request Free Sample

The North American the market is poised for steady expansion, driven by the increasing number of outdoor enthusiasts and cyclists in the region. Lightweight materials and aerodynamic shapes are key trends in this market, as consumers seek efficient and convenient solutions for transporting their bicycles. Integrated locking systems add an additional layer of security, making hitch-mounted and roof-mounted racks popular choices among consumers. The e-bike market in North America is experiencing significant growth, with sales reaching USD1.3 billion in the US alone in 2022. This expanding e-bike market will fuel the demand for automotive bicycle racks in the region during the forecast period. The US market, in particular, presents a lucrative opportunity due to its large number of car rental companies and the growing popularity of active lifestyles.

Market Dynamics

Our researchers analyzed the data with 2022 as the base year, along with the key drivers, trends, and challenges. A holistic analysis of drivers will help companies refine their marketing strategies to gain a competitive advantage.

What are the key market drivers leading to the rise in adoption of Automotive Bicycle Rack Market ?

Increasing demand for adventure tourism is the key driver of the market.

  • The market for bicycle racks in the automotive industry caters to both household and commercial use, with various types of racks available to suit different vehicle models and consumer needs. Trunk-mounted racks and pickup carriers are popular options for smaller vehicles, while hitch receiver mounts offer more stability for larger pickups and SUVs. Bicycle racks have applications beyond personal use, with public services and commercial entities also utilizing them for the transportation of multiple bikes. In the US, this market is witnessing significant growth due to the increasing popularity of cycling as a recreational activity and the growing trend of active lifestyle choices.
  • Adventure tourism, which includes cycling, is a burgeoning sector in North America and Europe, as more individuals seek unique experiences and opportunities to rejuvenate their mental and physical health. Cycling tourism, in particular, has seen a surge in popularity due to the increasing number of cycling events, such as Ride the Rockies and the Tour de France. These events have inspired individuals to participate in cycling activities and invest in necessary equipment, including bicycle racks for their vehicles. As the demand for cycling tourism continues to grow, the market for automotive bicycle racks is poised for steady expansion.  Incorporate location-specific keywords for the US market to target local audiences. Use a professional tone and maintain a formal writing style to appeal to businesses and individuals in the market for bicycle racks. Such factors will increase the market growth during the forecast period.

What are the market trends shaping the Automotive Bicycle Rack Market?

Increasing demand for bicycle racks from car rental companies is the upcoming trend in the market.

  • The market is experiencing significant growth due to the increasing trend of adventure tourism and the popularity of ridesharing services. Car rental companies are recognizing the value of providing additional services to their customers, which in turn helps them expand their market share and build customer loyalty. One such service is the installation of bicycle racks on rental vehicles.
  • For instance, Europcar Australia, a leading car rental provider, has partnered with Thule to offer bicycle racks on their vehicles. This collaboration allows consumers to explore biking trails in Sydney and other tourist destinations, enhancing their overall travel experience. The market is poised for continued growth as more car rental companies adopt this trend to cater to the needs of adventure-seeking travelers . Such factors will increase the market growth druing the forecast period.

What challenges does Automotive Bicycle Rack Market face during the growth?

Decreased fuel efficiency of vehicles is a key challenge affecting the market growth.

  • For urban commuters and adventure seekers, the use of bicycle racks on automobiles has become increasingly popular. Whether it's for cycling events, mountain trails, camping sites, or e-bikes, transporting bicycles via cars has become a common practice. However, the addition of a bicycle rack and a bicycle to a vehicle can significantly impact fuel efficiency. According to studies, a 100-pound increase in vehicle weight can decrease fuel economy by approximately 1% per mile. Adding a bicycle rack and a bicycle can result in a fuel economy decrease of up to 9%.
  • Furthermore, the aerodynamic drag caused by a roof-mounted bicycle rack can further reduce fuel efficiency. In response, bicycle rack manufacturers are focusing on producing lightweight options to mitigate this issue. This trend is expected to continue as the demand for sustainable transportation solutions grows. Such factors will hinder the market growth during the forecast period.

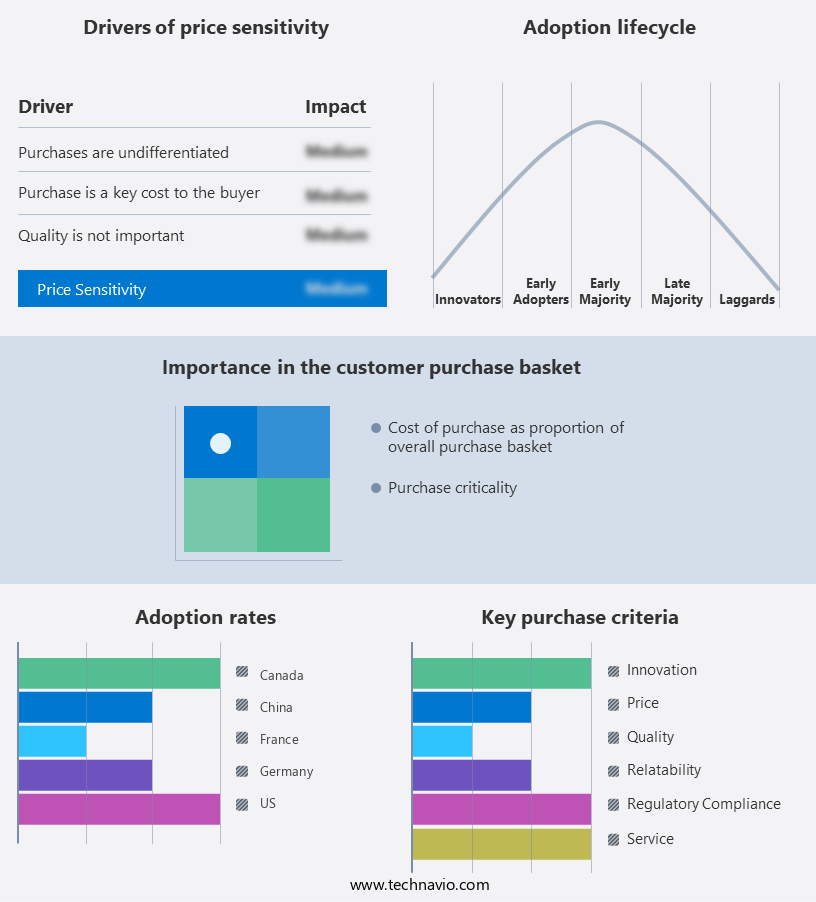
Exclusive Customer Landscape

The market forecasting report includes the adoption lifecycle of the market, covering from the innovator's stage to the laggard's stage. It focuses on adoption rates in different regions based on penetration. Furthermore, the market report also includes key purchase criteria and drivers of price sensitivity to help companies evaluate and develop their market growth analysis strategies.

Automotive Bicycle Rack Market Share by Geography

 Customer Landscape

Key Companies & Market Insights

Companies are implementing various strategies, such as strategic alliances, market forecast , partnerships, mergers and acquisitions, geographical expansion, and product/service launches, to enhance their presence in the market.

The market research and growth report includes detailed analyses of the competitive landscape of the market and information about key companies, including:

  • Allen Sports USA
  • Atera GmbH
  • AURILIS GROUP
  • CURT Manufacturing LLC
  • Fabbri Portatutto Srl
  • Kuat Innovations
  • Maxx Group LLC
  • Mont Blanc Group AB
  • North Shore Racks Inc.
  • Peruzzo srl
  • Pipeline Racks
  • Rhino Rack Pty Ltd.
  • RockyMounts Inc.
  • Saris Equipment LLC
  • SeaSucker LLC
  • Swagman
  • Thule Group AB
  • Tyger Auto Inc.
  • Uebler GmbH
  • Yakima Products Inc.

Qualitative and quantitative analysis of companies has been conducted to help clients understand the wider business environment as well as the strengths and weaknesses of key market players. Data is qualitatively analyzed to categorize companies as pure play, category-focused, industry-focused, and diversified; it is quantitatively analyzed to categorize companies as dominant, leading, strong, tentative, and weak.

Research Analyst Overview

The bicycle rack market in the automotive sector has witnessed significant growth in recent years due to the increasing popularity of bicycles among consumers. With the rise of health consciousness and social distancing measures, more people are turning to bicycles as an alternative to gyms and public transport. Adventure tourists and outdoor enthusiasts, in particular, are driving demand for premium range bicycles and specialized bicycle carriers. Bicycle racks come in various types, including hitch mounted, roof mounted, and trunk mounted racks, catering to different vehicle types and consumer needs. Hitch mounted racks provide greater stability and can carry multiple bicycles, making them popular among commercial users and public services.

Moreover, the roof mounted racks offer more flexibility in terms of vehicle types and can accommodate a wider range of bicycles, including adventure bicycles and electric bicycles. Trunk mounted racks are a cost-effective option for urban commuters and households. The market is also witnessing the emergence of electric cycles, which offer an eco-friendly alternative to conventional vehicles and contribute to reducing greenhouse gases. Fuel prices and pollution concerns are further driving the adoption of electric vehicles and electric cycles, which can be easily mounted on roof or trunk racks. Consumers are increasingly looking for lightweight materials, aerodynamic shapes, integrated locking systems, and easy installation features in bicycle racks.

Similarly, adventure tourists and cyclists are particularly interested in telescoping arms, headtube and seatpost adapters, and other features that ensure a secure and convenient mounting experience. The market is expected to continue growing, driven by the expanding adventure tourism industry and the increasing popularity of cycling events and camping sites. Such factors will increase the market growth during the forecast period.

Market Scope

Report Coverage

Details

Page number

162

Base year

2022

Historic period

2017-2021

Forecast period

2023-2027

Growth momentum & CAGR

Accelerate at a CAGR of 3.24%

Market growth 2023-2027

USD 457.24 million

Market structure

Fragmented

YoY growth 2022-2023(%)

2.64

Key countries

US, Canada, China, Germany, and France

Competitive landscape

Leading Companies, Market Positioning of Companies, Competitive Strategies, and Industry Risks

Request Free Sample

What are the Key Data Covered in this Market Research and Growth Report?

  • CAGR of the market during the forecast period
  • Detailed information on factors that will drive the market growth and forecasting between 2023 and 2027
  • Precise estimation of the size of the market  and its contribution of the market in focus to the parent market
  • Accurate predictions about upcoming market growth and trends and changes in consumer behaviour
  • Growth of the market across North America, Europe, APAC, South America, and Middle East and Africa
  • Thorough analysis of the market's competitive landscape and detailed information about companies
  • Comprehensive analysis of factors that will challenge the growth of market companies

We can help! Our analysts can customize this market research report to meet your requirements. Get in touch

1 Executive Summary

  • 1.1 Market overview
    • Exhibit 01: Executive Summary – Chart on Market Overview
    • Exhibit 02: Executive Summary – Data Table on Market Overview
    • Exhibit 03: Executive Summary – Chart on Global Market Characteristics
    • Exhibit 04: Executive Summary – Chart on Market by Geography
    • Exhibit 05: Executive Summary – Chart on Market Segmentation by Product
    • Exhibit 06: Executive Summary – Chart on Market Segmentation by Application
    • Exhibit 07: Executive Summary – Chart on Incremental Growth
    • Exhibit 08: Executive Summary – Data Table on Incremental Growth
    • Exhibit 09: Executive Summary – Chart on Vendor Market Positioning

2 Market Landscape

  • 2.1 Market ecosystem
    • Exhibit 10: Parent market
    • Exhibit 11: Market Characteristics

3 Market Sizing

  • 3.1 Market definition
    • Exhibit 12: Offerings of vendors included in the market definition
  • 3.2 Market segment analysis
    • Exhibit 13: Market segments
  • 3.3 Market size 2022
    • 3.4 Market outlook: Forecast for 2022-2027
      • Exhibit 14: Chart on Global - Market size and forecast 2022-2027 ($ million)
      • Exhibit 15: Data Table on Global - Market size and forecast 2022-2027 ($ million)
      • Exhibit 16: Chart on Global Market: Year-over-year growth 2022-2027 (%)
      • Exhibit 17: Data Table on Global Market: Year-over-year growth 2022-2027 (%)

    4 Historic Market Size

    • 4.1 Global automotive bicycle rack market 2017 - 2021
      • Exhibit 18: Historic Market Size – Data Table on Global automotive bicycle rack market 2017 - 2021 ($ million)
    • 4.2 Product Segment Analysis 2017 - 2021
      • Exhibit 19: Historic Market Size – Product Segment 2017 - 2021 ($ million)
    • 4.3 Application Segment Analysis 2017 - 2021
      • Exhibit 20: Historic Market Size – Application Segment 2017 - 2021 ($ million)
    • 4.4 Geography Segment Analysis 2017 - 2021
      • Exhibit 21: Historic Market Size – Geography Segment 2017 - 2021 ($ million)
    • 4.5 Country Segment Analysis 2017 - 2021
      • Exhibit 22: Historic Market Size – Country Segment 2017 - 2021 ($ million)

    5 Five Forces Analysis

    • 5.1 Five forces summary
      • Exhibit 23: Five forces analysis - Comparison between 2022 and 2027
    • 5.2 Bargaining power of buyers
      • Exhibit 24: Chart on Bargaining power of buyers – Impact of key factors 2022 and 2027
    • 5.3 Bargaining power of suppliers
      • Exhibit 25: Bargaining power of suppliers – Impact of key factors in 2022 and 2027
    • 5.4 Threat of new entrants
      • Exhibit 26: Threat of new entrants – Impact of key factors in 2022 and 2027
    • 5.5 Threat of substitutes
      • Exhibit 27: Threat of substitutes – Impact of key factors in 2022 and 2027
    • 5.6 Threat of rivalry
      • Exhibit 28: Threat of rivalry – Impact of key factors in 2022 and 2027
    • 5.7 Market condition
      • Exhibit 29: Chart on Market condition - Five forces 2022 and 2027

    6 Market Segmentation by Product

    • 6.1 Market segments
      • Exhibit 30: Chart on Product - Market share 2022-2027 (%)
      • Exhibit 31: Data Table on Product - Market share 2022-2027 (%)
    • 6.2 Comparison by Product
      • Exhibit 32: Chart on Comparison by Product
      • Exhibit 33: Data Table on Comparison by Product
    • 6.3 Hitch mounted rack - Market size and forecast 2022-2027
      • Exhibit 34: Chart on Hitch mounted rack - Market size and forecast 2022-2027 ($ million)
      • Exhibit 35: Data Table on Hitch mounted rack - Market size and forecast 2022-2027 ($ million)
      • Exhibit 36: Chart on Hitch mounted rack - Year-over-year growth 2022-2027 (%)
      • Exhibit 37: Data Table on Hitch mounted rack - Year-over-year growth 2022-2027 (%)
    • 6.4 Roof mounted rack - Market size and forecast 2022-2027
      • Exhibit 38: Chart on Roof mounted rack - Market size and forecast 2022-2027 ($ million)
      • Exhibit 39: Data Table on Roof mounted rack - Market size and forecast 2022-2027 ($ million)
      • Exhibit 40: Chart on Roof mounted rack - Year-over-year growth 2022-2027 (%)
      • Exhibit 41: Data Table on Roof mounted rack - Year-over-year growth 2022-2027 (%)
    • 6.5 Trunk mounted rack - Market size and forecast 2022-2027
      • Exhibit 42: Chart on Trunk mounted rack - Market size and forecast 2022-2027 ($ million)
      • Exhibit 43: Data Table on Trunk mounted rack - Market size and forecast 2022-2027 ($ million)
      • Exhibit 44: Chart on Trunk mounted rack - Year-over-year growth 2022-2027 (%)
      • Exhibit 45: Data Table on Trunk mounted rack - Year-over-year growth 2022-2027 (%)
    • 6.6 Market opportunity by Product
      • Exhibit 46: Market opportunity by Product ($ million)

    7 Market Segmentation by Application

    • 7.1 Market segments
      • Exhibit 47: Chart on Application - Market share 2022-2027 (%)
      • Exhibit 48: Data Table on Application - Market share 2022-2027 (%)
    • 7.2 Comparison by Application
      • Exhibit 49: Chart on Comparison by Application
      • Exhibit 50: Data Table on Comparison by Application
    • 7.3 Household - Market size and forecast 2022-2027
      • Exhibit 51: Chart on Household - Market size and forecast 2022-2027 ($ million)
      • Exhibit 52: Data Table on Household - Market size and forecast 2022-2027 ($ million)
      • Exhibit 53: Chart on Household - Year-over-year growth 2022-2027 (%)
      • Exhibit 54: Data Table on Household - Year-over-year growth 2022-2027 (%)
    • 7.4 Commercial use - Market size and forecast 2022-2027
      • Exhibit 55: Chart on Commercial use - Market size and forecast 2022-2027 ($ million)
      • Exhibit 56: Data Table on Commercial use - Market size and forecast 2022-2027 ($ million)
      • Exhibit 57: Chart on Commercial use - Year-over-year growth 2022-2027 (%)
      • Exhibit 58: Data Table on Commercial use - Year-over-year growth 2022-2027 (%)
    • 7.5 Public services - Market size and forecast 2022-2027
      • Exhibit 59: Chart on Public services - Market size and forecast 2022-2027 ($ million)
      • Exhibit 60: Data Table on Public services - Market size and forecast 2022-2027 ($ million)
      • Exhibit 61: Chart on Public services - Year-over-year growth 2022-2027 (%)
      • Exhibit 62: Data Table on Public services - Year-over-year growth 2022-2027 (%)
    • 7.6 Market opportunity by Application
      • Exhibit 63: Market opportunity by Application ($ million)

    8 Customer Landscape

    • 8.1 Customer landscape overview
      • Exhibit 64: Analysis of price sensitivity, lifecycle, customer purchase basket, adoption rates, and purchase criteria

    9 Geographic Landscape

    • 9.1 Geographic segmentation
      • Exhibit 65: Chart on Market share by geography 2022-2027 (%)
      • Exhibit 66: Data Table on Market share by geography 2022-2027 (%)
    • 9.2 Geographic comparison
      • Exhibit 67: Chart on Geographic comparison
      • Exhibit 68: Data Table on Geographic comparison
    • 9.3 North America - Market size and forecast 2022-2027
      • Exhibit 69: Chart on North America - Market size and forecast 2022-2027 ($ million)
      • Exhibit 70: Data Table on North America - Market size and forecast 2022-2027 ($ million)
      • Exhibit 71: Chart on North America - Year-over-year growth 2022-2027 (%)
      • Exhibit 72: Data Table on North America - Year-over-year growth 2022-2027 (%)
    • 9.4 Europe - Market size and forecast 2022-2027
      • Exhibit 73: Chart on Europe - Market size and forecast 2022-2027 ($ million)
      • Exhibit 74: Data Table on Europe - Market size and forecast 2022-2027 ($ million)
      • Exhibit 75: Chart on Europe - Year-over-year growth 2022-2027 (%)
      • Exhibit 76: Data Table on Europe - Year-over-year growth 2022-2027 (%)
    • 9.5 APAC - Market size and forecast 2022-2027
      • Exhibit 77: Chart on APAC - Market size and forecast 2022-2027 ($ million)
      • Exhibit 78: Data Table on APAC - Market size and forecast 2022-2027 ($ million)
      • Exhibit 79: Chart on APAC - Year-over-year growth 2022-2027 (%)
      • Exhibit 80: Data Table on APAC - Year-over-year growth 2022-2027 (%)
    • 9.6 South America - Market size and forecast 2022-2027
      • Exhibit 81: Chart on South America - Market size and forecast 2022-2027 ($ million)
      • Exhibit 82: Data Table on South America - Market size and forecast 2022-2027 ($ million)
      • Exhibit 83: Chart on South America - Year-over-year growth 2022-2027 (%)
      • Exhibit 84: Data Table on South America - Year-over-year growth 2022-2027 (%)
    • 9.7 Middle East and Africa - Market size and forecast 2022-2027
      • Exhibit 85: Chart on Middle East and Africa - Market size and forecast 2022-2027 ($ million)
      • Exhibit 86: Data Table on Middle East and Africa - Market size and forecast 2022-2027 ($ million)
      • Exhibit 87: Chart on Middle East and Africa - Year-over-year growth 2022-2027 (%)
      • Exhibit 88: Data Table on Middle East and Africa - Year-over-year growth 2022-2027 (%)
    • 9.8 US - Market size and forecast 2022-2027
      • Exhibit 89: Chart on US - Market size and forecast 2022-2027 ($ million)
      • Exhibit 90: Data Table on US - Market size and forecast 2022-2027 ($ million)
      • Exhibit 91: Chart on US - Year-over-year growth 2022-2027 (%)
      • Exhibit 92: Data Table on US - Year-over-year growth 2022-2027 (%)
    • 9.9 Germany - Market size and forecast 2022-2027
      • Exhibit 93: Chart on Germany - Market size and forecast 2022-2027 ($ million)
      • Exhibit 94: Data Table on Germany - Market size and forecast 2022-2027 ($ million)
      • Exhibit 95: Chart on Germany - Year-over-year growth 2022-2027 (%)
      • Exhibit 96: Data Table on Germany - Year-over-year growth 2022-2027 (%)
    • 9.10 China - Market size and forecast 2022-2027
      • Exhibit 97: Chart on China - Market size and forecast 2022-2027 ($ million)
      • Exhibit 98: Data Table on China - Market size and forecast 2022-2027 ($ million)
      • Exhibit 99: Chart on China - Year-over-year growth 2022-2027 (%)
      • Exhibit 100: Data Table on China - Year-over-year growth 2022-2027 (%)
    • 9.11 France - Market size and forecast 2022-2027
      • Exhibit 101: Chart on France - Market size and forecast 2022-2027 ($ million)
      • Exhibit 102: Data Table on France - Market size and forecast 2022-2027 ($ million)
      • Exhibit 103: Chart on France - Year-over-year growth 2022-2027 (%)
      • Exhibit 104: Data Table on France - Year-over-year growth 2022-2027 (%)
    • 9.12 Canada - Market size and forecast 2022-2027
      • Exhibit 105: Chart on Canada - Market size and forecast 2022-2027 ($ million)
      • Exhibit 106: Data Table on Canada - Market size and forecast 2022-2027 ($ million)
      • Exhibit 107: Chart on Canada - Year-over-year growth 2022-2027 (%)
      • Exhibit 108: Data Table on Canada - Year-over-year growth 2022-2027 (%)
    • 9.13 Market opportunity by geography
      • Exhibit 109: Market opportunity by geography ($ million)

    10 Drivers, Challenges, and Trends

    • 10.1 Market drivers
      • 10.2 Market challenges
        • 10.3 Impact of drivers and challenges
          • Exhibit 110: Impact of drivers and challenges in 2022 and 2027
        • 10.4 Market trends

          11 Vendor Landscape

          • 11.1 Overview
            • 11.2 Vendor landscape
              • Exhibit 111: Overview on Criticality of inputs and Factors of differentiation
            • 11.3 Landscape disruption
              • Exhibit 112: Overview on factors of disruption
            • 11.4 Industry risks
              • Exhibit 113: Impact of key risks on business

            12 Vendor Analysis

            • 12.1 Vendors covered
              • Exhibit 114: Vendors covered
            • 12.2 Market positioning of vendors
              • Exhibit 115: Matrix on vendor position and classification
            • 12.3 Allen Sports USA
              • Exhibit 116: Allen Sports USA - Overview
              • Exhibit 117: Allen Sports USA - Product / Service
              • Exhibit 118: Allen Sports USA - Key offerings
            • 12.4 Atera GmbH
              • Exhibit 119: Atera GmbH - Overview
              • Exhibit 120: Atera GmbH - Product / Service
              • Exhibit 121: Atera GmbH - Key offerings
            • 12.5 AURILIS GROUP
              • Exhibit 122: AURILIS GROUP - Overview
              • Exhibit 123: AURILIS GROUP - Product / Service
              • Exhibit 124: AURILIS GROUP - Key offerings
            • 12.6 CURT Manufacturing LLC
              • Exhibit 125: CURT Manufacturing LLC - Overview
              • Exhibit 126: CURT Manufacturing LLC - Product / Service
              • Exhibit 127: CURT Manufacturing LLC - Key offerings
            • 12.7 Fabbri Portatutto Srl
              • Exhibit 128: Fabbri Portatutto Srl - Overview
              • Exhibit 129: Fabbri Portatutto Srl - Product / Service
              • Exhibit 130: Fabbri Portatutto Srl - Key offerings
            • 12.8 Kuat Innovations
              • Exhibit 131: Kuat Innovations - Overview
              • Exhibit 132: Kuat Innovations - Product / Service
              • Exhibit 133: Kuat Innovations - Key offerings
            • 12.9 Mont Blanc Group AB
              • Exhibit 134: Mont Blanc Group AB - Overview
              • Exhibit 135: Mont Blanc Group AB - Product / Service
              • Exhibit 136: Mont Blanc Group AB - Key offerings
            • 12.10 Peruzzo srl
              • Exhibit 137: Peruzzo srl - Overview
              • Exhibit 138: Peruzzo srl - Product / Service
              • Exhibit 139: Peruzzo srl - Key offerings
            • 12.11 Pipeline Racks
              • Exhibit 140: Pipeline Racks - Overview
              • Exhibit 141: Pipeline Racks - Product / Service
              • Exhibit 142: Pipeline Racks - Key offerings
            • 12.12 Rhino Rack Pty Ltd.
              • Exhibit 143: Rhino Rack Pty Ltd. - Overview
              • Exhibit 144: Rhino Rack Pty Ltd. - Product / Service
              • Exhibit 145: Rhino Rack Pty Ltd. - Key offerings
            • 12.13 Swagman
              • Exhibit 146: Swagman - Overview
              • Exhibit 147: Swagman - Product / Service
              • Exhibit 148: Swagman - Key offerings
            • 12.14 Thule Group AB
              • Exhibit 149: Thule Group AB - Overview
              • Exhibit 150: Thule Group AB - Business segments
              • Exhibit 151: Thule Group AB - Key offerings
              • Exhibit 152: Thule Group AB - Segment focus
            • 12.15 Tyger Auto Inc.
              • Exhibit 153: Tyger Auto Inc. - Overview
              • Exhibit 154: Tyger Auto Inc. - Product / Service
              • Exhibit 155: Tyger Auto Inc. - Key offerings
            • 12.16 Uebler GmbH
              • Exhibit 156: Uebler GmbH - Overview
              • Exhibit 157: Uebler GmbH - Product / Service
              • Exhibit 158: Uebler GmbH - Key offerings
            • 12.17 Yakima Products Inc.
              • Exhibit 159: Yakima Products Inc. - Overview
              • Exhibit 160: Yakima Products Inc. - Product / Service
              • Exhibit 161: Yakima Products Inc. - Key offerings

            13 Appendix

            • 13.1 Scope of the report
              • 13.2 Inclusions and exclusions checklist
                • Exhibit 162: Inclusions checklist
                • Exhibit 163: Exclusions checklist
              • 13.3 Currency conversion rates for US$
                • Exhibit 164: Currency conversion rates for US$
              • 13.4 Research methodology
                • Exhibit 165: Research methodology
                • Exhibit 166: Validation techniques employed for market sizing
                • Exhibit 167: Information sources
              • 13.5 List of abbreviations
                • Exhibit 168: List of abbreviations

              Research Methodology

              Technavio presents a detailed picture of the market by way of study, synthesis, and summation of data from multiple sources. The analysts have presented the various facets of the market with a particular focus on identifying the key industry influencers. The data thus presented is comprehensive, reliable, and the result of extensive research, both primary and secondary.

              INFORMATION SOURCES

              Primary sources

              • Manufacturers and suppliers
              • Channel partners
              • Industry experts
              • Strategic decision makers

              Secondary sources

              • Industry journals and periodicals
              • Government data
              • Financial reports of key industry players
              • Historical data
              • Press releases

              DATA ANALYSIS

              Data Synthesis

              • Collation of data
              • Estimation of key figures
              • Analysis of derived insights

              Data Validation

              • Triangulation with data models
              • Reference against proprietary databases
              • Corroboration with industry experts

              REPORT WRITING

              Qualitative

              • Market drivers
              • Market challenges
              • Market trends
              • Five forces analysis

              Quantitative

              • Market size and forecast
              • Market segmentation
              • Geographical insights
              • Competitive landscape

              Interested in this report?

              Get your sample now to see our research methodology and insights!

              Download Now

              Frequently Asked Questions

              Automotive Bicycle Rack market growth will increase by $ 457.24 mn during 2023-2027.

              The Automotive Bicycle Rack market is expected to grow at a CAGR of 3.24% during 2023-2027.

              Automotive Bicycle Rack market is segmented by Product( Hitch mounted rack, Roof mounted rack, Trunk mounted rack) Application( Household, Commercial use, Public services, South America, MEA)

              Allen Sports USA, Atera GmbH, AURILIS GROUP, CURT Manufacturing LLC, Fabbri Portatutto Srl, Kuat Innovations, Maxx Group LLC, Mont Blanc Group AB, North Shore Racks Inc., Peruzzo srl, Pipeline Racks, Rhino Rack Pty Ltd., RockyMounts Inc., Saris Equipment LLC, SeaSucker LLC, Swagman, Thule Group AB, Tyger Auto Inc., Uebler GmbH, Yakima Products Inc. are a few of the key vendors in the Automotive Bicycle Rack market.

              North America will register the highest growth rate of 41% among the other regions. Therefore, the Automotive Bicycle Rack market in North America is expected to garner significant business opportunities for the vendors during the forecast period.

              US, Canada, China, Germany, France

              • Increasing demand for adventure tourismAdventure tourism involves exploration or travel to remote locations is the driving factor this market.
              • which is growing rapidly among tourism enthusiasts. Adventure tourism involves mountaineering expeditions is the driving factor this market.
              • mountain cycling is the driving factor this market.
              • trekking is the driving factor this market.
              • bungee jumping is the driving factor this market.
              • rafting is the driving factor this market.
              • and rock climbing. These activities help rejuvenate mental health and stamina. These activities are gaining high popularity among the population in North America and Europe. The high demand for adventure tourism is attributed to the changes in lifestyle is the driving factor this market.
              • demographics is the driving factor this market.
              • and increasing preference for experiential traveling. Cycling tourism has been a highly popular sport for decades and is one of the most preferred types of adventure tourism. Increased participation in events such as Ride the Rockies and Tour de France has increased the demand for cycling tourism among individuals. According to the European Cyclists Federation is the driving factor this market.
              • cycling brings in an average of over $44.71 billion annually to the continent is the driving factor this market.
              • resulting from 2.3 billion cycling trips. During the forecast period is the driving factor this market.
              • such activities are likely to grow in other continents and many parts of the US. Cycling infrastructure provides an attraction point for tourists and helps diversify transportation options for locals in many traffic-clogged cities. Due to all these factors is the driving factor this market.
              • governments in many countries are continuously investing in the development of cycling infrastructure. The increasing demand for this kind of adventure tourism will fuel the adoption of automotive bicycle racks. With the help of these racks is the driving factor this market.
              • consumers safely carry bicycles to such adventure tourism destinations. is the driving factor this market.

              The Automotive Bicycle Rack market vendors should focus on grabbing business opportunities from the Hitch mounted rack segment as it accounted for the largest market share in the base year.