Automotive Brake Fluid Market Analysis APAC, Europe, North America, South America, Middle East and Africa - US, China, Japan, India, Germany - Size and Forecast 2024-2028

Automotive Brake Fluid Market Analysis APAC, Europe, North America, South America, Middle East and Africa - US, China, Japan, India, Germany - Size and Forecast 2024-2028

Published: Apr 2024 171 Pages SKU: IRTNTR77883

Market Overview at a Glance

$317.14 Mn
Market Opportunity
2.95%
CAGR
2.31
YoY growth 2023-2024(%)

Automotive Brake Fluid Market Size 2024-2028

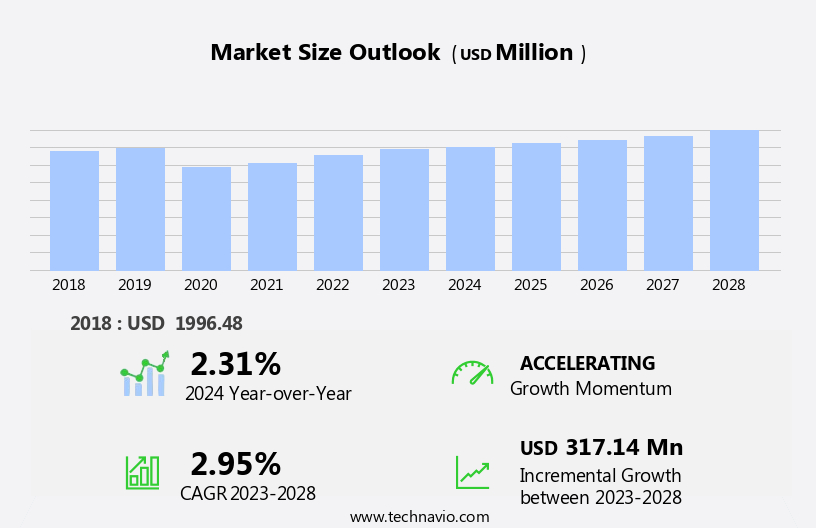
The automotive brake fluid market size is forecast to increase by USD 317.14 million at a CAGR of 2.95% between 2023 and 2028.

  • The market is witnessing significant growth due to the increasing number of vehicles in use and the growing popularity of electric vehicles (EVs). With the rise of EVs, there is an increasing demand for hydraulic fluids, including automotive brake fluids, to ensure the proper functioning of hydraulic cylinders in EVs and conventional vehicles. However, the market is also facing challenges such as volatility in raw material prices, particularly for crude oil and ethylene, which are used In the production of glycol ethers and ethylene glycol, key components of automotive brake fluids. Additionally, the safety concerns associated with the use of non-compatible brake fluids in electric vehicles and buses can pose a significant risk to road safety. Rubber components in hydraulic systems can also degrade when exposed to incompatible fluids, leading to costly repairs. Therefore, it is crucial for automotive manufacturers and suppliers to use high-quality, compatible brake fluids to ensure the safety and reliability of their vehicles.

What will be the Size of the Automotive Brake Fluid Market During the Forecast Period?

Automotive Brake Fluid Market Size

 Request Free Sample

  • The market encompasses the production and distribution of hydraulic fluids specifically designed for use in automotive applications, including hydraulic braking systems and clutches. These fluids, also known as brake fluid oil or polyethylene glycols, play a crucial role In the lubrication and corrosion prevention of mechanical elements such as the main hydraulic cylinder, wheel cylinder, brake caliper, brake pads, rotors, and brake liners. The market's growth is driven by the increasing demand for reliable and efficient braking systems in both traditional passenger cars and the emerging electric vehicle sector. As hydraulic brakes remain a critical component of vehicles, the market's size is substantial and continues to expand.
  • Additionally, the development of high-performance fluids with extended boiling points caters to the needs of high-performance vehicles and heavy-duty applications. The automotive sector's ongoing advancements contribute to the market's dynamic nature.

How is this Automotive Brake Fluid Industry segmented and which is the largest segment?

The automotive brake fluid industry research report provides comprehensive data (region-wise segment analysis), with forecasts and estimates in "USD million" for the period 2024-2028, as well as historical data from 2018-2022 for the following segments.

  • Channel
    • OEM
    • Aftermarket
  • Application
    • Passenger cars
    • Commercial vehicles
  • Geography
    • APAC
      • China
      • India
      • Japan
    • Europe
      • Germany
    • North America
      • US
    • South America
    • Middle East and Africa

By Channel Insights

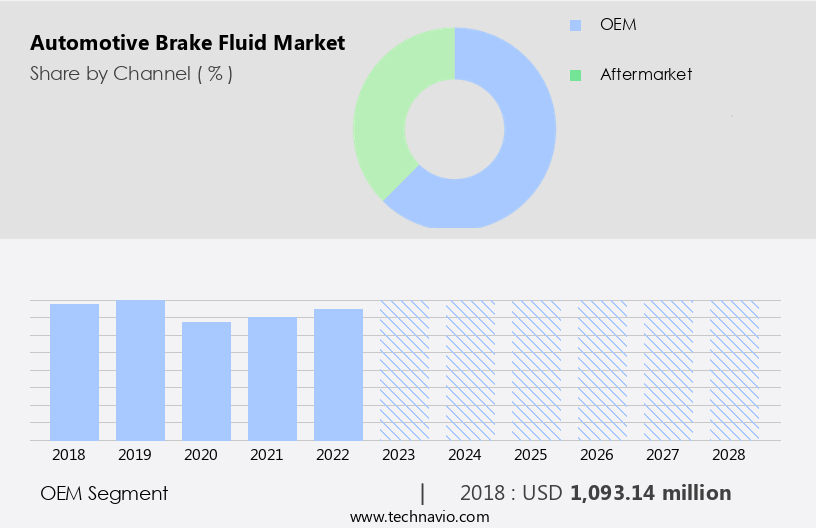
The OEM segment is estimated to witness significant growth during the forecast period. The market has experienced significant growth in recent years, driven primarily by the increasing production of passenger and commercial vehicles. Automotive original equipment manufacturers (OEMs) are the primary consumers of automotive brake fluids due to their role in both initial installation during vehicle production and ongoing maintenance and repair services. The focus on quality in brake fluid selection by OEMs is a key market trend, as they seek reliable and effective solutions to ensure vehicle safety standards are met. Automotive applications for brake fluids include hydraulic braking systems, hydraulic brakes, clutches, and various mechanical elements such as pistons, cylinders, and brake calipers.

Automotive Brake Fluid Market Size

Get a glance at the market report of share of various segments Request Free Sample

The OEM segment was valued at USD 1.09 billion in 2018 and showed a gradual increase during the forecast period.

Regional Analysis

APAC is estimated to contribute 49% to the growth of the global market during the forecast period. Technavio's analysts have elaborately explained the regional trends and drivers that shape the market during the forecast period.

Automotive Brake Fluid Market Share by Geography

For more insights on the market size of various regions, Request Free Sample

The market In the Asia Pacific region is experiencing significant growth due to increasing sales of passenger vehicles and the adoption of synthetic brake fluids in automobiles. Developing economies, such as India and China, are major contributors to this growth, alongside established markets like Japan and South Korea. The demand for automotive braking fluids is driven by the high volume sales of passenger vehicles. Furthermore, consumer awareness regarding the benefits of using synthetic brake fluids in automobiles is fueling market revenue generation. Government initiatives, such as the Indian government's plan to deploy 10,000 electric buses, are also supporting the adoption of electric vehicles (EVs) and the associated demand for brake fluids.

Market Dynamics

Our researchers analyzed the data with 2023 as the base year, along with the key drivers, trends, and challenges. A holistic analysis of drivers will help companies refine their marketing strategies to gain a competitive advantage.

What are the key market drivers leading to the rise In the adoption of Automotive Brake Fluid Industry?

  • Growing number of vehicles in use is the key driver of the market. The market is experiencing growth due to the rising number of vehicles in use worldwide. For instance, In the European Union, the number of registered passenger cars reached nearly 253 million in 2022, marking a 7% increase over 2017. Similarly, In the US, sales of new lightweight vehicles grew from 8,568 units in 2017 to 9,069 units in 2022, according to the US Department of Transportation (DOT). This increasing vehicle population necessitates the regular use of hydraulic fluids, such as brake fluid oil, in various automotive applications. Automotive brake fluids are essential components of hydraulic braking systems, which include hydraulic brakes, clutches, pistons, cylinders, brake liners, mechanical elements, and rubber components.
  • These fluids prevent corrosion In the hydraulic system, ensuring the efficient operation of the brake system. The chemical composition of automotive brake fluids varies, with some using borate esters, glycol ethers, or polyethylene glycols. DOT 3, DOT 4, and DOT 5 are common types of automotive brake fluids, each with different boiling points and properties. Brake fluid plays a crucial role in vehicle safety, as it facilitates the conversion of pedal pressure into braking force. It is used in various automotive applications, including passenger cars, commercial vehicles, electric vehicles, and heavy-duty vehicles. In addition to brake systems, brake fluid is also used in brake by wire systems, anti-lock brake systems, and electronic stability programs.

What are the market trends shaping the Automotive Brake Fluid Industry?

  • Growing popularity of EVs is the upcoming market trend. The market experiences growth due to the increasing sales of electric vehicles (EVs). In 2023, EV sales have surpassed 2.3 million In the first quarter, accounting for approximately 14% of total automotive sales. China, Europe, and the US are the leading markets for EV sales. The rise in EV adoption is driven by the decreasing battery prices and the need for high-performance fluids for electric brake systems. Automotive brake fluids, including glycol ethers and polyethylene glycols, are essential components of hydraulic braking systems. They lubricate mechanical elements, such as pistons and cylinders, In the hydraulic braking system, ensuring vehicle safety.
  • These fluids also prevent metal corrosion and reduce brake fade, noise, and vibration. Automotive brake fluids come in various types, including DOT 3 glycol, DOT 4 glycol, and DOT 5 silicon. The chemical composition of these fluids varies, with borate and silicon-based options available. Automotive service centers, retailers, and OEMs use these fluids for replacement and maintenance of vehicles, including passenger cars, commercial vehicles, and heavy-duty vehicles.

What challenges does the Automotive Brake Fluid Industry face during its growth?

  • Volatility in raw material prices is a key challenge affecting the industry growth. The production of automotive brake fluids relies heavily on ethylene glycol, which is derived from ethylene. The oil and gas industry is a significant supplier of ethylene for ethylene oxide production, making it a crucial factor In the pricing of automotive brake fluids. In 2022, the global crude oil market experienced volatile price fluctuations, leading to potential increases In the cost of ethylene glycol production. This could negatively impact the overall cost of manufacturing automotive brake fluids. Automotive brake fluids are essential components in hydraulic braking systems, including hydraulic brakes, clutches, and mechanical elements such as pistons and cylinders in vehicles.
  • They are available in various types, including glycol ethers and polyethylene glycols, each catering to specific vehicle safety standards. Deterioration of brake fluids due to water content, boiling point, and chemical composition can lead to issues like brake fade reduction, noise elimination, and metal corrosion prevention. Brake fluid is used in various automotive applications, including passenger cars, commercial vehicles, electric vehicles, and specialized vehicles like antique cars, weekend cars, collector cars, military vehicles, heavy-duty vehicles, towing vehicles, and race cars. Automobile service centers, workshops, retailers, and OEMs are key consumers of automotive brake fluids. High-performance fluids cater to the specific requirements of various applications, ensuring optimal vehicle safety and performance.

Exclusive Customer Landscape

The automotive brake fluid market forecasting report includes the adoption lifecycle of the market, covering from the innovator's stage to the laggard's stage. It focuses on adoption rates in different regions based on penetration. Furthermore, the automotive brake fluid market report also includes key purchase criteria and drivers of price sensitivity to help companies evaluate and develop their market growth analysis strategies.

Automotive Brake Fluid Market Share by Geography

 Customer Landscape

Key Companies & Market Insights

Companies are implementing various strategies, such as strategic alliances, automotive brake fluid market forecast, partnerships, mergers and acquisitions, geographical expansion, and product/service launches, to enhance their presence in the industry.

The industry research and growth report includes detailed analyses of the competitive landscape of the market and information about key companies, including:

  • ADVICS
  • AutoChemie Bitterfeld GmbH
  • BASF SE
  • BP Plc
  • Chevron Corp.
  • China Petroleum and Chemical Corp.
  • Clariant International Ltd.
  • DuPont de Nemours Inc.
  • Exxon Mobil Corp.
  • FUCHS PETROLUB SE
  • Granville Oil and Chemicals Ltd.
  • Guangdong Delian Group Co., Ltd.
  • Hinduja Group Ltd.
  • HKS Co. Ltd.
  • Indian Oil Corp. Ltd.
  • Lubrex FZC
  • Saudi Arabian Oil Co.
  • Shell plc
  • TotalEnergies SE
  • ZF Friedrichshafen AG

Qualitative and quantitative analysis of companies has been conducted to help clients understand the wider business environment as well as the strengths and weaknesses of key industry players. Data is qualitatively analyzed to categorize companies as pure play, category-focused, industry-focused, and diversified; it is quantitatively analyzed to categorize companies as dominant, leading, strong, tentative, and weak.

Research Analyst Overview

The market encompasses hydraulic fluids specifically designed for use in automotive applications. These fluids play a crucial role In the lubrication and corrosion protection of various mechanical elements withIn the hydraulic braking system. The chemical composition of automotive brake fluids varies, with some containing glycol ethers and others polyethylene glycols. Brake fluids are essential for maintaining the efficient operation of hydraulic brakes, clutches, and other mechanical components. The hydraulic braking system relies on the fluid to transmit pressure from the brake pedal to the brake liners and other mechanical components, enabling the vehicle to stop efficiently and safely. The chemical composition of automotive brake fluids is carefully formulated to meet vehicle safety standards.

For instance, they are designed to prevent metal corrosion and ensure the fluid's boiling point remains consistent under various operating conditions. The fluids are also engineered to work effectively with rubber components, such as brake pads and rotors, to prevent deterioration and ensure optimal performance. Automotive brake fluids are available in various types, including DOT 3 glycol, DOT 4 glycol, and DOT 5 silicon-based fluids. DOT 3 and DOT 4 fluids are glycol-based, while DOT 5 fluids are silicon-based. Each type offers unique benefits, such as improved boiling points, longer service life, and enhanced corrosion protection. The market caters to a diverse range of vehicles, from passenger cars and commercial vehicles to heavy-duty vehicles, military vehicles, antique cars, weekend cars, collector cars, towing vehicles, and race cars.

In addition, the market serves various channels, including automobile service centers, workshops, retailers, general retailers, gasoline retailers, and automotive retailers. The demand for automotive brake fluids is driven by the need to ensure vehicle safety and efficiency. As the automotive industry evolves, so too do the requirements for brake fluids. High-performance fluids are increasingly popular, offering benefits such as metal corrosion prevention, brake fade reduction, and noise elimination. The market for automotive brake fluids is expected to grow, driven by factors such as the increasing demand for vehicle safety and the development of advanced technologies, such as brake by wire systems and electronic stability programs.

Additionally, the falling battery prices in electric vehicles are expected to drive demand for high-performance brake fluids that cater to the unique requirements of electric vehicle braking systems. The market caters to a diverse range of vehicles and serves various channels, offering a range of brake fluid types to meet the unique requirements of each application. The market is expected to grow, driven by factors such as the increasing demand for vehicle safety, the development of advanced technologies, and the evolving needs of the automotive industry.

Market Scope

Report Coverage

Details

Page number

171

Base year

2023

Historic period

2018-2022

Forecast period

2024-2028

Growth momentum & CAGR

Accelerate at a CAGR of 2.95%

Market growth 2024-2028

USD 317.14 million

Market structure

Fragmented

YoY growth 2023-2024(%)

2.31

Key countries

US, China, Japan, India, and Germany

Competitive landscape

Leading Companies, market growth and forecasting, Market Positioning of Companies, Competitive Strategies, and Industry Risks

Request Free Sample

What are the Key Data Covered in this Automotive Brake Fluid Market Research and Growth Report?

  • CAGR of the Automotive Brake Fluid industry during the forecast period
  • Detailed information on factors that will drive the growth and forecasting between 2024 and 2028
  • Precise estimation of the size of the market and its contribution of the industry in focus to the parent market
  • Accurate predictions about upcoming growth and trends and changes in consumer behaviour
  • Growth of the market across APAC, Europe, North America, South America, and Middle East and Africa
  • Thorough analysis of the market's competitive landscape and detailed information about companies
  • Comprehensive analysis of factors that will challenge the automotive brake fluid market growth of industry companies

We can help! Our analysts can customize this automotive brake fluid market research report to meet your requirements.

Get in touch

1 Executive Summary

  • 1.1 Market overview
    • Exhibit 01: Executive Summary – Chart on Market Overview
    • Exhibit 02: Executive Summary – Data Table on Market Overview
    • Exhibit 03: Executive Summary – Chart on Global Market Characteristics
    • Exhibit 04: Executive Summary – Chart on Market by Geography
    • Exhibit 05: Executive Summary – Chart on Market Segmentation by Channel
    • Exhibit 06: Executive Summary – Chart on Market Segmentation by Application
    • Exhibit 07: Executive Summary – Chart on Incremental Growth
    • Exhibit 08: Executive Summary – Data Table on Incremental Growth
    • Exhibit 09: Executive Summary – Chart on Vendor Market Positioning

2 Market Landscape

  • 2.1 Market ecosystem
    • Exhibit 10: Parent market
    • Exhibit 11: Market Characteristics

3 Market Sizing

  • 3.1 Market definition
    • Exhibit 12: Offerings of vendors included in the market definition
  • 3.2 Market segment analysis
    • Exhibit 13: Market segments
  • 3.3 Market size 2023
    • 3.4 Market outlook: Forecast for 2023-2028
      • Exhibit 14: Chart on Global - Market size and forecast 2023-2028 ($ million)
      • Exhibit 15: Data Table on Global - Market size and forecast 2023-2028 ($ million)
      • Exhibit 16: Chart on Global Market: Year-over-year growth 2023-2028 (%)
      • Exhibit 17: Data Table on Global Market: Year-over-year growth 2023-2028 (%)

    4 Historic Market Size

    • 4.1 Global automotive brake fluid Market 2018 - 2022
      • Exhibit 18: Historic Market Size – Data Table on global automotive brake fluid Market 2018 - 2022 ($ million)
    • 4.2 Channel Segment Analysis 2018 - 2022
      • Exhibit 19: Historic Market Size – Channel Segment 2018 - 2022 ($ million)
    • 4.3 Application Segment Analysis 2018 - 2022
      • Exhibit 20: Historic Market Size – Application Segment 2018 - 2022 ($ million)
    • 4.4 Geography Segment Analysis 2018 - 2022
      • Exhibit 21: Historic Market Size – Geography Segment 2018 - 2022 ($ million)
    • 4.5 Country Segment Analysis 2018 - 2022
      • Exhibit 22: Historic Market Size – Country Segment 2018 - 2022 ($ million)

    5 Five Forces Analysis

    • 5.1 Five forces summary
      • Exhibit 23: Five forces analysis - Comparison between 2023 and 2028
    • 5.2 Bargaining power of buyers
      • Exhibit 24: Chart on Bargaining power of buyers – Impact of key factors 2023 and 2028
    • 5.3 Bargaining power of suppliers
      • Exhibit 25: Bargaining power of suppliers – Impact of key factors in 2023 and 2028
    • 5.4 Threat of new entrants
      • Exhibit 26: Threat of new entrants – Impact of key factors in 2023 and 2028
    • 5.5 Threat of substitutes
      • Exhibit 27: Threat of substitutes – Impact of key factors in 2023 and 2028
    • 5.6 Threat of rivalry
      • Exhibit 28: Threat of rivalry – Impact of key factors in 2023 and 2028
    • 5.7 Market condition
      • Exhibit 29: Chart on Market condition - Five forces 2023 and 2028

    6 Market Segmentation by Channel

    • 6.1 Market segments
      • Exhibit 30: Chart on Channel - Market share 2023-2028 (%)
      • Exhibit 31: Data Table on Channel - Market share 2023-2028 (%)
    • 6.2 Comparison by Channel
      • Exhibit 32: Chart on Comparison by Channel
      • Exhibit 33: Data Table on Comparison by Channel
    • 6.3 OEM - Market size and forecast 2023-2028
      • Exhibit 34: Chart on OEM - Market size and forecast 2023-2028 ($ million)
      • Exhibit 35: Data Table on OEM - Market size and forecast 2023-2028 ($ million)
      • Exhibit 36: Chart on OEM - Year-over-year growth 2023-2028 (%)
      • Exhibit 37: Data Table on OEM - Year-over-year growth 2023-2028 (%)
    • 6.4 Aftermarket - Market size and forecast 2023-2028
      • Exhibit 38: Chart on Aftermarket - Market size and forecast 2023-2028 ($ million)
      • Exhibit 39: Data Table on Aftermarket - Market size and forecast 2023-2028 ($ million)
      • Exhibit 40: Chart on Aftermarket - Year-over-year growth 2023-2028 (%)
      • Exhibit 41: Data Table on Aftermarket - Year-over-year growth 2023-2028 (%)
    • 6.5 Market opportunity by Channel
      • Exhibit 42: Market opportunity by Channel ($ million)
      • Exhibit 43: Data Table on Market opportunity by Channel ($ million)

    7 Market Segmentation by Application

    • 7.1 Market segments
      • Exhibit 44: Chart on Application - Market share 2023-2028 (%)
      • Exhibit 45: Data Table on Application - Market share 2023-2028 (%)
    • 7.2 Comparison by Application
      • Exhibit 46: Chart on Comparison by Application
      • Exhibit 47: Data Table on Comparison by Application
    • 7.3 Passenger cars - Market size and forecast 2023-2028
      • Exhibit 48: Chart on Passenger cars - Market size and forecast 2023-2028 ($ million)
      • Exhibit 49: Data Table on Passenger cars - Market size and forecast 2023-2028 ($ million)
      • Exhibit 50: Chart on Passenger cars - Year-over-year growth 2023-2028 (%)
      • Exhibit 51: Data Table on Passenger cars - Year-over-year growth 2023-2028 (%)
    • 7.4 Commercial vehicles - Market size and forecast 2023-2028
      • Exhibit 52: Chart on Commercial vehicles - Market size and forecast 2023-2028 ($ million)
      • Exhibit 53: Data Table on Commercial vehicles - Market size and forecast 2023-2028 ($ million)
      • Exhibit 54: Chart on Commercial vehicles - Year-over-year growth 2023-2028 (%)
      • Exhibit 55: Data Table on Commercial vehicles - Year-over-year growth 2023-2028 (%)
    • 7.5 Market opportunity by Application
      • Exhibit 56: Market opportunity by Application ($ million)
      • Exhibit 57: Data Table on Market opportunity by Application ($ million)

    8 Customer Landscape

    • 8.1 Customer landscape overview
      • Exhibit 58: Analysis of price sensitivity, lifecycle, customer purchase basket, adoption rates, and purchase criteria

    9 Geographic Landscape

    • 9.1 Geographic segmentation
      • Exhibit 59: Chart on Market share by geography 2023-2028 (%)
      • Exhibit 60: Data Table on Market share by geography 2023-2028 (%)
    • 9.2 Geographic comparison
      • Exhibit 61: Chart on Geographic comparison
      • Exhibit 62: Data Table on Geographic comparison
    • 9.3 APAC - Market size and forecast 2023-2028
      • Exhibit 63: Chart on APAC - Market size and forecast 2023-2028 ($ million)
      • Exhibit 64: Data Table on APAC - Market size and forecast 2023-2028 ($ million)
      • Exhibit 65: Chart on APAC - Year-over-year growth 2023-2028 (%)
      • Exhibit 66: Data Table on APAC - Year-over-year growth 2023-2028 (%)
    • 9.4 Europe - Market size and forecast 2023-2028
      • Exhibit 67: Chart on Europe - Market size and forecast 2023-2028 ($ million)
      • Exhibit 68: Data Table on Europe - Market size and forecast 2023-2028 ($ million)
      • Exhibit 69: Chart on Europe - Year-over-year growth 2023-2028 (%)
      • Exhibit 70: Data Table on Europe - Year-over-year growth 2023-2028 (%)
    • 9.5 North America - Market size and forecast 2023-2028
      • Exhibit 71: Chart on North America - Market size and forecast 2023-2028 ($ million)
      • Exhibit 72: Data Table on North America - Market size and forecast 2023-2028 ($ million)
      • Exhibit 73: Chart on North America - Year-over-year growth 2023-2028 (%)
      • Exhibit 74: Data Table on North America - Year-over-year growth 2023-2028 (%)
    • 9.6 South America - Market size and forecast 2023-2028
      • Exhibit 75: Chart on South America - Market size and forecast 2023-2028 ($ million)
      • Exhibit 76: Data Table on South America - Market size and forecast 2023-2028 ($ million)
      • Exhibit 77: Chart on South America - Year-over-year growth 2023-2028 (%)
      • Exhibit 78: Data Table on South America - Year-over-year growth 2023-2028 (%)
    • 9.7 Middle East and Africa - Market size and forecast 2023-2028
      • Exhibit 79: Chart on Middle East and Africa - Market size and forecast 2023-2028 ($ million)
      • Exhibit 80: Data Table on Middle East and Africa - Market size and forecast 2023-2028 ($ million)
      • Exhibit 81: Chart on Middle East and Africa - Year-over-year growth 2023-2028 (%)
      • Exhibit 82: Data Table on Middle East and Africa - Year-over-year growth 2023-2028 (%)
    • 9.8 China - Market size and forecast 2023-2028
      • Exhibit 83: Chart on China - Market size and forecast 2023-2028 ($ million)
      • Exhibit 84: Data Table on China - Market size and forecast 2023-2028 ($ million)
      • Exhibit 85: Chart on China - Year-over-year growth 2023-2028 (%)
      • Exhibit 86: Data Table on China - Year-over-year growth 2023-2028 (%)
    • 9.9 US - Market size and forecast 2023-2028
      • Exhibit 87: Chart on US - Market size and forecast 2023-2028 ($ million)
      • Exhibit 88: Data Table on US - Market size and forecast 2023-2028 ($ million)
      • Exhibit 89: Chart on US - Year-over-year growth 2023-2028 (%)
      • Exhibit 90: Data Table on US - Year-over-year growth 2023-2028 (%)
    • 9.10 Japan - Market size and forecast 2023-2028
      • Exhibit 91: Chart on Japan - Market size and forecast 2023-2028 ($ million)
      • Exhibit 92: Data Table on Japan - Market size and forecast 2023-2028 ($ million)
      • Exhibit 93: Chart on Japan - Year-over-year growth 2023-2028 (%)
      • Exhibit 94: Data Table on Japan - Year-over-year growth 2023-2028 (%)
    • 9.11 India - Market size and forecast 2023-2028
      • Exhibit 95: Chart on India - Market size and forecast 2023-2028 ($ million)
      • Exhibit 96: Data Table on India - Market size and forecast 2023-2028 ($ million)
      • Exhibit 97: Chart on India - Year-over-year growth 2023-2028 (%)
      • Exhibit 98: Data Table on India - Year-over-year growth 2023-2028 (%)
    • 9.12 Germany - Market size and forecast 2023-2028
      • Exhibit 99: Chart on Germany - Market size and forecast 2023-2028 ($ million)
      • Exhibit 100: Data Table on Germany - Market size and forecast 2023-2028 ($ million)
      • Exhibit 101: Chart on Germany - Year-over-year growth 2023-2028 (%)
      • Exhibit 102: Data Table on Germany - Year-over-year growth 2023-2028 (%)
    • 9.13 Market opportunity by geography
      • Exhibit 103: Market opportunity by geography ($ million)
      • Exhibit 104: Data Tables on Market opportunity by geography ($ million)

    10 Drivers, Challenges, and Trends

    • 10.1 Market drivers
      • 10.2 Market challenges
        • 10.3 Impact of drivers and challenges
          • Exhibit 105: Impact of drivers and challenges in 2023 and 2028
        • 10.4 Market trends

          11 Vendor Landscape

          • 11.1 Overview
            • 11.2 Vendor landscape
              • Exhibit 106: Overview on Criticality of inputs and Factors of differentiation
            • 11.3 Landscape disruption
              • Exhibit 107: Overview on factors of disruption
            • 11.4 Industry risks
              • Exhibit 108: Impact of key risks on business

            12 Vendor Analysis

            • 12.1 Vendors covered
              • Exhibit 109: Vendors covered
            • 12.2 Market positioning of vendors
              • Exhibit 110: Matrix on vendor position and classification
            • 12.3 ADVICS
              • Exhibit 111: ADVICS - Overview
              • Exhibit 112: ADVICS - Product / Service
              • Exhibit 113: ADVICS - Key offerings
            • 12.4 AutoChemie Bitterfeld GmbH
              • Exhibit 114: AutoChemie Bitterfeld GmbH - Overview
              • Exhibit 115: AutoChemie Bitterfeld GmbH - Product / Service
              • Exhibit 116: AutoChemie Bitterfeld GmbH - Key offerings
            • 12.5 BASF SE
              • Exhibit 117: BASF SE - Overview
              • Exhibit 118: BASF SE - Business segments
              • Exhibit 119: BASF SE - Key news
              • Exhibit 120: BASF SE - Key offerings
              • Exhibit 121: BASF SE - Segment focus
            • 12.6 BP Plc
              • Exhibit 122: BP Plc - Overview
              • Exhibit 123: BP Plc - Business segments
              • Exhibit 124: BP Plc - Key news
              • Exhibit 125: BP Plc - Key offerings
              • Exhibit 126: BP Plc - Segment focus
            • 12.7 Chevron Corp.
              • Exhibit 127: Chevron Corp. - Overview
              • Exhibit 128: Chevron Corp. - Business segments
              • Exhibit 129: Chevron Corp. - Key news
              • Exhibit 130: Chevron Corp. - Key offerings
              • Exhibit 131: Chevron Corp. - Segment focus
            • 12.8 China Petroleum and Chemical Corp.
              • Exhibit 132: China Petroleum and Chemical Corp. - Overview
              • Exhibit 133: China Petroleum and Chemical Corp. - Business segments
              • Exhibit 134: China Petroleum and Chemical Corp. - Key news
              • Exhibit 135: China Petroleum and Chemical Corp. - Key offerings
              • Exhibit 136: China Petroleum and Chemical Corp. - Segment focus
            • 12.9 Clariant International Ltd.
              • Exhibit 137: Clariant International Ltd. - Overview
              • Exhibit 138: Clariant International Ltd. - Business segments
              • Exhibit 139: Clariant International Ltd. - Key news
              • Exhibit 140: Clariant International Ltd. - Key offerings
              • Exhibit 141: Clariant International Ltd. - Segment focus
            • 12.10 DuPont de Nemours Inc.
              • Exhibit 142: DuPont de Nemours Inc. - Overview
              • Exhibit 143: DuPont de Nemours Inc. - Business segments
              • Exhibit 144: DuPont de Nemours Inc. - Key news
              • Exhibit 145: DuPont de Nemours Inc. - Key offerings
              • Exhibit 146: DuPont de Nemours Inc. - Segment focus
            • 12.11 Exxon Mobil Corp.
              • Exhibit 147: Exxon Mobil Corp. - Overview
              • Exhibit 148: Exxon Mobil Corp. - Business segments
              • Exhibit 149: Exxon Mobil Corp. - Key news
              • Exhibit 150: Exxon Mobil Corp. - Key offerings
              • Exhibit 151: Exxon Mobil Corp. - Segment focus
            • 12.12 FUCHS PETROLUB SE
              • Exhibit 152: FUCHS PETROLUB SE - Overview
              • Exhibit 153: FUCHS PETROLUB SE - Business segments
              • Exhibit 154: FUCHS PETROLUB SE - Key news
              • Exhibit 155: FUCHS PETROLUB SE - Key offerings
              • Exhibit 156: FUCHS PETROLUB SE - Segment focus
            • 12.13 Granville Oil and Chemicals Ltd.
              • Exhibit 157: Granville Oil and Chemicals Ltd. - Overview
              • Exhibit 158: Granville Oil and Chemicals Ltd. - Product / Service
              • Exhibit 159: Granville Oil and Chemicals Ltd. - Key offerings
            • 12.14 Guangdong Delian Group Co., Ltd.
              • Exhibit 160: Guangdong Delian Group Co., Ltd. - Overview
              • Exhibit 161: Guangdong Delian Group Co., Ltd. - Key offerings
            • 12.15 Hinduja Group Ltd.
              • Exhibit 162: Hinduja Group Ltd. - Overview
              • Exhibit 163: Hinduja Group Ltd. - Product / Service
              • Exhibit 164: Hinduja Group Ltd. - Key offerings
            • 12.16 Shell plc
              • Exhibit 165: Shell plc - Overview
              • Exhibit 166: Shell plc - Business segments
              • Exhibit 167: Shell plc - Key news
              • Exhibit 168: Shell plc - Key offerings
              • Exhibit 169: Shell plc - Segment focus
            • 12.17 TotalEnergies SE
              • Exhibit 170: TotalEnergies SE - Overview
              • Exhibit 171: TotalEnergies SE - Business segments
              • Exhibit 172: TotalEnergies SE - Key news
              • Exhibit 173: TotalEnergies SE - Key offerings
              • Exhibit 174: TotalEnergies SE - Segment focus

            13 Appendix

            • 13.1 Scope of the report
              • 13.2 Inclusions and exclusions checklist
                • Exhibit 175: Inclusions checklist
                • Exhibit 176: Exclusions checklist
              • 13.3 Currency conversion rates for US$
                • Exhibit 177: Currency conversion rates for US$
              • 13.4 Research methodology
                • Exhibit 178: Research methodology
                • Exhibit 179: Validation techniques employed for market sizing
                • Exhibit 180: Information sources
              • 13.5 List of abbreviations
                • Exhibit 181: List of abbreviations

              Research Methodology

              Technavio presents a detailed picture of the market by way of study, synthesis, and summation of data from multiple sources. The analysts have presented the various facets of the market with a particular focus on identifying the key industry influencers. The data thus presented is comprehensive, reliable, and the result of extensive research, both primary and secondary.

              INFORMATION SOURCES

              Primary sources

              • Manufacturers and suppliers
              • Channel partners
              • Industry experts
              • Strategic decision makers

              Secondary sources

              • Industry journals and periodicals
              • Government data
              • Financial reports of key industry players
              • Historical data
              • Press releases

              DATA ANALYSIS

              Data Synthesis

              • Collation of data
              • Estimation of key figures
              • Analysis of derived insights

              Data Validation

              • Triangulation with data models
              • Reference against proprietary databases
              • Corroboration with industry experts

              REPORT WRITING

              Qualitative

              • Market drivers
              • Market challenges
              • Market trends
              • Five forces analysis

              Quantitative

              • Market size and forecast
              • Market segmentation
              • Geographical insights
              • Competitive landscape

              Interested in this report?

              Get your sample now to see our research methodology and insights!

              Download Now

              Frequently Asked Questions

              Automotive Brake Fluid market growth will increase by $ 317.14 mn during 2024-2028.

              The Automotive Brake Fluid market is expected to grow at a CAGR of 2.95% during 2024-2028.

              Automotive Brake Fluid market is segmented by Channel( OEM, Aftermarket) Application( Passenger cars, Commercial vehicles)

              ADVICS, AutoChemie Bitterfeld GmbH, BASF SE, BP Plc, Chevron Corp., China Petroleum and Chemical Corp., Clariant International Ltd., DuPont de Nemours Inc., Exxon Mobil Corp., FUCHS PETROLUB SE, Granville Oil and Chemicals Ltd., Guangdong Delian Group Co., Ltd., Hinduja Group Ltd., HKS Co. Ltd., Indian Oil Corp. Ltd., Lubrex FZC, Saudi Arabian Oil Co., Shell plc, TotalEnergies SE, ZF Friedrichshafen AG are a few of the key vendors in the Automotive Brake Fluid market.

              APAC will register the highest growth rate of 49% among the other regions. Therefore, the Automotive Brake Fluid market in APAC is expected to garner significant business opportunities for the vendors during the forecast period.

              US, China, Japan, India, Germany

              • Growing number of vehicles in useThe global demand for automotive brake fluids is growing owing to numerous factors. One is the increasing number of vehicles (or vehicles-in-use) across the world is the driving factor this market.
              • which is leading to the high consumption of brake fluid in the global automotive brake fluid market during the forecast period.  Global automotive sales were slightly higher in most regions across the world in 2022. For instance is the driving factor this market.
              • in 2022 is the driving factor this market.
              • the number of registered passenger cars in the EU reached almost 253 million is the driving factor this market.
              • which was an increase of 7% over 2017 is the driving factor this market.
              • according to the European Union. Similarly is the driving factor this market.
              • in the US is the driving factor this market.
              • the sales of new lightweight vehicles increased from 8 is the driving factor this market.
              • 568 units in 2017 to 9 is the driving factor this market.
              • 069 in 2022 is the driving factor this market.
              • according to the US Department of Transportation (DOT). In addition is the driving factor this market.
              • the increasing lifespan of vehicles is also playing a crucial role in driving the number of vehicles on the road and is increasing the demand for automotive brake fluid. For instance is the driving factor this market.
              • modern vehicles with more rigid construction and durable braking systems need to undergo regular maintenance at certain intervals is the driving factor this market.
              • which was not the case with previous generation vehicles. This is leading to an increase in the lifespan of vehicles is the driving factor this market.
              • as consumers can keep their vehicles in operation for a longer time is the driving factor this market.
              • thereby driving the demand for automotive brake fluids. Therefore is the driving factor this market.
              • owing to an increase in th number of vehicles in operation is the driving factor this market.
              • the global demand for automotive brake fluids is increasing is the driving factor this market.
              • which is the driving factor this market.
              • in turn is the driving factor this market.
              • will drive the growth of the market in focus during the forecast period. is the driving factor this market.

              The Automotive Brake Fluid market vendors should focus on grabbing business opportunities from the OEM segment as it accounted for the largest market share in the base year.