
Automotive Camera-Based Side Mirrors Market Size 2025-2029
The automotive camera-based side mirrors market size is forecast to increase by USD 20828.6 thousand at a CAGR of 29.6% between 2024 and 2029.
- The market is witnessing significant growth due to the increased utility of these advanced automotive mirror systems. Camera-based side mirrors offer several advantages over traditional mirrors, including a wider field of view, improved visibility in low light conditions, and reduced blind spots. Furthermore, the emergence of surround-view mirror systems is expected to fuel market growth, as these advanced systems provide a 360-degree view around the passanger vehicle enhancing safety and convenience for drivers. However, high replacement costs pose a significant challenge to market growth. Despite this obstacle, companies can capitalize on the market opportunities presented by the increasing demand for advanced safety features and consumer preference for improved visibility.
- To navigate the challenges effectively, manufacturers must focus on reducing replacement costs through technological innovations and cost-effective production methods. Additionally, strategic partnerships and collaborations can help companies expand their product offerings and reach a wider customer base. Overall, the market is poised for growth, driven by the increasing demand for advanced safety features and consumer preference for improved visibility. Companies that can effectively address the challenge of high replacement costs and leverage strategic partnerships and technological innovations will be well-positioned to capitalize on this market opportunity.
What will be the Size of the Automotive Camera-Based Side Mirrors Market during the forecast period?

- The market continues to evolve, integrating advanced technologies to enhance the driving experience and improve safety features. Weather-resistant camera modules capture high-resolution images, enabling features such as lane departure warning, surround view, and blind spot monitoring. Real-time processing and object recognition enable driver monitoring and parking assistance. Cloud-based services facilitate over-the-air updates, ensuring software remains up-to-date. Seamless integration of user interface, vehicle-to-vehicle communication, and vehicle-to-infrastructure communication optimizes cost and increases market penetration. Advanced driver-assistance systems and safety features, such as artificial intelligence, machine learning, and night vision, are becoming standard.
- Future trends include the integration of ultrasonic sensors, data analytics, and autonomous vehicles. LED lighting and fuel efficiency enhance the overall design, while safety standards ensure reliable performance. Research and development in camera technology and image processing continue to push the boundaries of what is possible, driving the market forward.
How is this Automotive Camera-Based Side Mirrors Industry segmented?
The automotive camera-based side mirrors industry research report provides comprehensive data (region-wise segment analysis), with forecasts and estimates in "USD thousand" for the period 2025-2029, as well as historical data from 2019-2023 for the following segments.
- Application
- Passenger cars
- Commercial vehicles
- Product Type
- Rear-view mirror
- Front mirror
- Type
- Single camera systems
- Multi-camera systems
- Component
- Cameras
- Displays
- Control units
- Others
- Geography
- North America
- US
- Canada
- Mexico
- Europe
- France
- Germany
- UK
- APAC
- China
- India
- Japan
- South Korea
- Rest of World (ROW)
- North America
By Application Insights
The passenger cars segment is estimated to witness significant growth during the forecast period.
The automotive industry is witnessing a significant shift towards camera-based side mirrors, driven by the integration of advanced safety features and convenience in passenger cars. Luxury automakers are prioritizing safety innovations, leading to the increasing adoption of camera-based mirrors. These mirrors offer advantages such as lane departure warning, surround view, and object recognition, enhancing the overall driver experience. Future trends include over-the-air updates, real-time processing, and driver monitoring, further increasing the demand for these advanced systems. Weather resistance, high-resolution imaging, and cost optimization are essential factors influencing the market. The integration of artificial intelligence, machine learning, and sensor fusion is expected to revolutionize the automotive sector, with camera-based side mirrors playing a pivotal role in autonomous vehicles and data analytics.
The popularity of electric vehicles and vehicle-to-vehicle communication is also fueling the market growth. Market penetration is further boosted by the availability of camera modules, display systems, software updates, and user-friendly interfaces. The market is expected to continue its steady expansion, with research and development in night vision, parking assistance, and digital rearview mirrors contributing to its evolution.

The Passenger cars segment was valued at USD 3300.10 thousand in 2019 and showed a gradual increase during the forecast period.
Regional Analysis
APAC is estimated to contribute 44% to the growth of the global market during the forecast period.Technavio's analysts have elaborately explained the regional trends and drivers that shape the market during the forecast period.

The market is witnessing significant growth, particularly in the Asia Pacific (APAC) region in 2024. This region is expected to consolidate its market position due to its high adoption rate of passenger cars. China, India, South Korea, and Japan are the major contributors to this growth. The passenger cars segment in APAC is projected to expand at a faster pace than other regions, leading to increased demand for automotive camera-based side mirrors. These mirrors are increasingly becoming standard or optional fitments in passenger cars across various segments. Advanced features such as lane departure warning, surround view, object recognition, and driver monitoring enhance the driver experience.
Future trends include over-the-air updates, high-resolution imaging, and real-time processing. Artificial intelligence, machine learning, and sensor fusion are also driving innovation in this market. Weather resistance, fuel efficiency, and safety standards are essential considerations for automotive grade camera modules. The integration of vehicle-to-vehicle (V2V) and vehicle-to-infrastructure (V2I) communication, ultrasonic sensors, and parking assistance systems further enhances the functionality of camera-based side mirrors. Camera-based side mirrors are also gaining popularity in electric vehicles and autonomous vehicles. Cost optimization, image processing, and cloud-based services are key factors influencing the market dynamics. The adoption rate of camera-based side mirrors is increasing due to their convenience and safety features, including blind spot monitoring and night vision.
Research and development efforts are ongoing to improve low-light performance, IP rating, and software updates. Overall, the market is poised for continued growth, driven by technological advancements and increasing demand for safety and convenience features in passenger cars.
Market Dynamics
Our researchers analyzed the data with 2024 as the base year, along with the key drivers, trends, and challenges. A holistic analysis of drivers will help companies refine their marketing strategies to gain a competitive advantage.
What are the key market drivers leading to the rise in the adoption of Automotive Camera-Based Side Mirrors Industry?
- The significant enhancement in the utility of automotive camera-based side mirrors serves as the primary catalyst for market growth in this sector.
- Autonomous camera-based side mirrors provide enhanced benefits over traditional side-view mirrors, making them an appealing choice for automotive manufacturers and consumers. The primary advantage of these mirrors is their superior weather resistance, ensuring clear visibility in various environmental conditions. Additionally, camera-based side mirrors offer high-resolution imaging, providing a clearer and more detailed view of the vehicle's surroundings. Moreover, these mirrors can be integrated with cloud-based services and software updates, enabling continuous improvement and cost optimization. The image processing capabilities of these mirrors offer a user-friendly interface, making it easier for drivers to detect and respond to potential hazards.
- Camera-based side mirrors also facilitate vehicle-to-vehicle communication, enhancing safety and improving overall driving experience. With adoption rates on the rise, the market for these mirrors is expected to grow significantly during the forecast period. The integration of advanced technologies such as machine learning and artificial intelligence further adds to the appeal of these mirrors. Overall, the benefits offered by camera-based side mirrors are expected to drive their adoption in the automotive industry.
What are the market trends shaping the Automotive Camera-Based Side Mirrors Industry?
- Surround-view mirror systems are gaining popularity in the automotive market as an emerging trend. This advanced technology provides drivers with a 360-degree view of their surroundings, enhancing safety and convenience.
- The market is experiencing significant growth due to the integration of advanced technologies such as ultrasonic sensors, data analytics, night vision, blind spot monitoring, and digital rearview mirrors. These innovations offer drivers improved visibility and safety features, particularly in challenging driving conditions. The increasing adoption of electric vehicles and autonomous vehicles is also fueling market penetration. Major players in the industry are investing heavily in research and development to integrate vehicle-to-infrastructure communication and immersive 360-degree camera systems, commonly referred to as surround-view mirror systems.
- These systems utilize multiple cameras strategically placed around the vehicle to provide a comprehensive view of the surroundings, eliminating blind spots. The integration of these advanced safety features is a response to the growing demand for enhanced vehicle safety and electronics.
What challenges does the Automotive Camera-Based Side Mirrors Industry face during its growth?
- The significant increase in replacement costs poses a major challenge to the industry's growth trajectory.
- The market is witnessing notable expansion due to technological advancements prioritizing vehicle safety and efficiency. However, a substantial challenge confronting this sector is the elevated replacement costs for these sophisticated systems. In contrast to traditional side mirrors, which range from USD100 to USD500 depending on the vehicle model and mirror type, camera-based side mirrors integrate complex camera and display technologies, leading to replacement costs ranging from USD1,500 to USD3,000 per unit.
- This substantial price disparity is attributable to the advanced components and technology involved, such as high-resolution cameras, image processing units, and display screens. Despite this challenge, the market's growth is fueled by the benefits these systems offer, including improved visibility, reduced blind spots, and enhanced driver assistance features.
Exclusive Customer Landscape
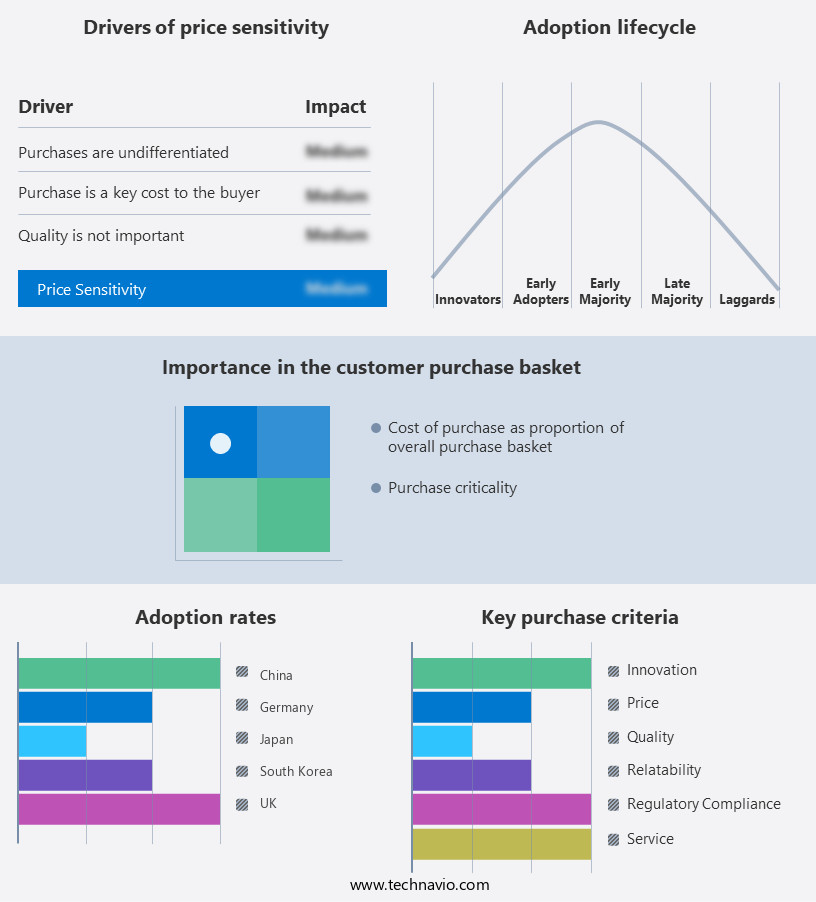
The automotive camera-based side mirrors market forecasting report includes the adoption lifecycle of the market, covering from the innovator's stage to the laggard's stage. It focuses on adoption rates in different regions based on penetration. Furthermore, the automotive camera-based side mirrors market report also includes key purchase criteria and drivers of price sensitivity to help companies evaluate and develop their market growth analysis strategies.
Customer Landscape
Key Companies & Market Insights
Companies are implementing various strategies, such as strategic alliances, automotive camera-based side mirrors market forecast, partnerships, mergers and acquisitions, geographical expansion, and product/service launches, to enhance their presence in the industry.
Bayerische Motoren Werke AG - This company specializes in advanced automotive technology, including camera-based side mirrors, offering a sleek and innovative alternative to traditional designs. By utilizing high-definition cameras instead of conventional mirrors, these solutions enhance visibility and reduce wind resistance, contributing to improved fuel efficiency and aerodynamics. The integration of real-time digital display screens ensures clear and unobstructed views, while also offering additional features such as blind spot detection and parking assistance. By embracing cutting-edge technology, this company sets a new standard for automotive design and functionality.
The industry research and growth report includes detailed analyses of the competitive landscape of the market and information about key companies, including:
- Bayerische Motoren Werke AG
- Continental AG
- Gentex Corp.
- Honda Motor Co. Ltd.
- Kappa optronics GmbH
- KYOCERA Corp.
- Magna International Inc.
- Mitsubishi Electric Corp.
- Nissan Motor Co. Ltd.
- Panasonic Holdings Corp.
- Robert Bosch GmbH
- Samsung Electronics Co. Ltd.
- Stoneridge Inc.
- Stonkam Co. Ltd.
- Toyota Motor Corp.
- Valeo SA
- ZF Friedrichshafen AG
Qualitative and quantitative analysis of companies has been conducted to help clients understand the wider business environment as well as the strengths and weaknesses of key industry players. Data is qualitatively analyzed to categorize companies as pure play, category-focused, industry-focused, and diversified; it is quantitatively analyzed to categorize companies as dominant, leading, strong, tentative, and weak.
Recent Development and News in Automotive Camera-Based Side Mirrors Market
- In January 2024, Magna International, a leading automotive technology supplier, announced the launch of its new HD Camera-based Side Mirror system, integrating advanced driver assistance features such as blind spot detection and object recognition (Magna International Press Release, 2024). This innovation is expected to revolutionize side mirror technology, offering enhanced safety and convenience to drivers.
- In March 2025, Continental AG and Samsung Electronics signed a strategic partnership to jointly develop advanced driver assistance systems (ADAS), including camera-based side mirrors, leveraging Samsung's expertise in semiconductors and display technologies (Continental AG Press Release, 2025). This collaboration aims to create a competitive edge in the market by combining Continental's automotive know-how with Samsung's technological capabilities.
- In May 2024, Bosch and NVIDIA teamed up to develop a camera-based side mirror system powered by NVIDIA's Drive AGX platform, providing real-time image processing and advanced driver assistance features (Bosch Press Release, 2024). This collaboration is expected to result in a more efficient and effective camera-based side mirror system, offering improved safety and reduced vehicle weight.
- In July 2025, the European Union passed a regulation mandating the installation of camera-based side mirrors in all new passenger cars from 2027 onwards (European Commission, 2025). This regulatory initiative is expected to significantly boost the market growth for camera-based side mirrors, as all major automakers will be required to adopt this technology in their new models.
Research Analyst Overview
The market is experiencing significant advancements, integrating technologies such as augmented reality (AR) and virtual reality (VR) to enhance the field of vision for drivers. These innovations offer a 360-degree view, improving safety and driver assistance systems, including adaptive cruise control, lane keeping assist, and automatic emergency braking. High-definition cameras ensure image clarity, while haptic feedback provides tactile sensations for user interface design. Privacy concerns have emerged as a market trend, with data security measures becoming increasingly important for automotive software and the Internet of Vehicles (IoV). Edge computing and cloud computing facilitate real-time data processing, reducing maintenance costs and improving overall vehicle networking.
Driverless technology, including pedestrian detection and traffic sign recognition, is gaining traction in the market. Smart mirror systems and head-up displays are becoming essential components of automotive electronics, offering a seamless user experience and safety enhancement. Object detection and lane keeping assist systems are essential features, contributing to the product lifecycle and aftermarket installation of camera-based side mirrors.
Dive into Technavio's robust research methodology, blending expert interviews, extensive data synthesis, and validated models for unparalleled Automotive Camera-Based Side Mirrors Market insights. See full methodology.
|
Market Scope |
|
|
Report Coverage |
Details |
|
Page number |
244 |
|
Base year |
2024 |
|
Historic period |
2019-2023 |
|
Forecast period |
2025-2029 |
|
Growth momentum & CAGR |
Accelerate at a CAGR of 29.6% |
|
Market growth 2025-2029 |
USD 20828.6 thousand |
|
Market structure |
Fragmented |
|
YoY growth 2024-2025(%) |
23.4 |
|
Key countries |
China, Japan, South Korea, US, Germany, India, UK, Canada, France, and Mexico |
|
Competitive landscape |
Leading Companies, Market Positioning of Companies, Competitive Strategies, and Industry Risks |
What are the Key Data Covered in this Automotive Camera-Based Side Mirrors Market Research and Growth Report?
- CAGR of the Automotive Camera-Based Side Mirrors industry during the forecast period
- Detailed information on factors that will drive the growth and forecasting between 2025 and 2029
- Precise estimation of the size of the market and its contribution of the industry in focus to the parent market
- Accurate predictions about upcoming growth and trends and changes in consumer behaviour
- Growth of the market across APAC, Europe, North America, Middle East and Africa, and South America
- Thorough analysis of the market's competitive landscape and detailed information about companies
- Comprehensive analysis of factors that will challenge the automotive camera-based side mirrors market growth of industry companies
We can help! Our analysts can customize this automotive camera-based side mirrors market research report to meet your requirements.