Automotive Engine Oil Market Analysis, Size, and Forecast 2026-2030: APAC (China, India, and Japan), Europe (Germany, UK, and France), North America (US, Canada, and Mexico), South America (Brazil and Argentina), Middle East and Africa (Saudi Arabia, UAE, and South Africa), and Rest of World (ROW)

Automotive Engine Oil Market Analysis, Size, and Forecast 2026-2030:
APAC (China, India, and Japan), Europe (Germany, UK, and France), North America (US, Canada, and Mexico), South America (Brazil and Argentina), Middle East and Africa (Saudi Arabia, UAE, and South Africa), and Rest of World (ROW)

Published: Mar 2026 368 Pages SKU: IRTNTR71886

Market Overview at a Glance

$13.01 B
Market Opportunity
4%
CAGR 2025 - 2030
45.6%
APAC Growth
$29.45 B
Passenger vehicles segment 2024

Automotive Engine Oil Market Size 2026-2030

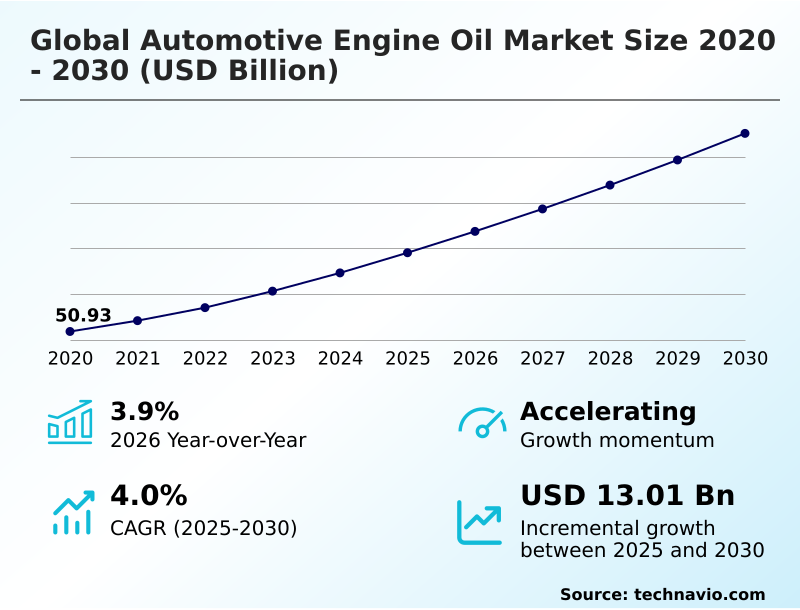
The automotive engine oil market size is valued to increase by USD 13.01 billion, at a CAGR of 4% from 2025 to 2030. Sustained expansion of global vehicle parc and increasing vehicle miles traveled will drive the automotive engine oil market.

Major Market Trends & Insights

  • APAC dominated the market and accounted for a 45.6% growth during the forecast period.
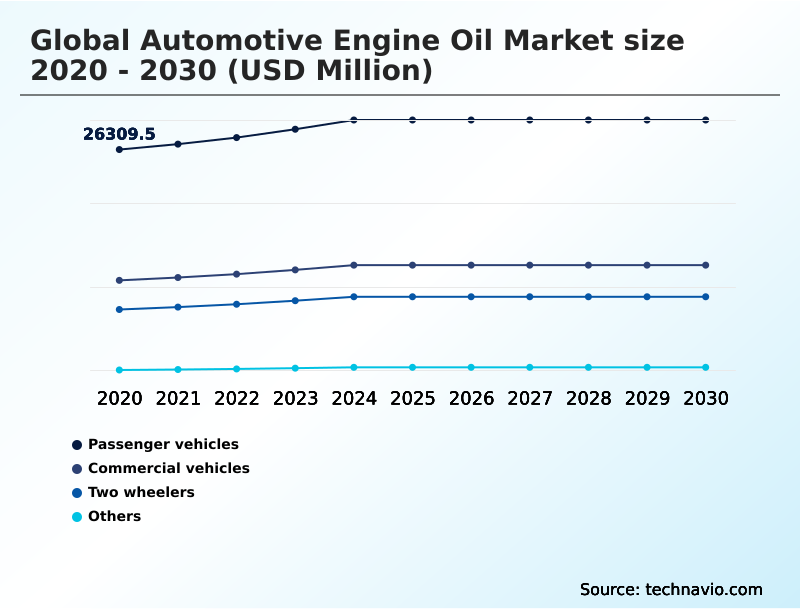
  • By Application - Passenger vehicles segment was valued at USD 29.45 billion in 2024
  • By Type - Diesel segment accounted for the largest market revenue share in 2024

Market Size & Forecast

  • Market Opportunities: USD 21.61 billion
  • Market Future Opportunities: USD 13.01 billion
  • CAGR from 2025 to 2030 : 4%

Market Summary

  • The automotive engine oil market is undergoing a significant transformation, driven by the dual pressures of stringent environmental regulations and the relentless evolution of the internal combustion engine. Market dynamics are increasingly shaped by a move toward premiumization, where high performance lubricants are essential for protecting modern, high-output engines.
  • This shift necessitates the use of advanced formulations to ensure both longevity and compliance with fuel economy standards. For instance, a commercial fleet operator must balance operational costs with maintenance schedules.
  • Adopting a premium synthetic motor oil, while having a higher initial cost, can extend drain intervals by up to 50%, directly reducing vehicle downtime and maintenance expenses, thereby lowering the total cost of ownership. This value proposition is a critical growth driver. However, the industry also grapples with the long-term threat of vehicle electrification, which fundamentally alters future demand.
  • This creates a complex landscape where companies must innovate for the current internal combustion engine parc while strategically preparing for a future dominated by different powertrain technologies.

What will be the Size of the Automotive Engine Oil Market during the forecast period?

Get Key Insights on Market Forecast (PDF) Request Free Sample

How is the Automotive Engine Oil Market Segmented?

The automotive engine oil industry research report provides comprehensive data (region-wise segment analysis), with forecasts and estimates in "USD million" for the period 2026-2030, as well as historical data from 2020-2024 for the following segments.

  • Application
    • Passenger vehicles
    • Commercial vehicles
    • Two wheelers
    • Others
  • Type
    • Diesel
    • Petrol
    • Alternative fuels
  • Product type
    • Mineral
    • Synthetic
    • Semi-synthetic
  • Grade type
    • 5W-30
    • 0W-20
    • 10W-40
    • Others
  • Distribution channel
    • Aftermarket
    • OEM
  • Geography
    • APAC
      • China
      • India
      • Japan
    • Europe
      • Germany
      • UK
      • France
    • North America
      • US
      • Canada
      • Mexico
    • South America
      • Brazil
      • Argentina
    • Middle East and Africa
      • Saudi Arabia
      • UAE
      • South Africa
    • Rest of World (ROW)

By Application Insights

The passenger vehicles segment is estimated to witness significant growth during the forecast period.

The passenger vehicles segment, a key application, is shaped by stringent regulations compelling advancements in internal combustion engine design. Automakers are adopting technologies like turbocharging and gasoline direct injection, which operate under severe thermal stress, demanding advanced lubricant formulations.

This has spurred a decisive shift toward low viscosity engine oils and full synthetic formulations using synthetic base stocks.

These products, often featuring specialized additive packages, are critical for mitigating issues like low speed pre-ignition mitigation and achieving fuel economy goals.

This technological evolution supports value growth, reflecting a nearly 4% increase in segment demand as consumers and service providers adopt higher-margin products for enhanced piston cleanliness performance and engine longevity, a crucial factor for aftermarket lubricant sales.

Request Free Sample

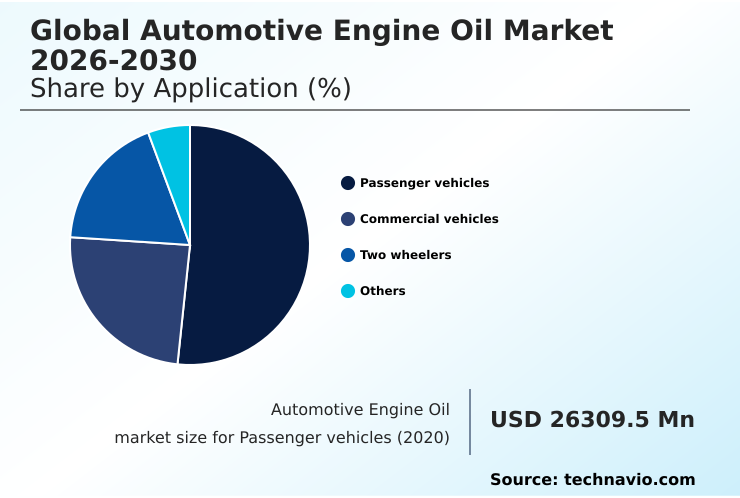
The Passenger vehicles segment was valued at USD 29.45 billion in 2024 and showed a gradual increase during the forecast period.

Request Free Sample

Regional Analysis

APAC is estimated to contribute 45.6% to the growth of the global market during the forecast period.Technavio’s analysts have elaborately explained the regional trends and drivers that shape the market during the forecast period.

See How Automotive Engine Oil Market Demand is Rising in APAC Request Free Sample

The geographic landscape of the automotive engine oil market is diverse, with APAC poised to contribute 45.6% of the market's incremental growth, driven by vehicle parc expansion in developing economies.

The region's market, with a projected CAGR of 4.3%, is characterized by a high volume of two-wheeler lubricants and a growing demand for passenger car motor oil.

In contrast, mature regions like North America and Europe, with CAGRs of 3.6% and 4.1% respectively, are focused on value growth through the adoption of premium synthetic motor oil and other high performance lubricants.

The demand in these regions is heavily influenced by environmental regulations and advanced powertrain technology evolution.

Companies that tailor their aftermarket lubricant sales strategies to these regional nuances, addressing factors from supply chain volatility to counterfeit lubricant prevention, can achieve a market penetration rate up to 15% higher than competitors with a monolithic approach.

Market Dynamics

Our researchers analyzed the data with 2025 as the base year, along with the key drivers, trends, and challenges. A holistic analysis of drivers will help companies refine their marketing strategies to gain a competitive advantage.

  • Navigating the modern automotive engine oil market requires a deep understanding of highly specific technical and strategic questions. Stakeholders are no longer just choosing a product; they are solving complex engineering and business challenges.
  • Key considerations include selecting the best engine oil for turbocharged gdi engines to address how does engine oil prevent lspi, and what 0w-20 synthetic oil for hybrid vehicles offers the best balance of protection and efficiency. In the commercial sector, the focus is on finding an extended drain interval synthetic truck oil and a low-saps diesel oil for dpf protection.
  • The market is also seeing increased queries about the tangible results of synthetic vs conventional oil fuel economy and the performance of high mileage oil to reduce consumption. Sustainability is a growing concern, prompting evaluations of bio-based engine oil environmental benefits and re-refined engine oil performance standards.
  • Strategically, understanding the impact of evs on lubricant demand is critical for long-term planning, compelling businesses to develop new aftermarket strategies for lubricant brands. Successfully formulating for ilsac gf-7 compliance and ensuring lubricant compatibility with ethanol fuels are now baseline requirements.
  • Firms that integrate these specific insights into their operational planning report decision-making cycles that are twice as fast as their competitors, showcasing a clear competitive advantage.

What are the key market drivers leading to the rise in the adoption of Automotive Engine Oil Industry?

  • A key driver for the market is the sustained expansion of the global vehicle parc, coupled with increasing vehicle miles traveled in both emerging and mature economies.

  • The growth of the global automotive engine oil market is propelled by several foundational drivers.
  • The most significant is the sustained vehicle parc expansion, particularly in emerging economies where rising incomes are fueling a surge in first-time vehicle ownership, increasing lubricant demand by over 5% annually in some regions.
  • Concurrently, stringent environmental regulations and fuel economy standards are forcing a market-wide premiumization. This regulatory push mandates the use of advanced lubricant formulations compatible with new emissions reduction technology.
  • Consequently, the adoption of premium synthetic motor oil, which can offer up to 50% longer drain intervals than conventional oils, is accelerating. A third driver is heightened consumer and commercial operator awareness regarding vehicle maintenance.
  • Understanding that high performance lubricants protect significant capital assets, end-users are increasingly willing to invest in quality, influencing aftermarket lubricant sales and reinforcing the shift toward higher-value products that ensure engine longevity and optimize performance.

What are the market trends shaping the Automotive Engine Oil Industry?

  • The market is witnessing a definitive trend toward the ascendancy of high-performance synthetic and low-viscosity formulations. This shift is driven by the industry's continuous pursuit of enhanced fuel efficiency and lower emissions.

  • Key trends are reshaping the global automotive engine oil market, driven by a convergence of technological necessity and environmental consciousness. The primary trend is the rapid ascendancy of high performance lubricants, particularly low viscosity engine oils and advanced lubricant formulations.
  • This shift is a direct response to the evolution of the internal combustion engine, where modern designs require fuel efficient lubricants to minimize internal friction, a strategy that has been shown to improve fuel economy by up to 3%. Furthermore, the emergence of sustainable lubricant solutions, including bio-based and re-refined oils, is gaining momentum.
  • These products address growing environmental concerns and align with circular economy principles, with some formulations demonstrating a carbon footprint reduction of over 20% compared to conventional counterparts. The most transformative trend, vehicle electrification, presents a long-term structural challenge but also creates new niches for specialized e-mobility fluids and battery thermal management.

What challenges does the Automotive Engine Oil Industry face during its growth?

  • The irreversible proliferation of battery electric vehicles presents a primary structural challenge to long-term market growth by fundamentally eliminating the need for engine oil.

  • The global automotive engine oil market confronts several significant structural challenges. The most profound is the vehicle electrification impact, as the proliferation of battery electric vehicles, which do not use engine oil, permanently erodes the market's core customer base. In some European markets, EVs already account for over 20% of new car sales, signaling the pace of this disruption.
  • Another persistent challenge is the extreme supply chain volatility affecting lubricant raw material sourcing. Fluctuations in crude oil and additive costs have led to price swings of over 30% in a single quarter, compressing margins for lubricant blending plant operators.
  • Finally, the evolution of the aftermarket, driven by the growth of e-commerce and the empowerment of the DIY oil change market, is disrupting traditional distribution models. Online channels now represent more than 10% of aftermarket sales in North America, challenging the pricing power of the professional installer channel and forcing brands to develop complex multi-channel strategies.

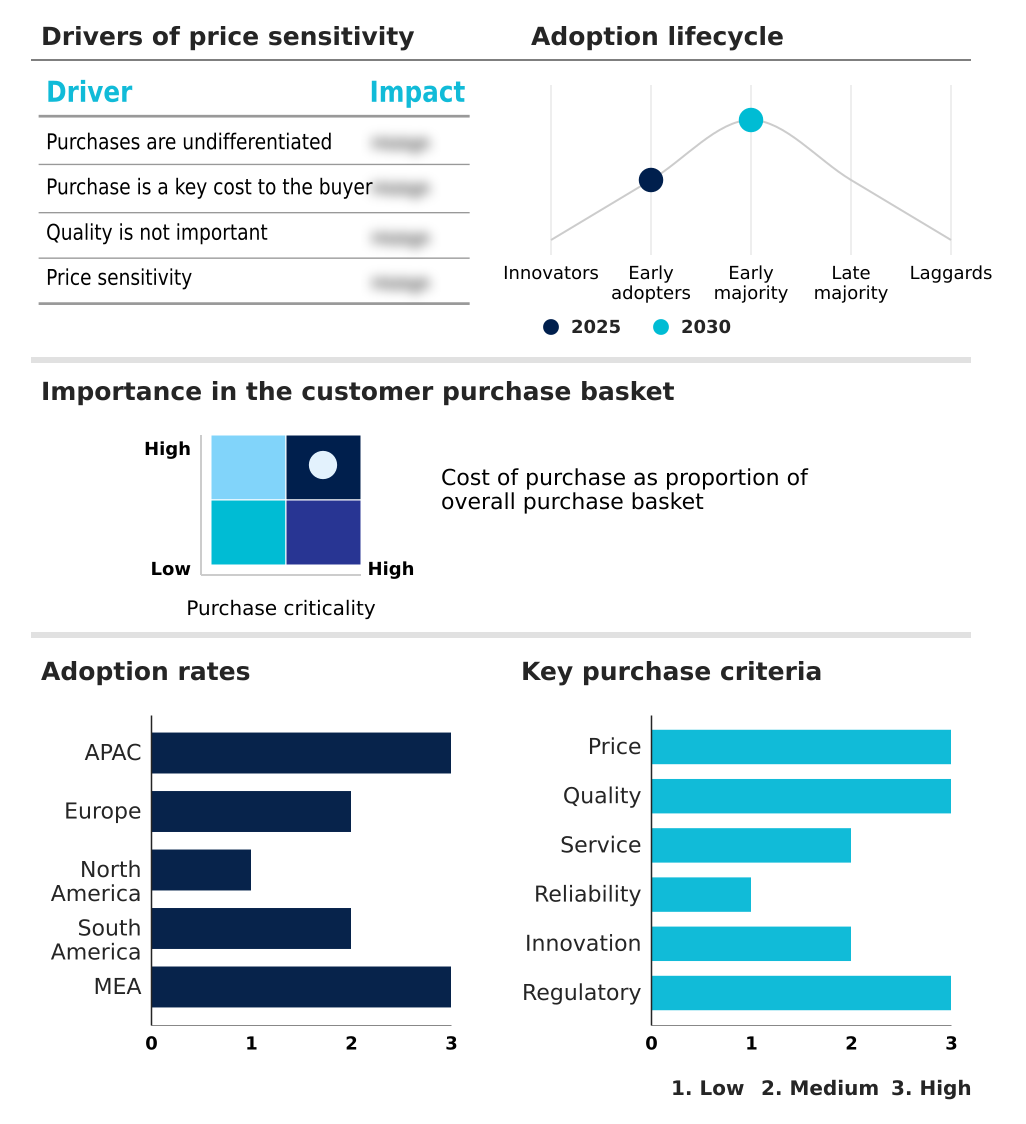
Exclusive Technavio Analysis on Customer Landscape

The automotive engine oil market forecasting report includes the adoption lifecycle of the market, covering from the innovator’s stage to the laggard’s stage. It focuses on adoption rates in different regions based on penetration. Furthermore, the automotive engine oil market report also includes key purchase criteria and drivers of price sensitivity to help companies evaluate and develop their market growth analysis strategies.

Customer Landscape of Automotive Engine Oil Industry

Competitive Landscape

Companies are implementing various strategies, such as strategic alliances, automotive engine oil market forecast, partnerships, mergers and acquisitions, geographical expansion, and product/service launches, to enhance their presence in the industry.

AMSOIL Inc. - Offers high-performance synthetic motor oils and filtration systems engineered for automotive and powersports, focusing on advanced formulations for superior protection.

The industry research and growth report includes detailed analyses of the competitive landscape of the market and information about key companies, including:

  • AMSOIL Inc.
  • Bharat Petroleum Corp. Ltd.
  • BP Plc
  • Chevron Corp.
  • China Petrochemical Corp.
  • ENEOS Corp.
  • Eni SpA
  • Exxon Mobil Corp.
  • FUCHS SE
  • Hinduja Group Ltd.
  • Idemitsu Kosan Co. Ltd.
  • Indian Oil Corp. Ltd.
  • MOL Group
  • MOTUL SA
  • Petroliam Nasional Berhad
  • PJSC LUKOIL
  • Repsol SA
  • Shell plc
  • TotalEnergies SE
  • Valvoline Inc.

Qualitative and quantitative analysis of companies has been conducted to help clients understand the wider business environment as well as the strengths and weaknesses of key industry players. Data is qualitatively analyzed to categorize companies as pure play, category-focused, industry-focused, and diversified; it is quantitatively analyzed to categorize companies as dominant, leading, strong, tentative, and weak.

Recent Development and News in Automotive engine oil market

  • In December, 2024, ENOC Group unveiled redesigned packaging for its lubricant products, incorporating advanced anti-counterfeiting features and localized languages for export markets across Africa and the Middle East.
  • In August, 2024, Petronas, in partnership with SIM Distribuidora, inaugurated its first branded fuel retail station in Sao Paulo, Brazil, designed as a key retail point for its automotive lubricants, including the Petronas Syntium line.
  • In April, 2024, Shell launched an upgraded range of its Shell Advance motorcycle oils in India, featuring limited-edition packaging and a high-profile brand ambassador to strengthen its connection with aftermarket consumers.
  • In April, 2024, SAIC Motor and Castrol announced a three-year strategic partnership designating Castrol as the preferred lubricants supplier for the MG dealership network across Central and Eastern Europe, including a new co-branded product line.

Dive into Technavio’s robust research methodology, blending expert interviews, extensive data synthesis, and validated models for unparalleled Automotive Engine Oil Market insights. See full methodology.

Market Scope
Page number 368
Base year 2025
Historic period 2020-2024
Forecast period 2026-2030
Growth momentum & CAGR Accelerate at a CAGR of 4%
Market growth 2026-2030 USD 13013.2 million
Market structure Fragmented
YoY growth 2025-2026(%) 3.9%
Key countries China, India, Japan, South Korea, Indonesia, Australia, Germany, UK, France, Italy, Spain, The Netherlands, US, Canada, Mexico, Brazil, Argentina, Chile, Saudi Arabia, UAE, South Africa, Turkey and Israel
Competitive landscape Leading Companies, Market Positioning of Companies, Competitive Strategies, and Industry Risks

Request Free Sample

Research Analyst Overview

  • The automotive engine oil market is defined by a complex technical ecosystem where product formulation is intrinsically linked to regulatory mandates and engine hardware evolution. The industry's pivot toward synthetic base stocks, including polyalphaolefins and hydrocracked group iii oils, is driven by the need to meet stringent fuel economy standards and OEM genuine oil specifications.
  • This necessitates sophisticated additive packages featuring low-saps technology, viscosity index improvers, and pour point depressants. Formulations are engineered for specific outcomes like low speed pre-ignition mitigation, turbocharger bearing protection, and enhanced piston cleanliness performance, all validated against benchmarks like the ILSAC GF-7 standard and API SP classification.
  • For boardroom-level strategy, navigating the landscape of ACEA sequences is crucial for European market access, where achieving exhaust after-treatment compatibility is non-negotiable. For instance, fleets adopting oils with superior shear stability and total base number retention have documented a nearly 4% improvement in fuel efficiency. This highlights how technical choices in anti-wear agents and oxidation inhibitors directly impact operational budgets.
  • The challenge extends to managing kinematic viscosity for both engine downsizing and specialized applications like wet clutch frictional properties in a common sump system, making deep technical expertise a primary competitive differentiator.

What are the Key Data Covered in this Automotive Engine Oil Market Research and Growth Report?

  • What is the expected growth of the Automotive Engine Oil Market between 2026 and 2030?

    • USD 13.01 billion, at a CAGR of 4%

  • What segmentation does the market report cover?

    • The report is segmented by Application (Passenger vehicles, Commercial vehicles, Two wheelers, and Others), Type (Diesel, Petrol, and Alternative fuels), Product Type (Mineral, Synthetic, and Semi-synthetic), Grade Type (5W-30, 0W-20, 10W-40, and Others), Distribution Channel (Aftermarket, and OEM) and Geography (APAC, Europe, North America, South America, Middle East and Africa)

  • Which regions are analyzed in the report?

    • APAC, Europe, North America, South America and Middle East and Africa

  • What are the key growth drivers and market challenges?

    • Sustained expansion of global vehicle parc and increasing vehicle miles traveled, Irreversible proliferation of battery electric vehicles

  • Who are the major players in the Automotive Engine Oil Market?

    • AMSOIL Inc., Bharat Petroleum Corp. Ltd., BP Plc, Chevron Corp., China Petrochemical Corp., ENEOS Corp., Eni SpA, Exxon Mobil Corp., FUCHS SE, Hinduja Group Ltd., Idemitsu Kosan Co. Ltd., Indian Oil Corp. Ltd., MOL Group, MOTUL SA, Petroliam Nasional Berhad, PJSC LUKOIL, Repsol SA, Shell plc, TotalEnergies SE and Valvoline Inc.

Market Research Insights

  • The global automotive engine oil market is defined by a complex interplay of technological evolution and channel disruption. The industry-wide shift toward high performance lubricants, including premium synthetic motor oil, is clear, with adoption rates in some new vehicle segments exceeding 90%. This move is essential for powertrain technology evolution.
  • In the aftermarket, the growth of the professional installer channel is challenged by the empowerment of DIY consumers, where online platforms have driven price transparency, leading to a 5-10% price variance between channels. A key challenge is supply chain volatility, which can impact lubricant raw material sourcing and the operations of a lubricant blending plant.
  • Navigating this environment requires sophisticated strategies that address everything from advanced lubricant formulations and base oil refining to managing brand equity in lubricants. Firms that successfully integrate their approach to both franchised dealership servicing and the diy oil change market can see brand loyalty scores improve by more than 15%.

We can help! Our analysts can customize this automotive engine oil market research report to meet your requirements.

Get in touch

1. Executive Summary

1.1 Market overview

Executive Summary - Chart on Market Overview
Executive Summary - Data Table on Market Overview
Executive Summary - Chart on Global Market Characteristics
Executive Summary - Chart on Market by Geography
Executive Summary - Chart on Market Segmentation by Application
Executive Summary - Chart on Market Segmentation by Type
Executive Summary - Chart on Market Segmentation by Product Type
Executive Summary - Chart on Market Segmentation by Grade Type
Executive Summary - Chart on Market Segmentation by Distribution Channel
Executive Summary - Chart on Incremental Growth
Executive Summary - Data Table on Incremental Growth
Executive Summary - Chart on Company Market Positioning

2. Technavio Analysis

2.1 Analysis of price sensitivity, lifecycle, customer purchase basket, adoption rates, and purchase criteria

2.2 Criticality of inputs and Factors of differentiation

Chart on Overview on criticality of inputs and factors of differentiation

2.3 Factors of disruption

Chart on Overview on factors of disruption

2.4 Impact of drivers and challenges

Chart on Impact of drivers and challenges in 2025 and 2030

3. Market Landscape

3.1 Market ecosystem

Chart on Parent Market
Data Table on - Parent Market

3.2 Market characteristics

Chart on Market characteristics analysis

3.3 Value chain analysis

Chart on Value chain analysis

4. Market Sizing

4.1 Market definition

Data Table on Offerings of companies included in the market definition

4.2 Market segment analysis

Market segments

4.3 Market size 2025

4.4 Market outlook: Forecast for 2025-2030

Chart on Global - Market size and forecast 2025-2030 ($ million)
Data Table on Global - Market size and forecast 2025-2030 ($ million)
Chart on Global Market: Year-over-year growth 2025-2030 (%)
Data Table on Global Market: Year-over-year growth 2025-2030 (%)

5. Historic Market Size

5.1 Global Automotive Engine Oil Market 2020 - 2024

Historic Market Size - Data Table on Global Automotive Engine Oil Market 2020 - 2024 ($ million)

5.2 Application segment analysis 2020 - 2024

Historic Market Size - Application Segment 2020 - 2024 ($ million)

5.3 Type segment analysis 2020 - 2024

Historic Market Size - Type Segment 2020 - 2024 ($ million)

5.4 Product Type segment analysis 2020 - 2024

Historic Market Size - Product Type Segment 2020 - 2024 ($ million)

5.5 Grade Type segment analysis 2020 - 2024

Historic Market Size - Grade Type Segment 2020 - 2024 ($ million)

5.6 Distribution Channel segment analysis 2020 - 2024

Historic Market Size - Distribution Channel Segment 2020 - 2024 ($ million)

5.7 Geography segment analysis 2020 - 2024

Historic Market Size - Geography Segment 2020 - 2024 ($ million)

5.8 Country segment analysis 2020 - 2024

Historic Market Size - Country Segment 2020 - 2024 ($ million)

6. Qualitative Analysis

6.1 The AI impact on global automotive engine oil market

7. Five Forces Analysis

7.1 Five forces summary

Five forces analysis - Comparison between 2025 and 2030

7.2 Bargaining power of buyers

Bargaining power of buyers - Impact of key factors 2025 and 2030

7.3 Bargaining power of suppliers

Bargaining power of suppliers - Impact of key factors in 2025 and 2030

7.4 Threat of new entrants

Threat of new entrants - Impact of key factors in 2025 and 2030

7.5 Threat of substitutes

Threat of substitutes - Impact of key factors in 2025 and 2030

7.6 Threat of rivalry

Threat of rivalry - Impact of key factors in 2025 and 2030

7.7 Market condition

Chart on Market condition - Five forces 2025 and 2030

8. Market Segmentation by Application

8.1 Market segments

Chart on Application - Market share 2025-2030 (%)
Data Table on Application - Market share 2025-2030 (%)

8.2 Comparison by Application

Chart on Comparison by Application
Data Table on Comparison by Application

8.3 Passenger vehicles - Market size and forecast 2025-2030

Chart on Passenger vehicles - Market size and forecast 2025-2030 ($ million)
Data Table on Passenger vehicles - Market size and forecast 2025-2030 ($ million)
Chart on Passenger vehicles - Year-over-year growth 2025-2030 (%)
Data Table on Passenger vehicles - Year-over-year growth 2025-2030 (%)

8.4 Commercial vehicles - Market size and forecast 2025-2030

Chart on Commercial vehicles - Market size and forecast 2025-2030 ($ million)
Data Table on Commercial vehicles - Market size and forecast 2025-2030 ($ million)
Chart on Commercial vehicles - Year-over-year growth 2025-2030 (%)
Data Table on Commercial vehicles - Year-over-year growth 2025-2030 (%)

8.5 Two wheelers - Market size and forecast 2025-2030

Chart on Two wheelers - Market size and forecast 2025-2030 ($ million)
Data Table on Two wheelers - Market size and forecast 2025-2030 ($ million)
Chart on Two wheelers - Year-over-year growth 2025-2030 (%)
Data Table on Two wheelers - Year-over-year growth 2025-2030 (%)

8.6 Others - Market size and forecast 2025-2030

Chart on Others - Market size and forecast 2025-2030 ($ million)
Data Table on Others - Market size and forecast 2025-2030 ($ million)
Chart on Others - Year-over-year growth 2025-2030 (%)
Data Table on Others - Year-over-year growth 2025-2030 (%)

8.7 Market opportunity by Application

Market opportunity by Application ($ million)
Data Table on Market opportunity by Application ($ million)

9. Market Segmentation by Type

9.1 Market segments

Chart on Type - Market share 2025-2030 (%)
Data Table on Type - Market share 2025-2030 (%)

9.2 Comparison by Type

Chart on Comparison by Type
Data Table on Comparison by Type

9.3 Diesel - Market size and forecast 2025-2030

Chart on Diesel - Market size and forecast 2025-2030 ($ million)
Data Table on Diesel - Market size and forecast 2025-2030 ($ million)
Chart on Diesel - Year-over-year growth 2025-2030 (%)
Data Table on Diesel - Year-over-year growth 2025-2030 (%)

9.4 Petrol - Market size and forecast 2025-2030

Chart on Petrol - Market size and forecast 2025-2030 ($ million)
Data Table on Petrol - Market size and forecast 2025-2030 ($ million)
Chart on Petrol - Year-over-year growth 2025-2030 (%)
Data Table on Petrol - Year-over-year growth 2025-2030 (%)

9.5 Alternative fuels - Market size and forecast 2025-2030

Chart on Alternative fuels - Market size and forecast 2025-2030 ($ million)
Data Table on Alternative fuels - Market size and forecast 2025-2030 ($ million)
Chart on Alternative fuels - Year-over-year growth 2025-2030 (%)
Data Table on Alternative fuels - Year-over-year growth 2025-2030 (%)

9.6 Market opportunity by Type

Market opportunity by Type ($ million)
Data Table on Market opportunity by Type ($ million)

10. Market Segmentation by Product Type

10.1 Market segments

Chart on Product Type - Market share 2025-2030 (%)
Data Table on Product Type - Market share 2025-2030 (%)

10.2 Comparison by Product Type

Chart on Comparison by Product Type
Data Table on Comparison by Product Type

10.3 Mineral - Market size and forecast 2025-2030

Chart on Mineral - Market size and forecast 2025-2030 ($ million)
Data Table on Mineral - Market size and forecast 2025-2030 ($ million)
Chart on Mineral - Year-over-year growth 2025-2030 (%)
Data Table on Mineral - Year-over-year growth 2025-2030 (%)

10.4 Synthetic - Market size and forecast 2025-2030

Chart on Synthetic - Market size and forecast 2025-2030 ($ million)
Data Table on Synthetic - Market size and forecast 2025-2030 ($ million)
Chart on Synthetic - Year-over-year growth 2025-2030 (%)
Data Table on Synthetic - Year-over-year growth 2025-2030 (%)

10.5 Semi-synthetic - Market size and forecast 2025-2030

Chart on Semi-synthetic - Market size and forecast 2025-2030 ($ million)
Data Table on Semi-synthetic - Market size and forecast 2025-2030 ($ million)
Chart on Semi-synthetic - Year-over-year growth 2025-2030 (%)
Data Table on Semi-synthetic - Year-over-year growth 2025-2030 (%)

10.6 Market opportunity by Product Type

Market opportunity by Product Type ($ million)
Data Table on Market opportunity by Product Type ($ million)

11. Market Segmentation by Grade Type

11.1 Market segments

Chart on Grade Type - Market share 2025-2030 (%)
Data Table on Grade Type - Market share 2025-2030 (%)

11.2 Comparison by Grade Type

Chart on Comparison by Grade Type
Data Table on Comparison by Grade Type

11.3 5W-30 - Market size and forecast 2025-2030

Chart on 5W-30 - Market size and forecast 2025-2030 ($ million)
Data Table on 5W-30 - Market size and forecast 2025-2030 ($ million)
Chart on 5W-30 - Year-over-year growth 2025-2030 (%)
Data Table on 5W-30 - Year-over-year growth 2025-2030 (%)

11.4 0W-20 - Market size and forecast 2025-2030

Chart on 0W-20 - Market size and forecast 2025-2030 ($ million)
Data Table on 0W-20 - Market size and forecast 2025-2030 ($ million)
Chart on 0W-20 - Year-over-year growth 2025-2030 (%)
Data Table on 0W-20 - Year-over-year growth 2025-2030 (%)

11.5 10W-40 - Market size and forecast 2025-2030

Chart on 10W-40 - Market size and forecast 2025-2030 ($ million)
Data Table on 10W-40 - Market size and forecast 2025-2030 ($ million)
Chart on 10W-40 - Year-over-year growth 2025-2030 (%)
Data Table on 10W-40 - Year-over-year growth 2025-2030 (%)

11.6 Others - Market size and forecast 2025-2030

Chart on Others - Market size and forecast 2025-2030 ($ million)
Data Table on Others - Market size and forecast 2025-2030 ($ million)
Chart on Others - Year-over-year growth 2025-2030 (%)
Data Table on Others - Year-over-year growth 2025-2030 (%)

11.7 Market opportunity by Grade Type

Market opportunity by Grade Type ($ million)
Data Table on Market opportunity by Grade Type ($ million)

12. Market Segmentation by Distribution Channel

12.1 Market segments

Chart on Distribution Channel - Market share 2025-2030 (%)
Data Table on Distribution Channel - Market share 2025-2030 (%)

12.2 Comparison by Distribution Channel

Chart on Comparison by Distribution Channel
Data Table on Comparison by Distribution Channel

12.3 Aftermarket - Market size and forecast 2025-2030

Chart on Aftermarket - Market size and forecast 2025-2030 ($ million)
Data Table on Aftermarket - Market size and forecast 2025-2030 ($ million)
Chart on Aftermarket - Year-over-year growth 2025-2030 (%)
Data Table on Aftermarket - Year-over-year growth 2025-2030 (%)

12.4 OEM - Market size and forecast 2025-2030

Chart on OEM - Market size and forecast 2025-2030 ($ million)
Data Table on OEM - Market size and forecast 2025-2030 ($ million)
Chart on OEM - Year-over-year growth 2025-2030 (%)
Data Table on OEM - Year-over-year growth 2025-2030 (%)

12.5 Market opportunity by Distribution Channel

Market opportunity by Distribution Channel ($ million)
Data Table on Market opportunity by Distribution Channel ($ million)

13. Customer Landscape

13.1 Customer landscape overview

Analysis of price sensitivity, lifecycle, customer purchase basket, adoption rates, and purchase criteria

14. Geographic Landscape

14.1 Geographic segmentation

Chart on Market share by geography 2025-2030 (%)
Data Table on Market share by geography 2025-2030 (%)

14.2 Geographic comparison

Chart on Geographic comparison
Data Table on Geographic comparison

14.3 APAC - Market size and forecast 2025-2030

Chart on APAC - Market size and forecast 2025-2030 ($ million)
Data Table on APAC - Market size and forecast 2025-2030 ($ million)
Chart on APAC - Year-over-year growth 2025-2030 (%)
Data Table on APAC - Year-over-year growth 2025-2030 (%)
Chart on Regional Comparison - APAC
Data Table on Regional Comparison - APAC

14.3.1 China - Market size and forecast 2025-2030

Chart on China - Market size and forecast 2025-2030 ($ million)
Data Table on China - Market size and forecast 2025-2030 ($ million)
Chart on China - Year-over-year growth 2025-2030 (%)
Data Table on China - Year-over-year growth 2025-2030 (%)

14.3.2 India - Market size and forecast 2025-2030

Chart on India - Market size and forecast 2025-2030 ($ million)
Data Table on India - Market size and forecast 2025-2030 ($ million)
Chart on India - Year-over-year growth 2025-2030 (%)
Data Table on India - Year-over-year growth 2025-2030 (%)

14.3.3 Japan - Market size and forecast 2025-2030

Chart on Japan - Market size and forecast 2025-2030 ($ million)
Data Table on Japan - Market size and forecast 2025-2030 ($ million)
Chart on Japan - Year-over-year growth 2025-2030 (%)
Data Table on Japan - Year-over-year growth 2025-2030 (%)

14.3.4 South Korea - Market size and forecast 2025-2030

Chart on South Korea - Market size and forecast 2025-2030 ($ million)
Data Table on South Korea - Market size and forecast 2025-2030 ($ million)
Chart on South Korea - Year-over-year growth 2025-2030 (%)
Data Table on South Korea - Year-over-year growth 2025-2030 (%)

14.3.5 Indonesia - Market size and forecast 2025-2030

Chart on Indonesia - Market size and forecast 2025-2030 ($ million)
Data Table on Indonesia - Market size and forecast 2025-2030 ($ million)
Chart on Indonesia - Year-over-year growth 2025-2030 (%)
Data Table on Indonesia - Year-over-year growth 2025-2030 (%)

14.3.6 Australia - Market size and forecast 2025-2030

Chart on Australia - Market size and forecast 2025-2030 ($ million)
Data Table on Australia - Market size and forecast 2025-2030 ($ million)
Chart on Australia - Year-over-year growth 2025-2030 (%)
Data Table on Australia - Year-over-year growth 2025-2030 (%)

14.4 Europe - Market size and forecast 2025-2030

Chart on Europe - Market size and forecast 2025-2030 ($ million)
Data Table on Europe - Market size and forecast 2025-2030 ($ million)
Chart on Europe - Year-over-year growth 2025-2030 (%)
Data Table on Europe - Year-over-year growth 2025-2030 (%)
Chart on Regional Comparison - Europe
Data Table on Regional Comparison - Europe

14.4.1 Germany - Market size and forecast 2025-2030

Chart on Germany - Market size and forecast 2025-2030 ($ million)
Data Table on Germany - Market size and forecast 2025-2030 ($ million)
Chart on Germany - Year-over-year growth 2025-2030 (%)
Data Table on Germany - Year-over-year growth 2025-2030 (%)

14.4.2 UK - Market size and forecast 2025-2030

Chart on UK - Market size and forecast 2025-2030 ($ million)
Data Table on UK - Market size and forecast 2025-2030 ($ million)
Chart on UK - Year-over-year growth 2025-2030 (%)
Data Table on UK - Year-over-year growth 2025-2030 (%)

14.4.3 France - Market size and forecast 2025-2030

Chart on France - Market size and forecast 2025-2030 ($ million)
Data Table on France - Market size and forecast 2025-2030 ($ million)
Chart on France - Year-over-year growth 2025-2030 (%)
Data Table on France - Year-over-year growth 2025-2030 (%)

14.4.4 Italy - Market size and forecast 2025-2030

Chart on Italy - Market size and forecast 2025-2030 ($ million)
Data Table on Italy - Market size and forecast 2025-2030 ($ million)
Chart on Italy - Year-over-year growth 2025-2030 (%)
Data Table on Italy - Year-over-year growth 2025-2030 (%)

14.4.5 Spain - Market size and forecast 2025-2030

Chart on Spain - Market size and forecast 2025-2030 ($ million)
Data Table on Spain - Market size and forecast 2025-2030 ($ million)
Chart on Spain - Year-over-year growth 2025-2030 (%)
Data Table on Spain - Year-over-year growth 2025-2030 (%)

14.4.6 The Netherlands - Market size and forecast 2025-2030

Chart on The Netherlands - Market size and forecast 2025-2030 ($ million)
Data Table on The Netherlands - Market size and forecast 2025-2030 ($ million)
Chart on The Netherlands - Year-over-year growth 2025-2030 (%)
Data Table on The Netherlands - Year-over-year growth 2025-2030 (%)

14.5 North America - Market size and forecast 2025-2030

Chart on North America - Market size and forecast 2025-2030 ($ million)
Data Table on North America - Market size and forecast 2025-2030 ($ million)
Chart on North America - Year-over-year growth 2025-2030 (%)
Data Table on North America - Year-over-year growth 2025-2030 (%)
Chart on Regional Comparison - North America
Data Table on Regional Comparison - North America

14.5.1 US - Market size and forecast 2025-2030

Chart on US - Market size and forecast 2025-2030 ($ million)
Data Table on US - Market size and forecast 2025-2030 ($ million)
Chart on US - Year-over-year growth 2025-2030 (%)
Data Table on US - Year-over-year growth 2025-2030 (%)

14.5.2 Canada - Market size and forecast 2025-2030

Chart on Canada - Market size and forecast 2025-2030 ($ million)
Data Table on Canada - Market size and forecast 2025-2030 ($ million)
Chart on Canada - Year-over-year growth 2025-2030 (%)
Data Table on Canada - Year-over-year growth 2025-2030 (%)

14.5.3 Mexico - Market size and forecast 2025-2030

Chart on Mexico - Market size and forecast 2025-2030 ($ million)
Data Table on Mexico - Market size and forecast 2025-2030 ($ million)
Chart on Mexico - Year-over-year growth 2025-2030 (%)
Data Table on Mexico - Year-over-year growth 2025-2030 (%)

14.6 South America - Market size and forecast 2025-2030

Chart on South America - Market size and forecast 2025-2030 ($ million)
Data Table on South America - Market size and forecast 2025-2030 ($ million)
Chart on South America - Year-over-year growth 2025-2030 (%)
Data Table on South America - Year-over-year growth 2025-2030 (%)
Chart on Regional Comparison - South America
Data Table on Regional Comparison - South America

14.6.1 Brazil - Market size and forecast 2025-2030

Chart on Brazil - Market size and forecast 2025-2030 ($ million)
Data Table on Brazil - Market size and forecast 2025-2030 ($ million)
Chart on Brazil - Year-over-year growth 2025-2030 (%)
Data Table on Brazil - Year-over-year growth 2025-2030 (%)

14.6.2 Argentina - Market size and forecast 2025-2030

Chart on Argentina - Market size and forecast 2025-2030 ($ million)
Data Table on Argentina - Market size and forecast 2025-2030 ($ million)
Chart on Argentina - Year-over-year growth 2025-2030 (%)
Data Table on Argentina - Year-over-year growth 2025-2030 (%)

14.6.3 Chile - Market size and forecast 2025-2030

Chart on Chile - Market size and forecast 2025-2030 ($ million)
Data Table on Chile - Market size and forecast 2025-2030 ($ million)
Chart on Chile - Year-over-year growth 2025-2030 (%)
Data Table on Chile - Year-over-year growth 2025-2030 (%)

14.7 Middle East and Africa - Market size and forecast 2025-2030

Chart on Middle East and Africa - Market size and forecast 2025-2030 ($ million)
Data Table on Middle East and Africa - Market size and forecast 2025-2030 ($ million)
Chart on Middle East and Africa - Year-over-year growth 2025-2030 (%)
Data Table on Middle East and Africa - Year-over-year growth 2025-2030 (%)
Chart on Regional Comparison - Middle East and Africa
Data Table on Regional Comparison - Middle East and Africa

14.7.1 Saudi Arabia - Market size and forecast 2025-2030

Chart on Saudi Arabia - Market size and forecast 2025-2030 ($ million)
Data Table on Saudi Arabia - Market size and forecast 2025-2030 ($ million)
Chart on Saudi Arabia - Year-over-year growth 2025-2030 (%)
Data Table on Saudi Arabia - Year-over-year growth 2025-2030 (%)

14.7.2 UAE - Market size and forecast 2025-2030

Chart on UAE - Market size and forecast 2025-2030 ($ million)
Data Table on UAE - Market size and forecast 2025-2030 ($ million)
Chart on UAE - Year-over-year growth 2025-2030 (%)
Data Table on UAE - Year-over-year growth 2025-2030 (%)

14.7.3 South Africa - Market size and forecast 2025-2030

Chart on South Africa - Market size and forecast 2025-2030 ($ million)
Data Table on South Africa - Market size and forecast 2025-2030 ($ million)
Chart on South Africa - Year-over-year growth 2025-2030 (%)
Data Table on South Africa - Year-over-year growth 2025-2030 (%)

14.7.4 Turkey - Market size and forecast 2025-2030

Chart on Turkey - Market size and forecast 2025-2030 ($ million)
Data Table on Turkey - Market size and forecast 2025-2030 ($ million)
Chart on Turkey - Year-over-year growth 2025-2030 (%)
Data Table on Turkey - Year-over-year growth 2025-2030 (%)

14.7.5 Israel - Market size and forecast 2025-2030

Chart on Israel - Market size and forecast 2025-2030 ($ million)
Data Table on Israel - Market size and forecast 2025-2030 ($ million)
Chart on Israel - Year-over-year growth 2025-2030 (%)
Data Table on Israel - Year-over-year growth 2025-2030 (%)

14.8 Market opportunity by geography

Market opportunity by geography ($ million)
Data Tables on Market opportunity by geography ($ million)

15. Drivers, Challenges, and Opportunity

15.1 Market drivers

Sustained expansion of global vehicle parc and increasing vehicle miles traveled
Stringent regulatory mandates and consequent evolution in powertrain technology
Heightened end user awareness regarding vehicle maintenance and performance optimization

15.2 Market challenges

Irreversible proliferation of battery electric vehicles
Extreme volatility in raw material costs and supply chain fragility
Evolving aftermarket channels and empowerment of end consumer

15.3 Impact of drivers and challenges

Impact of drivers and challenges in 2025 and 2030

15.4 Market opportunities

Ascendancy of high-performance synthetic and low-viscosity formulations
Emergence of sustainable lubricants: bio-based and re-refined oils
Transformative impact of vehicle electrification

16. Competitive Landscape

16.1 Overview

16.2

Overview on criticality of inputs and factors of differentiation

16.3 Landscape disruption

Overview on factors of disruption

16.4 Industry risks

Impact of key risks on business

17. Competitive Analysis

17.1 Companies profiled

Companies covered

17.2 Company ranking index

17.3 Market positioning of companies

Matrix on companies position and classification

17.4 AMSOIL Inc.

AMSOIL Inc. - Overview
AMSOIL Inc. - Product / Service
AMSOIL Inc. - Key offerings
SWOT

17.5 BP Plc

BP Plc - Overview
BP Plc - Business segments
BP Plc - Key news
BP Plc - Key offerings
BP Plc - Segment focus
SWOT

17.6 Chevron Corp.

Chevron Corp. - Overview
Chevron Corp. - Business segments
Chevron Corp. - Key news
Chevron Corp. - Key offerings
Chevron Corp. - Segment focus
SWOT

17.7 China Petrochemical Corp.

China Petrochemical Corp. - Overview
China Petrochemical Corp. - Business segments
China Petrochemical Corp. - Key offerings
China Petrochemical Corp. - Segment focus
SWOT

17.8 ENEOS Corp.

ENEOS Corp. - Overview
ENEOS Corp. - Business segments
ENEOS Corp. - Key news
ENEOS Corp. - Key offerings
ENEOS Corp. - Segment focus
SWOT

17.9 Eni SpA

Eni SpA - Overview
Eni SpA - Business segments
Eni SpA - Key news
Eni SpA - Key offerings
Eni SpA - Segment focus
SWOT

17.10 Exxon Mobil Corp.

Exxon Mobil Corp. - Overview
Exxon Mobil Corp. - Business segments
Exxon Mobil Corp. - Key news
Exxon Mobil Corp. - Key offerings
Exxon Mobil Corp. - Segment focus
SWOT

17.11 FUCHS SE

FUCHS SE - Overview
FUCHS SE - Business segments
FUCHS SE - Key news
FUCHS SE - Key offerings
FUCHS SE - Segment focus
SWOT

17.12 MOTUL SA

MOTUL SA - Overview
MOTUL SA - Product / Service
MOTUL SA - Key offerings
SWOT

17.13 Petroliam Nasional Berhad

Petroliam Nasional Berhad - Overview
Petroliam Nasional Berhad - Business segments
Petroliam Nasional Berhad - Key offerings
Petroliam Nasional Berhad - Segment focus
SWOT

17.14 PJSC LUKOIL

PJSC LUKOIL - Overview
PJSC LUKOIL - Product / Service
PJSC LUKOIL - Key offerings
SWOT

17.15 Repsol SA

Repsol SA - Overview
Repsol SA - Business segments
Repsol SA - Key news
Repsol SA - Key offerings
Repsol SA - Segment focus
SWOT

17.16 Shell plc

Shell plc - Overview
Shell plc - Business segments
Shell plc - Key news
Shell plc - Key offerings
Shell plc - Segment focus
SWOT

17.17 TotalEnergies SE

TotalEnergies SE - Overview
TotalEnergies SE - Business segments
TotalEnergies SE - Key news
TotalEnergies SE - Key offerings
TotalEnergies SE - Segment focus
SWOT

17.18 Valvoline Inc.

Valvoline Inc. - Overview
Valvoline Inc. - Product / Service
Valvoline Inc. - Key news
Valvoline Inc. - Key offerings
SWOT

18. Appendix

18.1 Scope of the report

Market definition
Objectives
Notes and caveats

18.2 Inclusions and exclusions checklist

Inclusions checklist
Exclusions checklist

18.3 Currency conversion rates for US$

18.4 Research methodology

18.5 Data procurement

Information sources

18.6 Data validation

18.7 Validation techniques employed for market sizing

18.8 Data synthesis

18.9 360 degree market analysis

18.10 List of abbreviations

Research Methodology

Technavio presents a detailed picture of the market by way of study, synthesis, and summation of data from multiple sources. The analysts have presented the various facets of the market with a particular focus on identifying the key industry influencers. The data thus presented is comprehensive, reliable, and the result of extensive research, both primary and secondary.

INFORMATION SOURCES

Primary sources

  • Manufacturers and suppliers
  • Channel partners
  • Industry experts
  • Strategic decision makers

Secondary sources

  • Industry journals and periodicals
  • Government data
  • Financial reports of key industry players
  • Historical data
  • Press releases

DATA ANALYSIS

Data Synthesis

  • Collation of data
  • Estimation of key figures
  • Analysis of derived insights

Data Validation

  • Triangulation with data models
  • Reference against proprietary databases
  • Corroboration with industry experts

REPORT WRITING

Qualitative

  • Market drivers
  • Market challenges
  • Market trends
  • Five forces analysis

Quantitative

  • Market size and forecast
  • Market segmentation
  • Geographical insights
  • Competitive landscape

Interested in this report?

Get your sample now to see our research methodology and insights!

Download Now

Frequently Asked Questions

Automotive Engine Oil market growth will increase by USD 13013.2 million during 2026-2030.

The Automotive Engine Oil market is expected to grow at a CAGR of 4% during 2026-2030.

Automotive Engine Oil market is segmented by Application (Passenger vehicles, Commercial vehicles, Two wheelers, Others) Type (Diesel, Petrol, Alternative fuels) Product type (Mineral, Synthetic, Semi-synthetic) Grade type (5W-30, 0W-20, 10W-40, Others) Distribution channel (Aftermarket, OEM)

AMSOIL Inc., Bharat Petroleum Corp. Ltd., BP Plc, Chevron Corp., China Petrochemical Corp., ENEOS Corp., Eni SpA, Exxon Mobil Corp., FUCHS SE, Hinduja Group Ltd., Idemitsu Kosan Co. Ltd., Indian Oil Corp. Ltd., MOL Group, MOTUL SA, Petroliam Nasional Berhad, PJSC LUKOIL, Repsol SA, Shell plc, TotalEnergies SE, Valvoline Inc. are a few of the key vendors in the Automotive Engine Oil market.

APAC will register the highest growth rate of 45.6% among the other regions. Therefore, the Automotive Engine Oil market in APAC is expected to garner significant business opportunities for the vendors during the forecast period.

China, India, Japan, South Korea, Indonesia, Australia, Germany, UK, France, Italy, Spain, The Netherlands, US, Canada, Mexico, Brazil, Argentina, Chile, Saudi Arabia, UAE, South Africa, Turkey, Israel

  • Sustained expansion of global vehicle parc and increasing vehicle miles traveled is the driving factor this market.

The Automotive Engine Oil market vendors should focus on grabbing business opportunities from the Application segment as it accounted for the largest market share in the base year.