Automotive Prognostics Market Analysis, Size, and Forecast 2026-2030: North America (US, Canada, and Mexico), Europe (Germany, France, and UK), APAC (China, Japan, and India), South America (Brazil and Argentina), Middle East and Africa (Saudi Arabia, UAE, and South Africa), and Rest of World (ROW)

Automotive Prognostics Market Analysis, Size, and Forecast 2026-2030:
North America (US, Canada, and Mexico), Europe (Germany, France, and UK), APAC (China, Japan, and India), South America (Brazil and Argentina), Middle East and Africa (Saudi Arabia, UAE, and South Africa), and Rest of World (ROW)

Published: Mar 2026 292 Pages SKU: IRTNTR40567

Market Overview at a Glance

$16.70 B
Market Opportunity
30.9%
CAGR 2025 - 2030
41.6%
North America Growth
$3.34 B
Passenger cars segment 2024

Automotive Prognostics Market Size 2026-2030

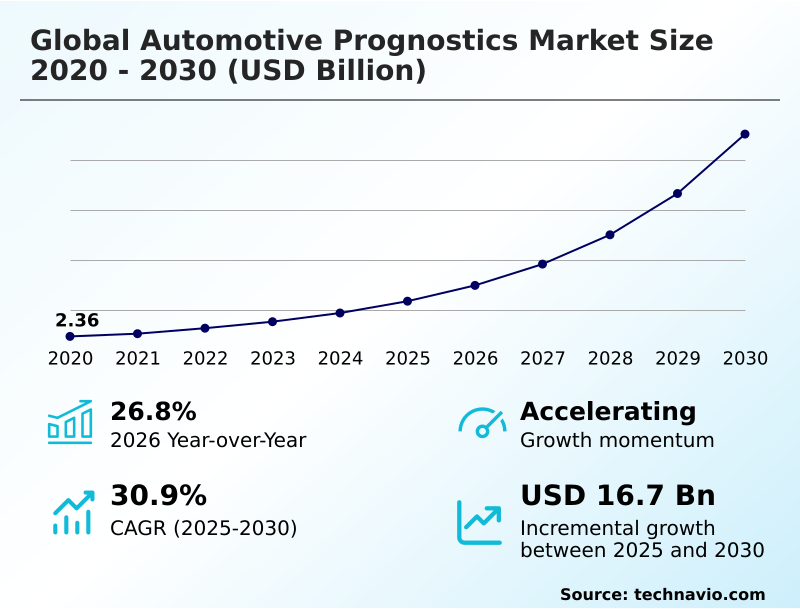
The automotive prognostics market size is valued to increase by USD 16.70 billion, at a CAGR of 30.9% from 2025 to 2030. Increasing vehicle complexity and proliferation of connected technologies will drive the automotive prognostics market.

Major Market Trends & Insights

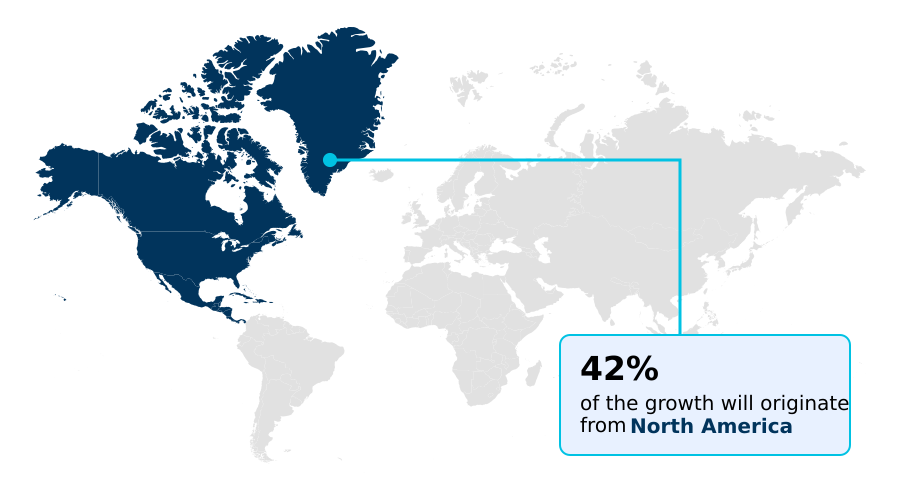
  • North America dominated the market and accounted for a 41.6% growth during the forecast period.
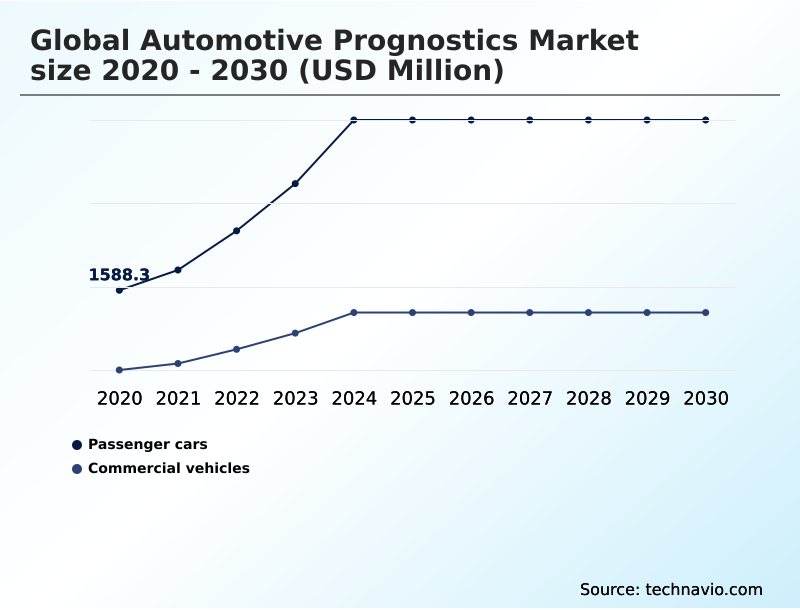
  • By Application - Passenger cars segment was valued at USD 3.34 billion in 2024
  • By End-user - Aftermarket segment accounted for the largest market revenue share in 2024

Market Size & Forecast

  • Market Opportunities: USD 20.23 billion
  • Market Future Opportunities: USD 16.70 billion
  • CAGR from 2025 to 2030 : 30.9%

Market Summary

  • The automotive prognostics market is fundamentally reshaping vehicle lifecycle management. This evolution is driven by the escalating complexity of modern vehicles and the convergence of advanced analytics, AI, and IoT, which enable a proactive shift from reactive repairs to predictive maintenance.
  • A key trend is the integration of machine learning for enhanced predictive accuracy, allowing systems to forecast component failures with unprecedented precision. This capability is crucial for managing the total cost of ownership, a primary concern for commercial fleet operators who leverage prognostics-as-a-service to minimize costly, unscheduled downtime.
  • For instance, a logistics company can use drivetrain predictive analytics and brake wear prediction to schedule maintenance across its fleet, optimizing vehicle availability and ensuring delivery timelines. However, the industry faces challenges related to data privacy and security, the high costs of implementation, and a lack of standardization, which can hinder the interoperability of systems from different vendors.
  • As vehicles become increasingly software-defined, addressing these issues while leveraging technologies like digital twin technology will be critical for realizing the full potential of holistic vehicle health management. The use of onboard diagnostic (OBD-II) systems in the aftermarket also expands these capabilities to older vehicles.

What will be the Size of the Automotive Prognostics Market during the forecast period?

Get Key Insights on Market Forecast (PDF) Request Free Sample

How is the Automotive Prognostics Market Segmented?

The automotive prognostics industry research report provides comprehensive data (region-wise segment analysis), with forecasts and estimates in "USD million" for the period 2026-2030, as well as historical data from 2020-2024 for the following segments.

  • Application
    • Passenger cars
    • Commercial vehicles
  • End-user
    • Aftermarket
    • OEMs
  • Component
    • Hardware
    • Software
    • Services
  • Geography
    • North America
      • US
      • Canada
      • Mexico
    • Europe
      • Germany
      • France
      • UK
    • APAC
      • China
      • Japan
      • India
    • South America
      • Brazil
      • Argentina
    • Middle East and Africa
      • Saudi Arabia
      • UAE
      • South Africa
    • Rest of World (ROW)

By Application Insights

The passenger cars segment is estimated to witness significant growth during the forecast period.

The passenger car segment is undergoing a significant transformation, driven by the integration of connected car technologies and growing consumer demand for improved vehicle reliability.

OEMs are embedding sophisticated systems that leverage vehicle sensor data analytics to facilitate a shift from reactive repairs to proactive maintenance.

The implementation of predictive analytics is central to this evolution, enabling real-time vehicle health monitoring and accurate component degradation modeling. For electric vehicles, this includes critical state-of-health (SOH) monitoring for high-voltage batteries, a key factor in owner confidence.

The move toward software-defined vehicle (SDV) architectures and the use of digital twin technology further supports these capabilities, with select platforms now achieving over 90% accuracy in powertrain failure prediction, significantly reducing unexpected breakdowns and enhancing warranty cost reduction.

This focus on enhanced predictive accuracy is redefining vehicle ownership.

Request Free Sample

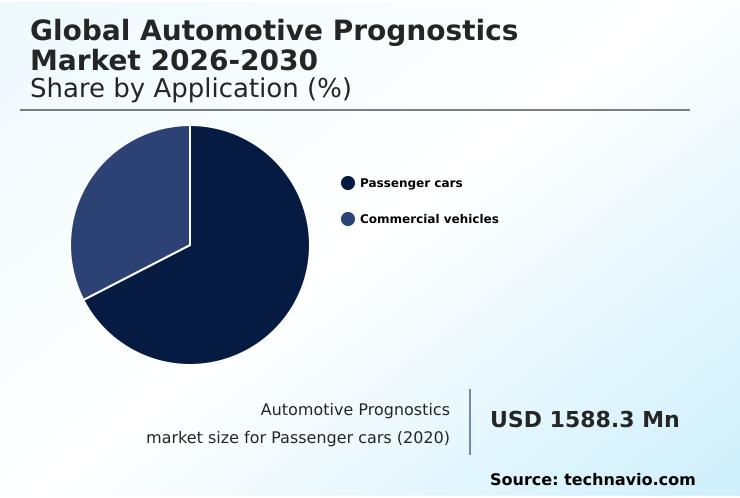
The Passenger cars segment was valued at USD 3.34 billion in 2024 and showed a gradual increase during the forecast period.

Request Free Sample

Regional Analysis

North America is estimated to contribute 41.6% to the growth of the global market during the forecast period.Technavio’s analysts have elaborately explained the regional trends and drivers that shape the market during the forecast period.

See How Automotive Prognostics Market Demand is Rising in North America Request Free Sample

The geographic landscape of the automotive prognostics market is diverse, with distinct regional dynamics.

North America is set to contribute over 41% of the market's incremental growth, driven by a mature commercial fleet sector focused on fleet management optimization and the high adoption of connected car service monetization.

Europe, with a growth rate over 31%, leads in regulatory-driven adoption, particularly for predictive analytics for EVs due to stringent emissions targets.

However, APAC is projected to be the fastest-growing region at over 31.5%, fueled by massive vehicle production and government mandates for real-time vehicle health monitoring in new energy vehicles.

This regional variance underscores different priorities, from OEM-integrated prognostics in Europe to scalable cloud-based analytics platforms in APAC's high-volume markets, shaping global strategies for digital service records and proprietary data access challenges.

Market Dynamics

Our researchers analyzed the data with 2025 as the base year, along with the key drivers, trends, and challenges. A holistic analysis of drivers will help companies refine their marketing strategies to gain a competitive advantage.

  • The advancement of the automotive prognostics market is increasingly defined by specialized applications and sophisticated technological integrations. The use of machine learning models for EV battery degradation is becoming a critical differentiator for electric vehicle manufacturers, directly addressing consumer concerns about battery longevity and replacement costs.
  • For commercial applications, predictive maintenance for commercial vehicle fleets is a primary focus, where the goal is to achieve near-zero unplanned downtime. This is accomplished through systems that provide real-time remaining useful life prediction for critical components. The growing connectivity of vehicles also necessitates robust cybersecurity measures for automotive telematics to protect against data breaches and manipulation.
  • A key enabler of this progress is the use of OTA updates for prognostic algorithm enhancement, allowing for continuous improvement without physical recalls. For example, fleets that implement condition-based maintenance for powertrain systems have reported operational efficiency gains that are twice as effective as those relying on traditional scheduled maintenance.
  • Furthermore, the development of digital twin simulation for vehicle testing accelerates the validation of these complex algorithms. Addressing challenges such as data standardization for interoperable prognostic systems is crucial for the industry to move forward. The impact of SDV architecture on prognostics is profound, enabling more centralized and powerful analytical capabilities.
  • Ultimately, the successful deployment of AI for reducing unscheduled vehicle downtime is the key metric for success, demonstrating a clear ROI analysis of predictive maintenance implementation for stakeholders across the ecosystem, including those focused on integrating prognostics with fleet management software.

What are the key market drivers leading to the rise in the adoption of Automotive Prognostics Industry?

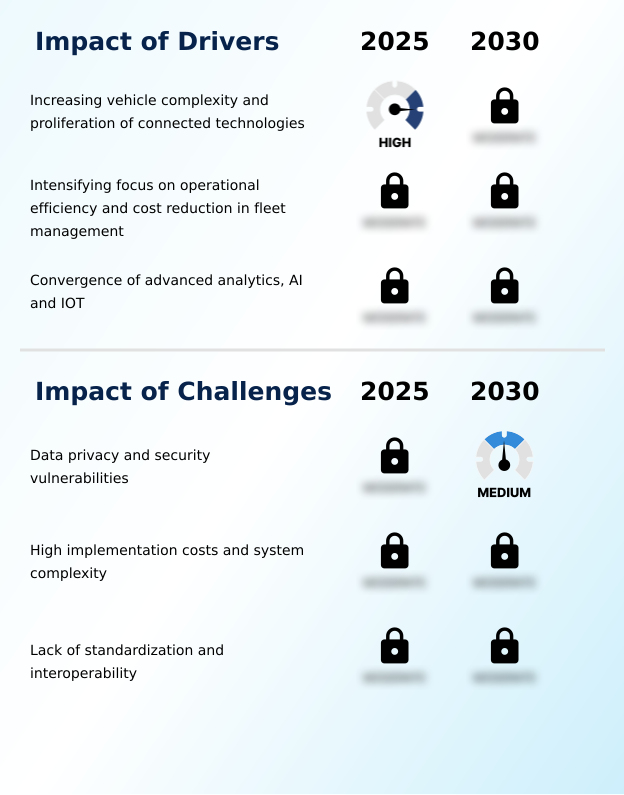
  • The increasing complexity of modern vehicles, combined with the proliferation of connected technologies, serves as a key driver for the market's growth.

  • Increasing vehicle complexity, featuring intricate electronic control unit (ECU) monitoring and advanced driver-assistance systems (ADAS), is a primary driver. This complexity renders traditional maintenance inadequate, creating demand for proactive condition-based maintenance.
  • For commercial fleets, the focus on operational efficiency improvement and total cost of ownership reduction is paramount. One pilot program using a predictive maintenance platform reported a 20% reduction in unscheduled downtime, demonstrating clear predictive maintenance ROI.
  • The convergence of AI and IoT provides the technological backbone, with vehicle sensor data analytics and failure pattern recognition transforming raw data into actionable insights for proactive maintenance scheduling.
  • This synergy is enabling a new generation of highly accurate solutions like vehicle-to-everything (V2X) communication that maximize asset uptime maximization and operational performance.

What are the market trends shaping the Automotive Prognostics Industry?

  • The integration of machine learning to enhance predictive accuracy is a prominent upcoming market trend. This is expected to significantly improve the reliability of vehicle maintenance forecasts.

  • The market is being reshaped by the integration of machine learning algorithms for enhanced predictive accuracy. The rise of the software-defined vehicle (SDV) is transformative, enabling the continuous deployment of prognostic algorithm refinement through over-the-air (OTA) updates. This creates a dynamic ecosystem where predictive maintenance software evolves over the vehicle's lifecycle.
  • A key application is EV battery lifecycle management, where one manufacturer's mandatory OTA update improved EV battery degradation analysis. For commercial fleets, solutions incorporating AI-powered diagnostic tools now achieve over 90% accuracy in powertrain failure prediction.
  • This move towards holistic vehicle health management and subscription-based service models is a defining trend, but it also elevates the importance of cybersecurity for connected vehicles to protect sensitive data streams and ensure system integrity through secure OTA update protocols.

What challenges does the Automotive Prognostics Industry face during its growth?

  • Persistent data privacy concerns and security vulnerabilities present a significant challenge to the growth of the automotive prognostics industry.

  • Significant challenges temper market growth, including concerns over data privacy and security. The vast data collected for real-time fault detection and after-treatment system monitoring creates vulnerabilities, leading to stricter regulations and higher telematics service costs. High implementation costs and system complexity and integration are also barriers, with a notable increase in software-related vehicle recalls adding to financial strain.
  • While effective prognostics can mitigate issues like unplanned downtime, which can cost automotive plants up to USD 2.3 million per hour, the initial investment is substantial. Furthermore, the lack of standardization and interoperability across proprietary systems and the need for UNECE WP.29 compliance hinders the development of universal aftermarket prognostic solutions.
  • This fragmentation complicates telematics data integration and limits the effectiveness of multi-brand fleet prognostics.

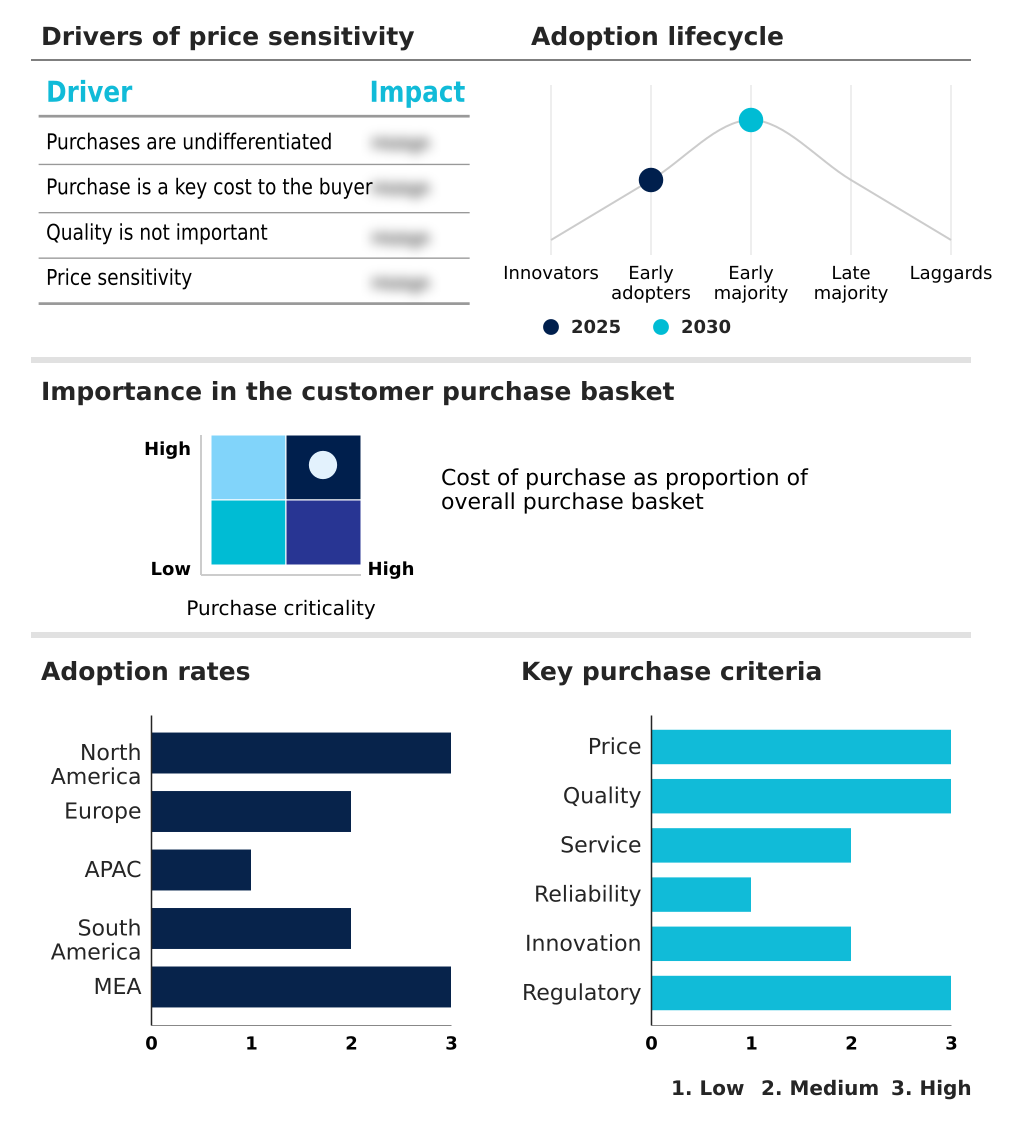
Exclusive Technavio Analysis on Customer Landscape

The automotive prognostics market forecasting report includes the adoption lifecycle of the market, covering from the innovator’s stage to the laggard’s stage. It focuses on adoption rates in different regions based on penetration. Furthermore, the automotive prognostics market report also includes key purchase criteria and drivers of price sensitivity to help companies evaluate and develop their market growth analysis strategies.

Customer Landscape of Automotive Prognostics Industry

Competitive Landscape

Companies are implementing various strategies, such as strategic alliances, automotive prognostics market forecast, partnerships, mergers and acquisitions, geographical expansion, and product/service launches, to enhance their presence in the industry.

ANSYS Inc. - Provides simulation and predictive modeling solutions delivering critical insights into vehicle reliability and performance, enabling data-driven predictive maintenance strategies.

The industry research and growth report includes detailed analyses of the competitive landscape of the market and information about key companies, including:

  • ANSYS Inc.
  • Broadcom Inc.
  • Cloudera Inc.
  • Continental AG
  • Dell Technologies Inc.
  • Digital Management LLC
  • Garrett Motion Inc.
  • IBM Corp.
  • Magna International Inc.
  • Open Text Corp.
  • Pioneer Corp.
  • Predii Inc.
  • Preteckt Inc.
  • Progress Software Corp.
  • Ridgetop Group Inc.
  • Robert Bosch GmbH
  • Samsung Electronics Co. Ltd.
  • Solera Holdings LLC

Qualitative and quantitative analysis of companies has been conducted to help clients understand the wider business environment as well as the strengths and weaknesses of key industry players. Data is qualitatively analyzed to categorize companies as pure play, category-focused, industry-focused, and diversified; it is quantitatively analyzed to categorize companies as dominant, leading, strong, tentative, and weak.

Recent Development and News in Automotive prognostics market

  • In August 2025, Geotab announced the launch of its Prognostics for All platform, utilizing AI and machine learning to provide remaining useful life estimates for critical components across various vehicle models, targeting mixed-brand commercial fleets.
  • In October 2025, the European Union Data Act came into full effect, setting new requirements for data sharing, accessibility, and security for connected devices, including vehicles, empowering owners with more data control.
  • In January 2025, Volkswagen experienced a significant data breach that exposed the sensitive location and personal data of 800,000 electric car owners due to a misconfigured cloud database, highlighting cybersecurity vulnerabilities.
  • In March 2025, Hella Gutmann Solutions announced it would take over and develop an advanced version of the Battery Quick Check tool, designed for the independent assessment of high-voltage battery health in electric vehicles.

Dive into Technavio’s robust research methodology, blending expert interviews, extensive data synthesis, and validated models for unparalleled Automotive Prognostics Market insights. See full methodology.

Market Scope
Page number 292
Base year 2025
Historic period 2020-2024
Forecast period 2026-2030
Growth momentum & CAGR Accelerate at a CAGR of 30.9%
Market growth 2026-2030 USD 16701.8 million
Market structure Fragmented
YoY growth 2025-2026(%) 26.8%
Key countries US, Canada, Mexico, Germany, France, UK, Italy, Spain, The Netherlands, China, Japan, India, South Korea, Australia, Indonesia, Brazil, Argentina, Chile, Saudi Arabia, UAE, South Africa, Turkey and Israel
Competitive landscape Leading Companies, Market Positioning of Companies, Competitive Strategies, and Industry Risks

Request Free Sample

Research Analyst Overview

  • The automotive prognostics market is driven by the need to manage increasingly complex vehicle systems. Core to this is the predictive maintenance platform, which leverages vehicle sensor data analytics and machine learning algorithms to provide remaining useful life estimation for critical components.
  • The shift toward the software-defined vehicle (SDV) enables continuous improvement via over-the-air (OTA) updates, making prognostic algorithm refinement a standard practice. This has direct implications for boardroom decisions regarding warranty reserves and service revenue strategies. For instance, the deployment of predictive failure analysis has enabled some OEMs to reduce warranty claim costs by up to 15% through proactive intervention.
  • Technologies like digital twin technology and deep learning models for prognostics enhance the accuracy of state-of-health (SOH) monitoring, especially for EV battery lifecycle management. The ability to perform remote diagnostic services and implement proactive maintenance scheduling not only reduces unscheduled downtime but also opens new avenues for vehicle data monetization through prognostics-as-a-service (PaaS) models, fundamentally changing the automotive service landscape.
  • This involves telematics data integration from onboard diagnostic (OBD-II) systems and requires robust cybersecurity for connected vehicles.

What are the Key Data Covered in this Automotive Prognostics Market Research and Growth Report?

  • What is the expected growth of the Automotive Prognostics Market between 2026 and 2030?

    • USD 16.70 billion, at a CAGR of 30.9%

  • What segmentation does the market report cover?

    • The report is segmented by Application (Passenger cars, and Commercial vehicles), End-user (Aftermarket, and OEMs), Component (Hardware, Software, and Services) and Geography (North America, Europe, APAC, South America, Middle East and Africa)

  • Which regions are analyzed in the report?

    • North America, Europe, APAC, South America and Middle East and Africa

  • What are the key growth drivers and market challenges?

    • Increasing vehicle complexity and proliferation of connected technologies, Data privacy and security vulnerabilities

  • Who are the major players in the Automotive Prognostics Market?

    • ANSYS Inc., Broadcom Inc., Cloudera Inc., Continental AG, Dell Technologies Inc., Digital Management LLC, Garrett Motion Inc., IBM Corp., Magna International Inc., Open Text Corp., Pioneer Corp., Predii Inc., Preteckt Inc., Progress Software Corp., Ridgetop Group Inc., Robert Bosch GmbH, Samsung Electronics Co. Ltd. and Solera Holdings LLC

Market Research Insights

  • Market dynamics are shaped by a push for operational efficiency improvement and total cost of ownership reduction. Fleet operators implementing data-driven maintenance decisions have reported up to a 20% improvement in asset uptime maximization. The convergence of AI and IoT is pivotal, enabling high-fidelity data collection for sophisticated analytics.
  • However, proprietary data access challenges remain a significant hurdle, limiting the potential of aftermarket prognostic solutions. While OEM-integrated prognostics offer deep integration, the debate around right-to-repair legislation impact is intensifying. The effectiveness of these systems is clear, with some platforms demonstrating a predictive maintenance ROI by reducing certain repair costs by over 30%.
  • This transition towards subscription-based service models is fundamentally altering the relationship between manufacturers and consumers, emphasizing continuous vehicle lifecycle management.

We can help! Our analysts can customize this automotive prognostics market research report to meet your requirements.

Get in touch

1. Executive Summary

1.1 Market overview

Executive Summary - Chart on Market Overview
Executive Summary - Data Table on Market Overview
Executive Summary - Chart on Global Market Characteristics
Executive Summary - Chart on Market by Geography
Executive Summary - Chart on Market Segmentation by Application
Executive Summary - Chart on Market Segmentation by End-user
Executive Summary - Chart on Market Segmentation by Component
Executive Summary - Chart on Incremental Growth
Executive Summary - Data Table on Incremental Growth
Executive Summary - Chart on Company Market Positioning

2. Technavio Analysis

2.1 Analysis of price sensitivity, lifecycle, customer purchase basket, adoption rates, and purchase criteria

2.2 Criticality of inputs and Factors of differentiation

Chart on Overview on criticality of inputs and factors of differentiation

2.3 Factors of disruption

Chart on Overview on factors of disruption

2.4 Impact of drivers and challenges

Chart on Impact of drivers and challenges in 2025 and 2030

3. Market Landscape

3.1 Market ecosystem

Chart on Parent Market
Data Table on - Parent Market

3.2 Market characteristics

Chart on Market characteristics analysis

3.3 Value chain analysis

Chart on Value chain analysis

4. Market Sizing

4.1 Market definition

Data Table on Offerings of companies included in the market definition

4.2 Market segment analysis

Market segments

4.3 Market size 2025

4.4 Market outlook: Forecast for 2025-2030

Chart on Global - Market size and forecast 2025-2030 ($ million)
Data Table on Global - Market size and forecast 2025-2030 ($ million)
Chart on Global Market: Year-over-year growth 2025-2030 (%)
Data Table on Global Market: Year-over-year growth 2025-2030 (%)

5. Historic Market Size

5.1 Global Automotive Prognostics Market 2020 - 2024

Historic Market Size - Data Table on Global Automotive Prognostics Market 2020 - 2024 ($ million)

5.2 Application segment analysis 2020 - 2024

Historic Market Size - Application Segment 2020 - 2024 ($ million)

5.3 End-user segment analysis 2020 - 2024

Historic Market Size - End-user Segment 2020 - 2024 ($ million)

5.4 Component segment analysis 2020 - 2024

Historic Market Size - Component Segment 2020 - 2024 ($ million)

5.5 Geography segment analysis 2020 - 2024

Historic Market Size - Geography Segment 2020 - 2024 ($ million)

5.6 Country segment analysis 2020 - 2024

Historic Market Size - Country Segment 2020 - 2024 ($ million)

6. Qualitative Analysis

6.1 Impact of AI in global automotive prognostics market

7. Five Forces Analysis

7.1 Five forces summary

Five forces analysis - Comparison between 2025 and 2030

7.2 Bargaining power of buyers

Bargaining power of buyers - Impact of key factors 2025 and 2030

7.3 Bargaining power of suppliers

Bargaining power of suppliers - Impact of key factors in 2025 and 2030

7.4 Threat of new entrants

Threat of new entrants - Impact of key factors in 2025 and 2030

7.5 Threat of substitutes

Threat of substitutes - Impact of key factors in 2025 and 2030

7.6 Threat of rivalry

Threat of rivalry - Impact of key factors in 2025 and 2030

7.7 Market condition

Chart on Market condition - Five forces 2025 and 2030

8. Market Segmentation by Application

8.1 Market segments

Chart on Application - Market share 2025-2030 (%)
Data Table on Application - Market share 2025-2030 (%)

8.2 Comparison by Application

Chart on Comparison by Application
Data Table on Comparison by Application

8.3 Passenger cars - Market size and forecast 2025-2030

Chart on Passenger cars - Market size and forecast 2025-2030 ($ million)
Data Table on Passenger cars - Market size and forecast 2025-2030 ($ million)
Chart on Passenger cars - Year-over-year growth 2025-2030 (%)
Data Table on Passenger cars - Year-over-year growth 2025-2030 (%)

8.4 Commercial vehicles - Market size and forecast 2025-2030

Chart on Commercial vehicles - Market size and forecast 2025-2030 ($ million)
Data Table on Commercial vehicles - Market size and forecast 2025-2030 ($ million)
Chart on Commercial vehicles - Year-over-year growth 2025-2030 (%)
Data Table on Commercial vehicles - Year-over-year growth 2025-2030 (%)

8.5 Market opportunity by Application

Market opportunity by Application ($ million)
Data Table on Market opportunity by Application ($ million)

9. Market Segmentation by End-user

9.1 Market segments

Chart on End-user - Market share 2025-2030 (%)
Data Table on End-user - Market share 2025-2030 (%)

9.2 Comparison by End-user

Chart on Comparison by End-user
Data Table on Comparison by End-user

9.3 Aftermarket - Market size and forecast 2025-2030

Chart on Aftermarket - Market size and forecast 2025-2030 ($ million)
Data Table on Aftermarket - Market size and forecast 2025-2030 ($ million)
Chart on Aftermarket - Year-over-year growth 2025-2030 (%)
Data Table on Aftermarket - Year-over-year growth 2025-2030 (%)

9.4 OEMs - Market size and forecast 2025-2030

Chart on OEMs - Market size and forecast 2025-2030 ($ million)
Data Table on OEMs - Market size and forecast 2025-2030 ($ million)
Chart on OEMs - Year-over-year growth 2025-2030 (%)
Data Table on OEMs - Year-over-year growth 2025-2030 (%)

9.5 Market opportunity by End-user

Market opportunity by End-user ($ million)
Data Table on Market opportunity by End-user ($ million)

10. Market Segmentation by Component

10.1 Market segments

Chart on Component - Market share 2025-2030 (%)
Data Table on Component - Market share 2025-2030 (%)

10.2 Comparison by Component

Chart on Comparison by Component
Data Table on Comparison by Component

10.3 Hardware - Market size and forecast 2025-2030

Chart on Hardware - Market size and forecast 2025-2030 ($ million)
Data Table on Hardware - Market size and forecast 2025-2030 ($ million)
Chart on Hardware - Year-over-year growth 2025-2030 (%)
Data Table on Hardware - Year-over-year growth 2025-2030 (%)

10.4 Software - Market size and forecast 2025-2030

Chart on Software - Market size and forecast 2025-2030 ($ million)
Data Table on Software - Market size and forecast 2025-2030 ($ million)
Chart on Software - Year-over-year growth 2025-2030 (%)
Data Table on Software - Year-over-year growth 2025-2030 (%)

10.5 Services - Market size and forecast 2025-2030

Chart on Services - Market size and forecast 2025-2030 ($ million)
Data Table on Services - Market size and forecast 2025-2030 ($ million)
Chart on Services - Year-over-year growth 2025-2030 (%)
Data Table on Services - Year-over-year growth 2025-2030 (%)

10.6 Market opportunity by Component

Market opportunity by Component ($ million)
Data Table on Market opportunity by Component ($ million)

11. Customer Landscape

11.1 Customer landscape overview

Analysis of price sensitivity, lifecycle, customer purchase basket, adoption rates, and purchase criteria

12. Geographic Landscape

12.1 Geographic segmentation

Chart on Market share by geography 2025-2030 (%)
Data Table on Market share by geography 2025-2030 (%)

12.2 Geographic comparison

Chart on Geographic comparison
Data Table on Geographic comparison

12.3 North America - Market size and forecast 2025-2030

Chart on North America - Market size and forecast 2025-2030 ($ million)
Data Table on North America - Market size and forecast 2025-2030 ($ million)
Chart on North America - Year-over-year growth 2025-2030 (%)
Data Table on North America - Year-over-year growth 2025-2030 (%)
Chart on Regional Comparison - North America
Data Table on Regional Comparison - North America

12.3.1 US - Market size and forecast 2025-2030

Chart on US - Market size and forecast 2025-2030 ($ million)
Data Table on US - Market size and forecast 2025-2030 ($ million)
Chart on US - Year-over-year growth 2025-2030 (%)
Data Table on US - Year-over-year growth 2025-2030 (%)

12.3.2 Canada - Market size and forecast 2025-2030

Chart on Canada - Market size and forecast 2025-2030 ($ million)
Data Table on Canada - Market size and forecast 2025-2030 ($ million)
Chart on Canada - Year-over-year growth 2025-2030 (%)
Data Table on Canada - Year-over-year growth 2025-2030 (%)

12.3.3 Mexico - Market size and forecast 2025-2030

Chart on Mexico - Market size and forecast 2025-2030 ($ million)
Data Table on Mexico - Market size and forecast 2025-2030 ($ million)
Chart on Mexico - Year-over-year growth 2025-2030 (%)
Data Table on Mexico - Year-over-year growth 2025-2030 (%)

12.4 Europe - Market size and forecast 2025-2030

Chart on Europe - Market size and forecast 2025-2030 ($ million)
Data Table on Europe - Market size and forecast 2025-2030 ($ million)
Chart on Europe - Year-over-year growth 2025-2030 (%)
Data Table on Europe - Year-over-year growth 2025-2030 (%)
Chart on Regional Comparison - Europe
Data Table on Regional Comparison - Europe

12.4.1 Germany - Market size and forecast 2025-2030

Chart on Germany - Market size and forecast 2025-2030 ($ million)
Data Table on Germany - Market size and forecast 2025-2030 ($ million)
Chart on Germany - Year-over-year growth 2025-2030 (%)
Data Table on Germany - Year-over-year growth 2025-2030 (%)

12.4.2 France - Market size and forecast 2025-2030

Chart on France - Market size and forecast 2025-2030 ($ million)
Data Table on France - Market size and forecast 2025-2030 ($ million)
Chart on France - Year-over-year growth 2025-2030 (%)
Data Table on France - Year-over-year growth 2025-2030 (%)

12.4.3 UK - Market size and forecast 2025-2030

Chart on UK - Market size and forecast 2025-2030 ($ million)
Data Table on UK - Market size and forecast 2025-2030 ($ million)
Chart on UK - Year-over-year growth 2025-2030 (%)
Data Table on UK - Year-over-year growth 2025-2030 (%)

12.4.4 Italy - Market size and forecast 2025-2030

Chart on Italy - Market size and forecast 2025-2030 ($ million)
Data Table on Italy - Market size and forecast 2025-2030 ($ million)
Chart on Italy - Year-over-year growth 2025-2030 (%)
Data Table on Italy - Year-over-year growth 2025-2030 (%)

12.4.5 Spain - Market size and forecast 2025-2030

Chart on Spain - Market size and forecast 2025-2030 ($ million)
Data Table on Spain - Market size and forecast 2025-2030 ($ million)
Chart on Spain - Year-over-year growth 2025-2030 (%)
Data Table on Spain - Year-over-year growth 2025-2030 (%)

12.4.6 The Netherlands - Market size and forecast 2025-2030

Chart on The Netherlands - Market size and forecast 2025-2030 ($ million)
Data Table on The Netherlands - Market size and forecast 2025-2030 ($ million)
Chart on The Netherlands - Year-over-year growth 2025-2030 (%)
Data Table on The Netherlands - Year-over-year growth 2025-2030 (%)

12.5 APAC - Market size and forecast 2025-2030

Chart on APAC - Market size and forecast 2025-2030 ($ million)
Data Table on APAC - Market size and forecast 2025-2030 ($ million)
Chart on APAC - Year-over-year growth 2025-2030 (%)
Data Table on APAC - Year-over-year growth 2025-2030 (%)
Chart on Regional Comparison - APAC
Data Table on Regional Comparison - APAC

12.5.1 China - Market size and forecast 2025-2030

Chart on China - Market size and forecast 2025-2030 ($ million)
Data Table on China - Market size and forecast 2025-2030 ($ million)
Chart on China - Year-over-year growth 2025-2030 (%)
Data Table on China - Year-over-year growth 2025-2030 (%)

12.5.2 Japan - Market size and forecast 2025-2030

Chart on Japan - Market size and forecast 2025-2030 ($ million)
Data Table on Japan - Market size and forecast 2025-2030 ($ million)
Chart on Japan - Year-over-year growth 2025-2030 (%)
Data Table on Japan - Year-over-year growth 2025-2030 (%)

12.5.3 India - Market size and forecast 2025-2030

Chart on India - Market size and forecast 2025-2030 ($ million)
Data Table on India - Market size and forecast 2025-2030 ($ million)
Chart on India - Year-over-year growth 2025-2030 (%)
Data Table on India - Year-over-year growth 2025-2030 (%)

12.5.4 South Korea - Market size and forecast 2025-2030

Chart on South Korea - Market size and forecast 2025-2030 ($ million)
Data Table on South Korea - Market size and forecast 2025-2030 ($ million)
Chart on South Korea - Year-over-year growth 2025-2030 (%)
Data Table on South Korea - Year-over-year growth 2025-2030 (%)

12.5.5 Australia - Market size and forecast 2025-2030

Chart on Australia - Market size and forecast 2025-2030 ($ million)
Data Table on Australia - Market size and forecast 2025-2030 ($ million)
Chart on Australia - Year-over-year growth 2025-2030 (%)
Data Table on Australia - Year-over-year growth 2025-2030 (%)

12.5.6 Indonesia - Market size and forecast 2025-2030

Chart on Indonesia - Market size and forecast 2025-2030 ($ million)
Data Table on Indonesia - Market size and forecast 2025-2030 ($ million)
Chart on Indonesia - Year-over-year growth 2025-2030 (%)
Data Table on Indonesia - Year-over-year growth 2025-2030 (%)

12.6 South America - Market size and forecast 2025-2030

Chart on South America - Market size and forecast 2025-2030 ($ million)
Data Table on South America - Market size and forecast 2025-2030 ($ million)
Chart on South America - Year-over-year growth 2025-2030 (%)
Data Table on South America - Year-over-year growth 2025-2030 (%)
Chart on Regional Comparison - South America
Data Table on Regional Comparison - South America

12.6.1 Brazil - Market size and forecast 2025-2030

Chart on Brazil - Market size and forecast 2025-2030 ($ million)
Data Table on Brazil - Market size and forecast 2025-2030 ($ million)
Chart on Brazil - Year-over-year growth 2025-2030 (%)
Data Table on Brazil - Year-over-year growth 2025-2030 (%)

12.6.2 Argentina - Market size and forecast 2025-2030

Chart on Argentina - Market size and forecast 2025-2030 ($ million)
Data Table on Argentina - Market size and forecast 2025-2030 ($ million)
Chart on Argentina - Year-over-year growth 2025-2030 (%)
Data Table on Argentina - Year-over-year growth 2025-2030 (%)

12.6.3 Chile - Market size and forecast 2025-2030

Chart on Chile - Market size and forecast 2025-2030 ($ million)
Data Table on Chile - Market size and forecast 2025-2030 ($ million)
Chart on Chile - Year-over-year growth 2025-2030 (%)
Data Table on Chile - Year-over-year growth 2025-2030 (%)

12.7 Middle East and Africa - Market size and forecast 2025-2030

Chart on Middle East and Africa - Market size and forecast 2025-2030 ($ million)
Data Table on Middle East and Africa - Market size and forecast 2025-2030 ($ million)
Chart on Middle East and Africa - Year-over-year growth 2025-2030 (%)
Data Table on Middle East and Africa - Year-over-year growth 2025-2030 (%)
Chart on Regional Comparison - Middle East and Africa
Data Table on Regional Comparison - Middle East and Africa

12.7.1 Saudi Arabia - Market size and forecast 2025-2030

Chart on Saudi Arabia - Market size and forecast 2025-2030 ($ million)
Data Table on Saudi Arabia - Market size and forecast 2025-2030 ($ million)
Chart on Saudi Arabia - Year-over-year growth 2025-2030 (%)
Data Table on Saudi Arabia - Year-over-year growth 2025-2030 (%)

12.7.2 UAE - Market size and forecast 2025-2030

Chart on UAE - Market size and forecast 2025-2030 ($ million)
Data Table on UAE - Market size and forecast 2025-2030 ($ million)
Chart on UAE - Year-over-year growth 2025-2030 (%)
Data Table on UAE - Year-over-year growth 2025-2030 (%)

12.7.3 South Africa - Market size and forecast 2025-2030

Chart on South Africa - Market size and forecast 2025-2030 ($ million)
Data Table on South Africa - Market size and forecast 2025-2030 ($ million)
Chart on South Africa - Year-over-year growth 2025-2030 (%)
Data Table on South Africa - Year-over-year growth 2025-2030 (%)

12.7.4 Turkey - Market size and forecast 2025-2030

Chart on Turkey - Market size and forecast 2025-2030 ($ million)
Data Table on Turkey - Market size and forecast 2025-2030 ($ million)
Chart on Turkey - Year-over-year growth 2025-2030 (%)
Data Table on Turkey - Year-over-year growth 2025-2030 (%)

12.7.5 Israel - Market size and forecast 2025-2030

Chart on Israel - Market size and forecast 2025-2030 ($ million)
Data Table on Israel - Market size and forecast 2025-2030 ($ million)
Chart on Israel - Year-over-year growth 2025-2030 (%)
Data Table on Israel - Year-over-year growth 2025-2030 (%)

12.8 Market opportunity by geography

Market opportunity by geography ($ million)
Data Tables on Market opportunity by geography ($ million)

13. Drivers, Challenges, and Opportunity

13.1 Market drivers

Increasing vehicle complexity and proliferation of connected technologies
Intensifying focus on operational efficiency and cost reduction in fleet management
Convergence of advanced analytics, AI and IOT

13.2 Market challenges

Data privacy and security vulnerabilities
High implementation costs and system complexity
Lack of standardization and interoperability

13.3 Impact of drivers and challenges

Impact of drivers and challenges in 2025 and 2030

13.4 Market opportunities

Integration of machine learning for enhanced predictive accuracy
Rise of software-defined vehicles and over-the-air updates
Heightened emphasis on cybersecurity for prognostic systems

14. Competitive Landscape

14.1 Overview

14.2

Overview on criticality of inputs and factors of differentiation

14.3 Landscape disruption

Overview on factors of disruption

14.4 Industry risks

Impact of key risks on business

15. Competitive Analysis

15.1 Companies profiled

Companies covered

15.2 Company ranking index

15.3 Market positioning of companies

Matrix on companies position and classification

15.4 ANSYS Inc.

ANSYS Inc. - Overview
ANSYS Inc. - Business segments
ANSYS Inc. - Key news
ANSYS Inc. - Key offerings
ANSYS Inc. - Segment focus
SWOT

15.5 Broadcom Inc.

Broadcom Inc. - Overview
Broadcom Inc. - Business segments
Broadcom Inc. - Key news
Broadcom Inc. - Key offerings
Broadcom Inc. - Segment focus
SWOT

15.6 Cloudera Inc.

Cloudera Inc. - Overview
Cloudera Inc. - Product / Service
Cloudera Inc. - Key offerings
SWOT

15.7 Continental AG

Continental AG - Overview
Continental AG - Business segments
Continental AG - Key news
Continental AG - Key offerings
Continental AG - Segment focus
SWOT

15.8 Dell Technologies Inc.

Dell Technologies Inc. - Overview
Dell Technologies Inc. - Business segments
Dell Technologies Inc. - Key news
Dell Technologies Inc. - Key offerings
Dell Technologies Inc. - Segment focus
SWOT

15.9 Digital Management LLC

Digital Management LLC - Overview
Digital Management LLC - Product / Service
Digital Management LLC - Key offerings
SWOT

15.10 Garrett Motion Inc.

Garrett Motion Inc. - Overview
Garrett Motion Inc. - Product / Service
Garrett Motion Inc. - Key offerings
SWOT

15.11 IBM Corp.

IBM Corp. - Overview
IBM Corp. - Business segments
IBM Corp. - Key news
IBM Corp. - Key offerings
IBM Corp. - Segment focus
SWOT

15.12 Magna International Inc.

Magna International Inc. - Overview
Magna International Inc. - Business segments
Magna International Inc. - Key news
Magna International Inc. - Key offerings
Magna International Inc. - Segment focus
SWOT

15.13 Open Text Corp.

Open Text Corp. - Overview
Open Text Corp. - Business segments
Open Text Corp. - Key news
Open Text Corp. - Key offerings
Open Text Corp. - Segment focus
SWOT

15.14 Pioneer Corp.

Pioneer Corp. - Overview
Pioneer Corp. - Product / Service
Pioneer Corp. - Key offerings
SWOT

15.15 Progress Software Corp.

Progress Software Corp. - Overview
Progress Software Corp. - Product / Service
Progress Software Corp. - Key offerings
SWOT

15.16 Robert Bosch GmbH

Robert Bosch GmbH - Overview
Robert Bosch GmbH - Product / Service
Robert Bosch GmbH - Key news
Robert Bosch GmbH - Key offerings
SWOT

15.17 Samsung Electronics Co. Ltd.

Samsung Electronics Co. Ltd. - Overview
Samsung Electronics Co. Ltd. - Business segments
Samsung Electronics Co. Ltd. - Key news
Samsung Electronics Co. Ltd. - Key offerings
Samsung Electronics Co. Ltd. - Segment focus
SWOT

15.18 Solera Holdings LLC

Solera Holdings LLC - Overview
Solera Holdings LLC - Product / Service
Solera Holdings LLC - Key offerings
SWOT

16. Appendix

16.1 Scope of the report

Market definition
Objectives
Notes and caveats

16.2 Inclusions and exclusions checklist

Inclusions checklist
Exclusions checklist

16.3 Currency conversion rates for US$

16.4 Research methodology

16.5 Data procurement

Information sources

16.6 Data validation

16.7 Validation techniques employed for market sizing

16.8 Data synthesis

16.9 360 degree market analysis

16.10 List of abbreviations

Research Methodology

Technavio presents a detailed picture of the market by way of study, synthesis, and summation of data from multiple sources. The analysts have presented the various facets of the market with a particular focus on identifying the key industry influencers. The data thus presented is comprehensive, reliable, and the result of extensive research, both primary and secondary.

INFORMATION SOURCES

Primary sources

  • Manufacturers and suppliers
  • Channel partners
  • Industry experts
  • Strategic decision makers

Secondary sources

  • Industry journals and periodicals
  • Government data
  • Financial reports of key industry players
  • Historical data
  • Press releases

DATA ANALYSIS

Data Synthesis

  • Collation of data
  • Estimation of key figures
  • Analysis of derived insights

Data Validation

  • Triangulation with data models
  • Reference against proprietary databases
  • Corroboration with industry experts

REPORT WRITING

Qualitative

  • Market drivers
  • Market challenges
  • Market trends
  • Five forces analysis

Quantitative

  • Market size and forecast
  • Market segmentation
  • Geographical insights
  • Competitive landscape

Interested in this report?

Get your sample now to see our research methodology and insights!

Download Now

Frequently Asked Questions

Automotive Prognostics market growth will increase by USD 16701.8 million during 2026-2030.

The Automotive Prognostics market is expected to grow at a CAGR of 30.9% during 2026-2030.

Automotive Prognostics market is segmented by Application (Passenger cars, Commercial vehicles) End-user (Aftermarket, OEMs) Component (Hardware, Software, Services)

ANSYS Inc., Broadcom Inc., Cloudera Inc., Continental AG, Dell Technologies Inc., Digital Management LLC, Garrett Motion Inc., IBM Corp., Magna International Inc., Open Text Corp., Pioneer Corp., Predii Inc., Preteckt Inc., Progress Software Corp., Ridgetop Group Inc., Robert Bosch GmbH, Samsung Electronics Co. Ltd., Solera Holdings LLC are a few of the key vendors in the Automotive Prognostics market.

North America will register the highest growth rate of 41.6% among the other regions. Therefore, the Automotive Prognostics market in North America is expected to garner significant business opportunities for the vendors during the forecast period.

US, Canada, Mexico, Germany, France, UK, Italy, Spain, The Netherlands, China, Japan, India, South Korea, Australia, Indonesia, Brazil, Argentina, Chile, Saudi Arabia, UAE, South Africa, Turkey, Israel

  • Increasing vehicle complexity and proliferation of connected technologies is the driving factor this market.

The Automotive Prognostics market vendors should focus on grabbing business opportunities from the Application segment as it accounted for the largest market share in the base year.