
Automotive Radiator Fan Market Size 2025-2029
The automotive radiator fan market size is forecast to increase by USD 282.1 million at a CAGR of 7.4% between 2024 and 2029.
- The market is experiencing significant growth, driven by the increasing demand for fuel-efficient vehicles. Traditional mechanical fans are being replaced with electric radiator fans due to their energy efficiency and ability to improve vehicle cooling performance. Furthermore, the increasing adoption of electric vehicles (EVs) is expected to provide substantial opportunities for market expansion. Electric radiator fans are essential components in EVs, as they help maintain optimal operating temperatures for the battery and other critical components. However, the market is not without challenges. Regulations regarding emissions and fuel efficiency are becoming increasingly stringent, putting pressure on automakers to produce more efficient vehicles.
- Autonomous Vehicles and Agricultural Machinery are other sectors that are expected to witness increased adoption of ring type radiator fans due to their energy-saving capabilities and noise reduction features, such as fan shrouds, viscous couplings, and variable speed motors (ACor brushless DC). Additionally, the high upfront cost of electric radiator fans may limit their widespread adoption in the near term. Companies seeking to capitalize on market opportunities should focus on developing cost-effective and efficient solutions to meet the evolving demands of the automotive industry. Strategic partnerships and collaborations with automakers and component suppliers can also provide valuable opportunities for market growth.
What will be the Size of the Automotive Radiator Fan Market during the forecast period?

- The market is experiencing significant activity and trends. Fan maintenance procedures and warranty play crucial roles in ensuring vehicle cooling efficiency and longevity. Lightweight fan designs enhance fuel economy, while fan installation processes continue to evolve for easier implementation. Fan lifespan is a critical concern, with advancements in fan blade and shroud designs extending durability.
- Cooling fan performance is rigorously tested and certified to meet industry standards. Vibration damping and fan reliability testing are essential for optimal fan assembly processes. Noise reduction and fan regulations are key considerations for fan motor controllers and fan replacement. Innovations in airflow optimization and electric fan technology are driving market trends. Fan manufacturing processes prioritize thermal efficiency and fan standards to meet consumer demands.
How is this Automotive Radiator Fan Industry segmented?
The automotive radiator fan industry research report provides comprehensive data (region-wise segment analysis), with forecasts and estimates in "USD million" for the period 2025-2029, as well as historical data from 2019-2023 for the following segments.
- Type
- Ring type
- Box type
- Application
- Passenger cars
- LCVs
- M and HCVs
- Material
- Steel
- Aluminum
- Composite
- Distribution Channel
- OEMs
- Aftermarket
- Geography
- North America
- US
- Canada
- Europe
- France
- Germany
- UK
- APAC
- China
- India
- Japan
- South Korea
- South America
- Brazil
- North America
By Type Insights
The ring type segment is estimated to witness significant growth during the forecast period. The ring type segment of the market caters to a fan design characterized by a circular or ring-shaped structure. These fans are commonly utilized in vehicles to facilitate heat dissipation and maintain optimal engine temperatures. The compact size and lightweight construction of ring-type radiator fans make them an ideal choice for smaller vehicles or those with limited engine compartment space. The ring design enhances air circulation and cooling efficiency, ensuring the engine operates within desired temperature parameters. In the realm of transportation, various sectors are witnessing significant advancements. For instance, the integration of technology in vehicles, such as fan speed control in connected cars, contributes to improved fuel efficiency and reduced emissions.
The implementation of thermal management systems in hybrid and electric vehicles necessitates the use of efficient cooling systems, including ring type radiator fans. Construction equipment and off-road vehicles also benefit from the adoption of ring type radiator fans due to their robustness and ability to operate in extreme conditions. Additionally, the growing emphasis on environmental regulations and the shift towards lightweight materials in the automotive industry further fuels the demand for these fans.
The fan blades' aerodynamic design and temperature sensors ensure efficient heat dissipation and optimal engine performance. Quality control measures and advancements in fan technology, such as the use of advanced materials and improved fan clutch designs, further enhance the appeal of ring type radiator fans in the automotive market.
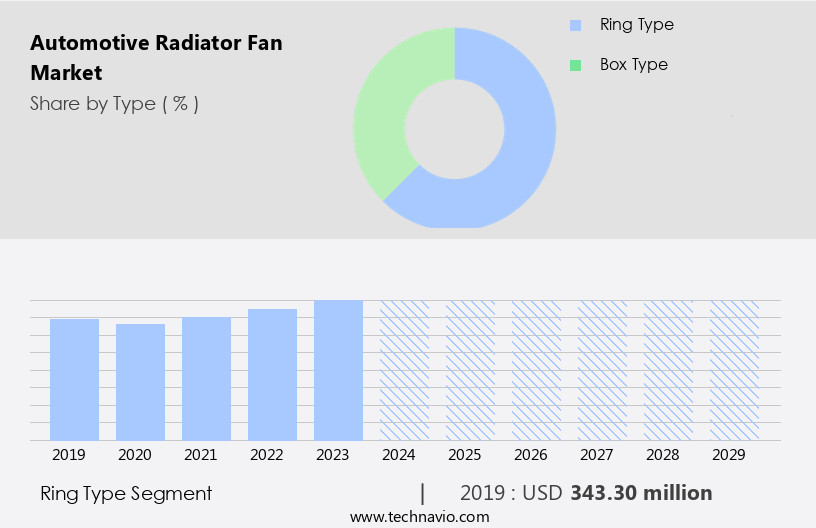
The Ring type segment was valued at USD 343.30 million in 2019 and showed a gradual increase during the forecast period.
Regional Analysis
APAC is estimated to contribute 33% to the growth of the global market during the forecast period. Technavio's analysts have elaborately explained the regional trends and drivers that shape the market during the forecast period.

The market in Asia Pacific is experiencing significant growth, with China being a major contributor. The increasing adoption of passenger cars and commercial vehicles in this region, particularly in China, India, and Japan, is driving market expansion. These countries are significant contributors to the global automotive industry due to high production volumes. In the automotive sector, advancements in technology are leading to the integration of energy-efficient and quieter cooling systems in vehicles. For instance, centrifugal fans, axial fans, and mechanical fans are being replaced with electric fans, including AC motors and Brushless DC Motors, to improve fuel efficiency and reduce noise levels.
Additionally, the use of lightweight materials, such as aluminum and magnesium, in fan blades and fan shrouds is gaining popularity for heat dissipation and energy savings. Moreover, the growing trend towards autonomous vehicles and the increasing focus on thermal management and emission standards are also fueling the demand for automotive radiator fans. In the construction equipment and off-road vehicles sectors, the need for efficient cooling systems to meet emission regulations is driving the market. Furthermore, the use of variable speed fan clutches and viscous couplings in fan control systems is enabling better temperature regulation and reducing fan wear.
In summary, the market in Asia Pacific is witnessing robust growth due to the increasing adoption of passenger cars and commercial vehicles, technological advancements, and regulatory requirements. The market is expected to continue expanding as the demand for efficient, quiet, and energy-saving cooling systems grows.
Market Dynamics
Our researchers analyzed the data with 2024 as the base year, along with the key drivers, trends, and challenges. A holistic analysis of drivers will help companies refine their marketing strategies to gain a competitive advantage.
What are the key market drivers leading to the rise in the adoption of Automotive Radiator Fan Industry?
- The primary catalyst for market growth is the escalating demand for fuel-efficient vehicles. This trend is driven by increasing consumer awareness and preference for eco-friendly transportation options, as well as regulatory initiatives aimed at reducing carbon emissions. The automotive industry is focusing on enhancing vehicle efficiency and complying with stringent emission regulations, leading to the significance of automotive radiator fans. These components play a vital role in managing engine temperatures, ensuring optimal operating conditions for maximum performance, fuel economy, and reduced emissions. Recent advancements in automotive radiator fan technology have resulted in improved designs and functionality. Manufacturers are integrating innovative features such as electric fans, variable speed fans, and thermostatically controlled fans to meet the evolving demands of the industry.
- The integration of these technologies not only improves engine cooling efficiency but also reduces the overall weight of the vehicle, contributing to improved fuel economy. The integration of smart technologies and connectivity solutions is also gaining traction in the market, offering enhanced control and monitoring capabilities for vehicle owners.
What are the market trends shaping the Automotive Radiator Fan Industry?
- The shift from mechanical fans to electric radiator fans is currently a prevailing market trend, reflecting advancements in heating technology and energy efficiency. The automotive radiator fan is an essential component in automobiles, responsible for maintaining the engine temperature at an optimal level for maximum operational efficiency. Traditional mechanical radiator fans consume power to spin, resulting in parasitic horsepower loss and performance disadvantages. To address this issue, automakers are transitioning from mechanical to electric radiator fans. Electric fans enhance cooling performance and improve air conditioning efficiency, especially during idle states.
- This fan replacement can lead to increased horsepower and improved fuel efficiency by eliminating engine drag. The shift towards electric radiator fans signifies a significant advancement in automotive cooling systems, contributing to enhanced vehicle performance and reduced environmental impact.
What challenges does the Automotive Radiator Fan Industry face during its growth?
- The increasing adoption of electric vehicles (EVs) poses a significant challenge to the growth of the automotive industry, requiring innovative solutions to address the complexities of infrastructure development, battery technology advancements, and consumer education. The automotive industry is experiencing a significant shift towards electric vehicles (EVs) due to increasing concerns over emissions and air pollution. While the initial adoption of EVs was slow, advancements in battery technology and charging infrastructure, coupled with government subsidies, have accelerated their growth. The elimination of engines and transmission systems in EVs results in automatic speed variations and reduces the need for radiator fans.
- However, the market dynamics of the automotive industry are evolving, and the growing popularity of EVs is impacting the demand for traditional automotive radiator fans. The transition from internal combustion engine (ICE) vehicles to EVs is a trend that is expected to continue, potentially slowing down the growth of the market.
Exclusive Customer Landscape
The automotive radiator fan market forecasting report includes the adoption lifecycle of the market, covering from the innovator's stage to the laggard's stage. It focuses on adoption rates in different regions based on penetration. Furthermore, the automotive radiator fan market report also includes key purchase criteria and drivers of price sensitivity to help companies evaluate and develop their market growth analysis strategies.

Customer Landscape
Key Companies & Market Insights
Companies are implementing various strategies, such as strategic alliances, automotive radiator fan market forecast, partnerships, mergers and acquisitions, geographical expansion, and product/service launches, to enhance their presence in the industry.
Air International Thermal Systems - The company offers automotive radiator fans, such as powertrain cooling modules.
The industry research and growth report includes detailed analyses of the competitive landscape of the market and information about key companies, including:
- Air International Thermal Systems
- AMETEK Inc.
- Bergstrom Inc.
- BorgWarner Inc.
- Delta Electronics Inc.
- DENSO Corp.
- Flexxaire Inc.
- HELLA GmbH and Co. KGaA
- Horton Holding Inc.
- Johnson Electric Holdings Ltd.
- MAHLE GmbH
- Marelli Holdings Co. Ltd.
- Multi Wing America Inc.
- Nidec Corp.
- NRF BV
- Robert Bosch GmbH
- SPAL Automotive Srl
- Sunonwealth Electric Machine Industry Co. Ltd.
- Toshiba Corp.
- Valeo SA
Qualitative and quantitative analysis of companies has been conducted to help clients understand the wider business environment as well as the strengths and weaknesses of key industry players. Data is qualitatively analyzed to categorize companies as pure play, category-focused, industry-focused, and diversified; it is quantitatively analyzed to categorize companies as dominant, leading, strong, tentative, and weak.
Recent Development and News in Automotive Radiator Fan Market
- The market has witnessed several significant developments in recent years, shaping the competitive landscape and driving innovation. Here are four key developments:
- In Q1 2025, Magna International, a leading automotive supplier, announced the launch of its new electric radiator fan (ERF) system for electric vehicles (EVs). This system, which is expected to reduce energy consumption by up to 30%, marks Magna's entry into the growing EV components market (Magna International Press Release, 2025).
- In Q3 2024, Valeo, a French automotive components manufacturer, collaborated with CATL, a leading lithium-ion battery supplier, to develop advanced thermal management systems for electric vehicles. This partnership aims to enhance the efficiency and performance of electric vehicles by optimizing their thermal management systems (Valeo Press Release, 2024).
- In H2 2024, Denso Corporation, a major Japanese automotive components manufacturer, acquired Dantherm Compressors A/S, a Danish manufacturer of compressors and climate control solutions. This acquisition is expected to expand Denso's product portfolio and strengthen its position in the global Automotive Climate Control market (Denso Corporation Press Release, 2024).
- In Q1 2023, Sanden Holdings Corporation, a leading Japanese automotive components manufacturer, launched its new e-TEC R170 series of electric radiator fans for hybrid and electric vehicles. This product line features high-efficiency fans and advanced thermal management technologies, making it a competitive offering in the growing market for electric vehicle components (Sanden Holdings Corporation Press Release, 2023). These developments underscore the ongoing innovation and competition in the market, as companies seek to improve efficiency, reduce energy consumption, and expand their offerings to meet the evolving needs of the automotive industry. (Source: Company Press Releases)
Research Analyst Overview
The market is witnessing significant growth due to the increasing demand for advanced thermal management systems in various vehicle types. Connected Vehicles, an emerging trend in the automotive industry, are integrating fan speed control systems to optimize engine performance and improve fuel efficiency. Centrifugal fans and fan clutches continue to dominate the market, providing efficient cooling solutions for construction equipment and commercial vehicles. However, the shift towards hybrid and electric vehicles is driving the demand for electric fans, which offer energy savings and reduced noise levels. Environmental regulations are playing a crucial role in the market's evolution, as stricter emission standards necessitate the use of lightweight materials and energy-efficient cooling systems.
Thermal management has become a key focus area for automakers, with temperature sensors and fan blades being optimized for improved heat dissipation. The construction equipment sector is a significant consumer of replacement parts, including fans and fan clutches, due to the heavy-duty nature of their applications. In the passenger vehicle segment, axial fans and viscous couplings are gaining popularity for their ability to provide quieter and more efficient cooling solutions. The market for automotive radiator fans is diverse, catering to various vehicle types and applications. The commercial vehicle sector, including heavy-duty trucks, is a major consumer due to the demanding operating conditions.
In the agricultural machinery sector, fan shrouds and fan blades are essential components for maintaining optimal engine temperatures. The adoption of variable speed fans and advanced fan control systems is on the rise, as they offer improved thermal management and energy savings. The use of AC motors and brushless DC motors in fan applications is also increasing, as they offer higher efficiency and longer lifespan. The market for automotive radiator fans is expected to grow further with the advent of autonomous vehicles and the increasing focus on energy saving and noise reduction. Quality control and innovation are key priorities for manufacturers, as they strive to meet the evolving demands of the automotive industry.
In conclusion, the market is a dynamic and evolving industry, driven by advances in thermal management, environmental regulations, and technological innovation. The market caters to various vehicle types and applications, with a focus on energy savings, noise reduction, and improved performance.
Dive into Technavio's robust research methodology, blending expert interviews, extensive data synthesis, and validated models for unparalleled Automotive Radiator Fan Market insights. See full methodology.
|
Market Scope |
|
|
Report Coverage |
Details |
|
Page number |
237 |
|
Base year |
2024 |
|
Historic period |
2019-2023 |
|
Forecast period |
2025-2029 |
|
Growth momentum & CAGR |
Accelerate at a CAGR of 7.4% |
|
Market growth 2025-2029 |
USD 282.1 million |
|
Market structure |
Fragmented |
|
YoY growth 2024-2025(%) |
6.8 |
|
Key countries |
US, China, Germany, Canada, Japan, India, Brazil, France, South Korea, and UK |
|
Competitive landscape |
Leading Companies, Market Positioning of Companies, Competitive Strategies, and Industry Risks |
What are the Key Data Covered in this Automotive Radiator Fan Market Research and Growth Report?
- CAGR of the Automotive Radiator Fan industry during the forecast period
- Detailed information on factors that will drive the growth and forecasting between 2025 and 2029
- Precise estimation of the size of the market and its contribution of the industry in focus to the parent market
- Accurate predictions about upcoming growth and trends and changes in consumer behaviour
- Growth of the market across APAC, Europe, North America, South America, and Middle East and Africa
- Thorough analysis of the market's competitive landscape and detailed information about companies
- Comprehensive analysis of factors that will challenge the automotive radiator fan market growth and forecasting
We can help! Our analysts can customize this automotive radiator fan market research report to meet your requirements.