Automotive Rear Cross Traffic Alert (RCTA) Market Analysis, Size, and Forecast 2026-2030: North America (US, Canada, and Mexico), Europe (Germany, UK, and France), APAC (China, Japan, and South Korea), Middle East and Africa (Saudi Arabia, UAE, and South Africa), South America (Brazil, Argentina, and Colombia), and Rest of World (ROW)

Automotive Rear Cross Traffic Alert (RCTA) Market Analysis, Size, and Forecast 2026-2030:
North America (US, Canada, and Mexico), Europe (Germany, UK, and France), APAC (China, Japan, and South Korea), Middle East and Africa (Saudi Arabia, UAE, and South Africa), South America (Brazil, Argentina, and Colombia), and Rest of World (ROW)

Published: May 2026 298 Pages SKU: IRTNTR73621

Market Overview at a Glance

$4.55 B
Market Opportunity
10.4%
CAGR 2025 - 2030
37.7%
North America Growth
$4.93 B
Passenger cars segment 2024

Automotive Rear Cross Traffic Alert (RCTA) Market Size 2026-2030

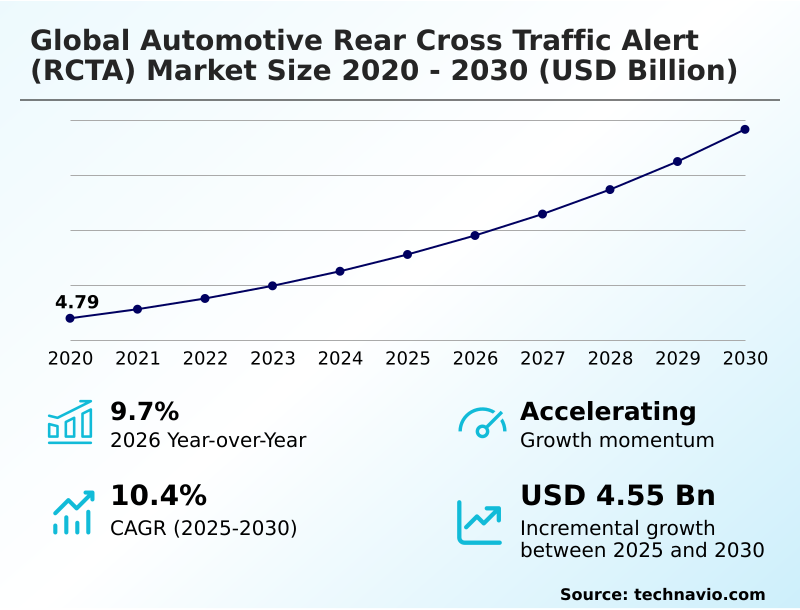
The Automotive Rear Cross Traffic Alert (RCTA) Market size was valued at USD 7.11 billion in 2025, growing at a CAGR of 10.4% during the forecast period 2026-2030.

Major Market Trends & Insights

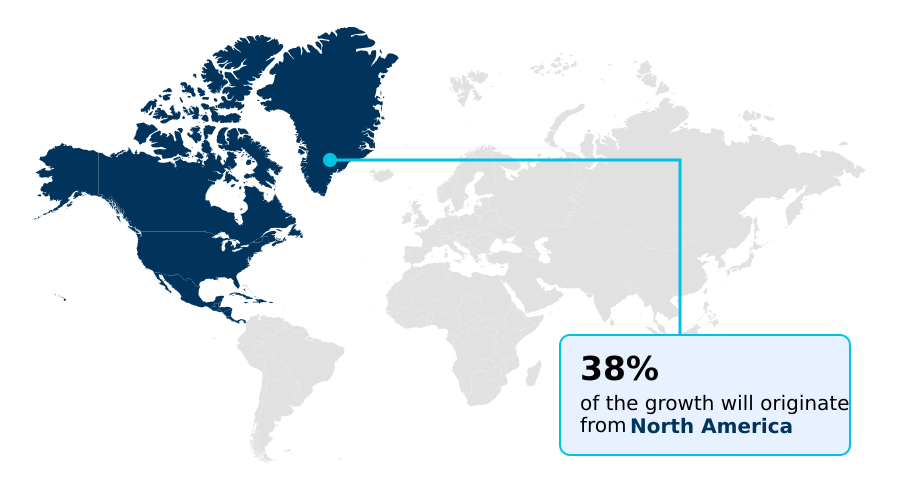
  • North America dominated the market and accounted for a 37.7% growth during the forecast period.
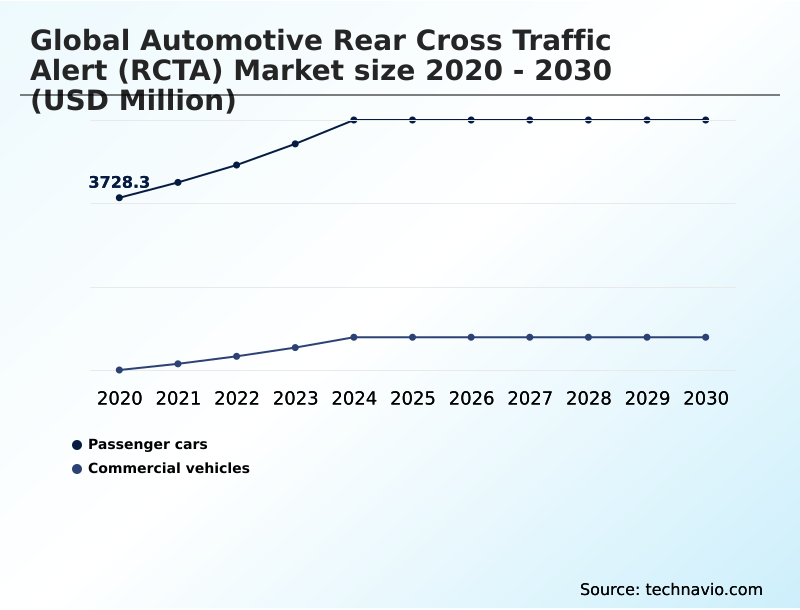
  • By Application - Passenger cars segment was valued at USD 4.93 billion in 2024
  • By Technology - Radar based segment accounted for the largest market revenue share in 2024

Market Size & Forecast

  • Historic Market Opportunities 2020-2024: USD 6.87 billion
  • Market Future Opportunities 2025-2030: USD 4.55 billion
  • CAGR from 2025 to 2030 : 10.4%

Market Summary

  • The automotive rear cross traffic alert (RCTA) market is characterized by rapid technological adoption, with over 80% of new vehicle owners now viewing it as an essential safety feature. However, this high demand is contrasted by a significant user acceptance challenge, as studies show up to 54% of drivers disable certain ADAS functions due to perceived nuisance alerts.
  • This dynamic is a key driver for innovation, pushing manufacturers to refine sensor fusion algorithms to improve the collision avoidance capability. A key business scenario involves automakers re-evaluating their human-machine interface (HMI) design to make alert systems more intuitive and less intrusive, thereby increasing utilization.
  • The primary driver remains the stringent safety mandates from global NCAP bodies, which compel the integration of these systems to achieve top safety ratings. Conversely, the high cost of advanced sensors like 4D imaging radar presents a challenge for standardization in economy vehicle segments, creating a potential bifurcation in safety feature availability.

What will be the Size of the Automotive Rear Cross Traffic Alert (RCTA) Market during the forecast period?

Get Key Insights on Market Forecast (PDF) Request Free Sample

How is the Automotive Rear Cross Traffic Alert (RCTA) Market Segmented?

The automotive rear cross traffic alert (rcta) industry research report provides comprehensive data (region-wise segment analysis), with forecasts and analysis for the period 2026-2030, as well as historical data from 2020-2024 for the following segments.

  • Application
    • Passenger cars
    • Commercial vehicles
  • Technology
    • Radar based
    • Camera based
    • Ultrasonic based
    • Hybrid
  • End-user
    • OEM
    • Aftermarket
  • Geography
    • North America
      • US
      • Canada
      • Mexico
    • Europe
      • Germany
      • UK
      • France
    • APAC
      • China
      • Japan
      • South Korea
    • Middle East and Africa
      • Saudi Arabia
      • UAE
      • South Africa
    • South America
      • Brazil
      • Argentina
      • Colombia
    • Rest of World (ROW)

How is the Automotive Rear Cross Traffic Alert (RCTA) Market Segmented by Application?

The passenger cars segment is estimated to witness significant growth during the forecast period.

The passenger cars segment, which accounts for over 75% of market applications, is primarily driven by the rapid democratization of advanced driver assistance systems.

Consumer studies show that more than 80% of new vehicle owners now consider features such as the rear cross-traffic alert indispensable, transforming it from a luxury add-on into a standard feature.

Integration of RCTA is often bundled with blind spot detection, utilizing a shared sensor fusion algorithm to optimize costs.

However, a major challenge is user acceptance; with up to 54% of drivers disabling some ADAS features due to nuisance alerts, refining the collision avoidance capability to reduce false positives is critical for sustained segment growth and achieving higher active safety system utilization.

Request Free Sample

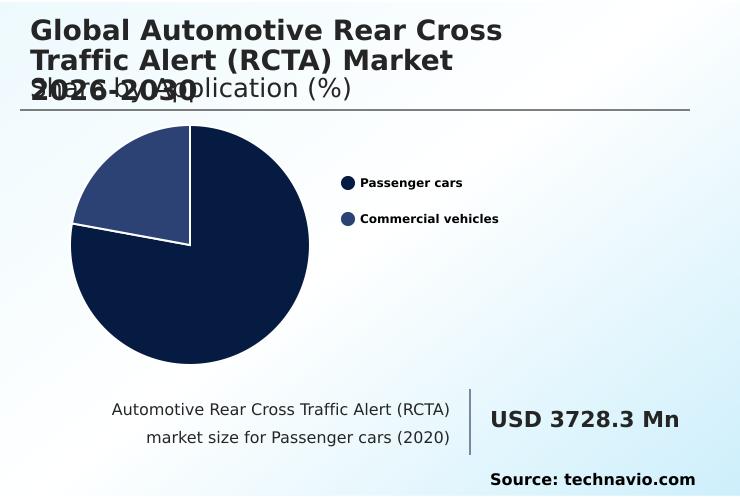
The Passenger cars segment was valued at USD 4.93 billion in 2024 and showed a gradual increase during the forecast period.

Request Free Sample

How demand for the Automotive Rear Cross Traffic Alert (RCTA) market is rising in the leading region?

North America is estimated to contribute 37.7% to the growth of the global market during the forecast period.Technavio’s analysts have elaborately explained the regional trends and drivers that shape the market during the forecast period.

See How Automotive Rear Cross Traffic Alert (RCTA) Market demand is rising in North America Request Free Sample

Regional dynamics in the automotive rear cross traffic alert (RCTA) market are distinctly shaped by consumer preferences and regulatory frameworks.

North America contributes over 37% of the market's incremental growth, dominated by the US, where the popularity of large SUVs and trucks makes reversing maneuver safety a primary consumer concern.

In contrast, the APAC region, growing at a faster rate of 11.7%, is driven by China's aggressive push for new energy vehicles and advanced active safety systems.

This regional difference impacts supply chains; North American operations focus on integrating RCTA with features like trailer assist, while APAC development prioritizes vulnerable road user protection in dense urban settings.

Adoption in Europe is driven by Euro NCAP's stringent testing, which penalizes vehicles without robust rear automatic braking, leading to a 15% higher adoption rate in new premium models compared to base trims in South America.

What are the key Drivers, Trends, and Challenges in the Automotive Rear Cross Traffic Alert (RCTA) Market?

Our researchers analyzed the data with 2025 as the base year, along with the key drivers, trends, and challenges. A holistic analysis of drivers will help companies refine their marketing strategies to gain a competitive advantage.

  • The decision-making process for integrating RCTA technology involves balancing performance, compliance, and financial implications. For OEMs, the automotive rear cross traffic alert system cost is a critical factor, with basic radar modules adding a notable amount to the bill of materials for entry-level vehicles, a figure that can be 50% higher than for simpler ultrasonic sensors.
  • In the commercial sector, the focus is on durability and range, making the selection of the right rcta sensor for commercial vehicles a strategic decision for fleet managers aiming to reduce accidents in loading bays, which account for over 20% of non-road incidents.
  • Technologically, the debate centers on how does 4d imaging radar improve rcta performance; its ability to detect object height and classify targets reduces false positives by up to 40% compared to 2D systems, a crucial factor for implementing an rcta system with automatic braking.
  • For the existing vehicle parc, aftermarket rear cross traffic alert kits offer a viable path to enhanced safety, though they typically lack the deep vehicle integration of OEM solutions. These kits can provide essential alerts but rarely offer the active braking intervention that is becoming a standard feature in new vehicle production.

What are the key market drivers leading to the rise in the adoption of Automotive Rear Cross Traffic Alert (RCTA) Industry?

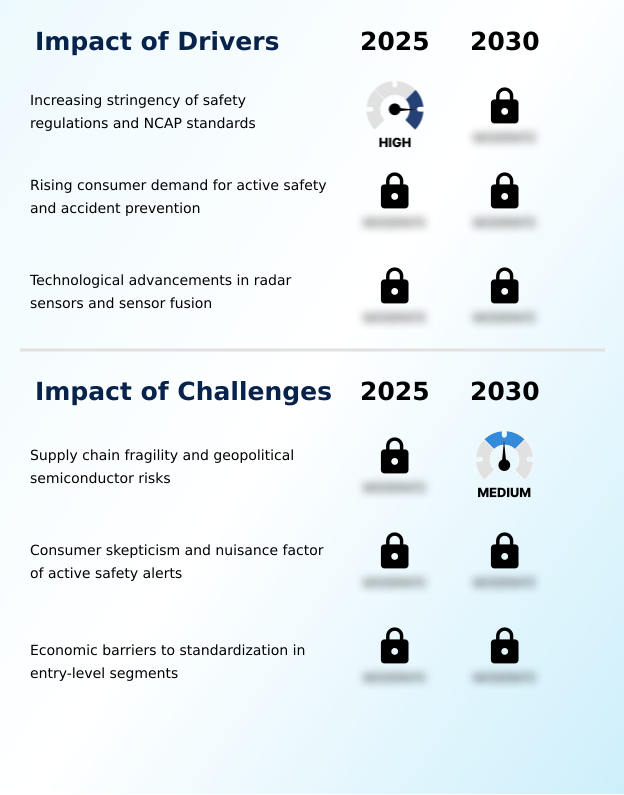
  • The increasing stringency of safety regulations and New Car Assessment Program (NCAP) standards is a key driver of market growth.

  • Increasingly stringent safety regulations are the primary driver for the automotive rear cross traffic alert market, as achieving a 5-star NCAP rating is now nearly impossible without comprehensive active safety systems.
  • This regulatory pressure transforms RCTA from an optional feature into a standard requirement.
  • This is amplified by a strong consumer pull; over 80% of new car buyers now consider collision avoidance capability a critical purchasing factor, viewing the technology as a safeguard against expensive repairs from low-speed incidents, which can cost 10 times more on vehicles with embedded sensors.
  • Consequently, automakers are accelerating the rollout of these systems across all vehicle segments to maintain market competitiveness and meet both regulatory mandates and consumer expectations for passenger vehicle safety.

What are the market trends shaping the Automotive Rear Cross Traffic Alert (RCTA) Industry?

  • The adoption of 4D imaging radar for enhanced object classification is an upcoming market trend. This technology promises to improve detection accuracy and reduce false alarms in advanced driver-assistance systems.

  • A key trend reshaping the automotive rear cross traffic alert market is the adoption of 4D imaging radar, which improves object classification accuracy by over 30% compared to traditional 2D sensors by adding elevation data. This technological shift is critical for enabling reliable rear automatic braking. Another major trend is the integration of AI within a software-defined vehicle architecture.
  • This allows for over-the-air (OTA) updates that continuously refine the sensor fusion algorithm, learning from fleet data to reduce false positives—a significant factor in user acceptance, given that 54% of drivers report disabling systems due to nuisance alerts. This move toward software-defined safety improves vulnerable road user protection by enhancing the system's ability to differentiate between threats and non-hazardous objects.

What challenges does the Automotive Rear Cross Traffic Alert (RCTA) Industry face during its growth?

  • Supply chain fragility and geopolitical risks in the semiconductor sector present key challenges affecting industry growth.

  • Supply chain fragility presents a significant challenge to the automotive rear cross traffic alert market, as a shortage of a single microcontroller, often costing less than a dollar, can halt production lines.
  • This is compounded by the high user acceptance rate threshold required for effectiveness; with 54% of drivers disabling features they find annoying, the prevalence of false positives from less sophisticated systems poses a major barrier to value perception. Furthermore, the economic challenge of standardization is acute in entry-level vehicles.
  • The cost of a corner radar sensor and its associated ADAS domain controller can represent a 3-5% increase in the total bill of materials for a budget car, making it difficult for manufacturers to offer this critical safety feature without compromising affordability.

Exclusive Technavio Analysis on Customer Landscape

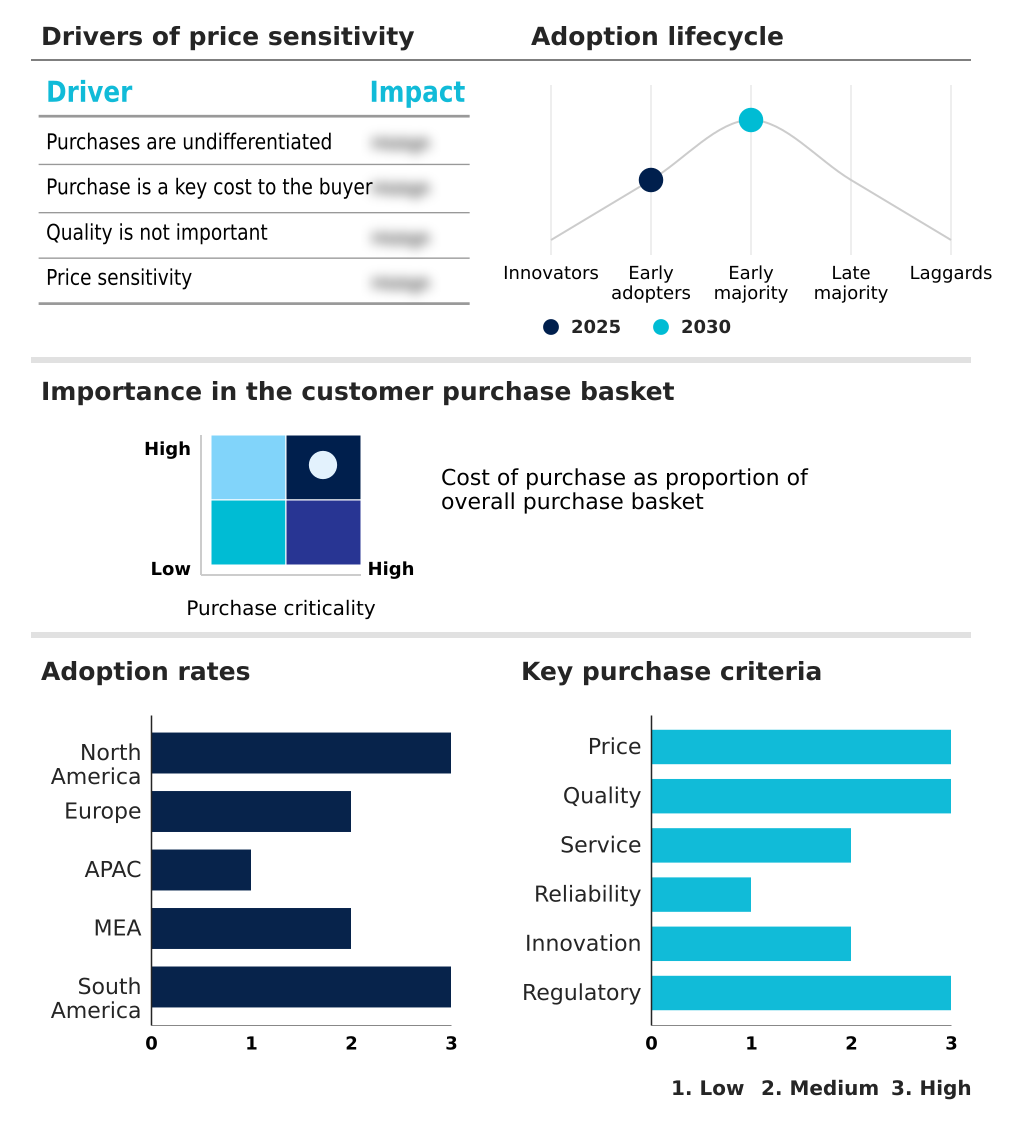
The automotive rear cross traffic alert (rcta) market forecasting report includes the adoption lifecycle of the market, covering from the innovator’s stage to the laggard’s stage. It focuses on adoption rates in different regions based on penetration. Furthermore, the automotive rear cross traffic alert (rcta) market report also includes key purchase criteria and drivers of price sensitivity to help companies evaluate and develop their market growth analysis strategies.

Customer Landscape of Automotive Rear Cross Traffic Alert (RCTA) Industry

Competitive Landscape

Companies are implementing various strategies, such as strategic alliances, automotive rear cross traffic alert (rcta) market forecast, partnerships, mergers and acquisitions, geographical expansion, and product/service launches, to enhance their presence in the industry.

Aptiv Plc - Offers integrated radar and camera-based systems leveraging sensor fusion to enhance vehicle safety during reversing maneuvers for improved collision avoidance.

The industry research and growth report includes detailed analyses of the competitive landscape of the market and information about key companies, including:

  • Aptiv Plc
  • Continental AG
  • DENSO Corp.
  • Ford Motor Co.
  • General Motors Co.
  • Honda Motor Co. Ltd.
  • Infineon Technologies AG
  • Magna International Inc.
  • Mazda Motor Corp.
  • Nissan Motor Co. Ltd.
  • Panasonic Holdings Corp.
  • Robert Bosch GmbH
  • Texas Instruments Inc.
  • Toyota Motor Corp.
  • Valeo SA
  • Veoneer Inc.
  • Volkswagen Group

Qualitative and quantitative analysis of companies has been conducted to help clients understand the wider business environment as well as the strengths and weaknesses of key industry players. Data is qualitatively analyzed to categorize companies as pure play, category-focused, industry-focused, and diversified; it is quantitatively analyzed to categorize companies as dominant, leading, strong, tentative, and weak.

Market Intelligence Radar: High-Impact Developments & Growth Signals

  • In the Automotive Parts and Equipment industry, the enforcement of stringent vehicle safety regulations, such as those requiring advanced emergency braking, has accelerated the standardization of comprehensive ADAS domain controller architectures. This directly impacts the global automotive rear cross traffic alert (RCTA) market by lowering the integration barrier for surround-sensing features and improving reversing maneuver safety.
  • In the Automotive Parts and Equipment industry, the transition to software-defined vehicle architecture has shifted the value proposition from hardware to updatable software. This affects the global automotive rear cross traffic alert (RCTA) market by enabling over-the-air (OTA) updates that can enhance sensor fusion algorithms and reduce false positives, improving user acceptance rate over the vehicle's lifespan.
  • In the Automotive Parts and Equipment industry, persistent volatility in the semiconductor supply chain has forced a strategic redesign of electronic control units to accommodate multi-source components. For the global automotive rear cross traffic alert (RCTA) market, this means developing more flexible hardware that supports chips from various suppliers, mitigating production risks tied to geopolitical instability.
  • In the Automotive Parts and Equipment industry, the expansion of active safety mandates into the commercial vehicle sector is creating new demand for robust sensor systems. This development opens a significant growth avenue for the global automotive rear cross traffic alert (RCTA) market, requiring solutions tailored for the large blind spots and harsh operating environments of heavy-duty trucks and delivery vans.

Dive into Technavio’s robust research methodology, blending expert interviews, extensive data synthesis, and validated models for unparalleled Automotive Rear Cross Traffic Alert (RCTA) Market insights. See full methodology.

Market Scope
Page number 298
Base year 2025
Historic period 2020-2024
Forecast period 2026-2030
Growth momentum & CAGR Accelerate at a CAGR of 10.4%
Market growth 2026-2030 USD 4551.1 million
Market structure Fragmented
YoY growth 2025-2026(%) 9.7%
Key countries US, Canada, Mexico, Germany, UK, France, Italy, Spain, The Netherlands, China, Japan, South Korea, India, Australia, Indonesia, Saudi Arabia, UAE, South Africa, Israel, Turkey, Brazil, Argentina and Colombia
Competitive landscape Leading Companies, Market Positioning of Companies, Competitive Strategies, and Industry Risks

Request Free Sample

Research Analyst Overview

  • The automotive rear cross traffic alert (RCTA) market ecosystem is a complex value chain where semiconductor firms supply radar chips, which account for over 30% of the system's cost, to Tier-1 manufacturers. These suppliers, including Continental and Bosch, engineer and validate the complete RCTA modules, which are then integrated by automotive OEMs into new vehicle platforms.
  • The entire ecosystem is heavily influenced by regulatory bodies and safety assessment programs like Euro NCAP, whose testing protocols dictate the required performance level, pushing OEMs to standardize features like rear automatic braking to achieve 5-star ratings. End-user demand is shaped by consumer awareness of active safety features, with studies showing an 80% preference for vehicles equipped with such systems.
  • Distribution is primarily through the OEM channel, which represents over 85% of the market volume, with a smaller aftermarket segment providing retrofit solutions.

What are the Key Data Covered in this Automotive Rear Cross Traffic Alert (RCTA) Market Research and Growth Report?

  • What is the expected growth of the Automotive Rear Cross Traffic Alert (RCTA) Market between 2026 and 2030?

    • The Automotive Rear Cross Traffic Alert (RCTA) Market is expected to grow by USD 4.55 billion during 2026-2030, registering a CAGR of 10.4%. Year-over-year growth in 2026 is estimated at 9.7%%. This acceleration is shaped by increasing stringency of safety regulations and ncap standards, which is intensifying demand across multiple end-use verticals covered in the report.

  • What segmentation does the market report cover?

    • The report is segmented by Application (Passenger cars, and Commercial vehicles), Technology (Radar based, Camera based, Ultrasonic based, and Hybrid), End-user (OEM, and Aftermarket) and Geography (North America, Europe, APAC, Middle East and Africa, South America). Among these, the Passenger cars segment is estimated to witness significant growth during the forecast period, driven by rising adoption across key application areas. Each segment includes detailed qualitative and quantitative analysis, along with historical data from 2020-2024 and forecasts through 2030 with year-over-year growth rates.

  • Which regions are analyzed in the report?

    • The report covers North America, Europe, APAC, Middle East and Africa and South America. North America is estimated to contribute 37.7% to market growth during the forecast period. Country-level analysis includes US, Canada, Mexico, Germany, UK, France, Italy, Spain, The Netherlands, China, Japan, South Korea, India, Australia, Indonesia, Saudi Arabia, UAE, South Africa, Israel, Turkey, Brazil, Argentina and Colombia, with dedicated market size tables and year-over-year growth for each.

  • What are the key growth drivers and market challenges?

    • The primary driver is increasing stringency of safety regulations and ncap standards, which is accelerating investment and industry demand. The main challenge is supply chain fragility and geopolitical semiconductor risks, creating operational barriers for key market participants. The report quantifies the impact of each driver and challenge across 2026 and 2030 with comparative analysis.

  • Who are the major players in the Automotive Rear Cross Traffic Alert (RCTA) Market?

    • Key vendors include Aptiv Plc, Continental AG, DENSO Corp., Ford Motor Co., General Motors Co., Honda Motor Co. Ltd., Infineon Technologies AG, Magna International Inc., Mazda Motor Corp., Nissan Motor Co. Ltd., Panasonic Holdings Corp., Robert Bosch GmbH, Texas Instruments Inc., Toyota Motor Corp., Valeo SA, Veoneer Inc. and Volkswagen Group. The report provides qualitative and quantitative analysis categorizing companies as dominant, leading, strong, tentative, and weak based on their market positioning. Company profiles include business segment analysis, SWOT assessment, key offerings, and recent strategic developments.

Market Research Insights

  • The competitive landscape for the automotive rear cross traffic alert (RCTA) market is highly concentrated, with the top five Tier-1 suppliers commanding over 60% of the component market. Key players, including Continental AG and Robert Bosch GmbH, are intensifying their focus on high-resolution radar technology to meet evolving safety standards.
  • For instance, Continental recently produced its 200 millionth radar sensor, signaling massive scaling to support new vehicle mandates. These advancements are a direct response to enterprise demand from automakers like Toyota Motor Corp. and Ford Motor Co., who must integrate features like rear automatic braking to secure 5-star NCAP ratings.
  • A major challenge remains the dependency on a fragile semiconductor supply chain. In response, suppliers such as Denso and Aptiv are diversifying their chip sourcing and investing in more flexible, software-defined architectures to mitigate production disruptions and ensure a steady supply of these critical safety components.

We can help! Our analysts can customize this automotive rear cross traffic alert (rcta) market research report to meet your requirements.

Get in touch

1. Executive Summary

1.1 Market overview

Executive Summary - Chart on Market Overview
Executive Summary - Data Table on Market Overview
Executive Summary - Chart on Global Market Characteristics
Executive Summary - Chart on Market by Geography
Executive Summary - Chart on Market Segmentation by Application
Executive Summary - Chart on Market Segmentation by Technology
Executive Summary - Chart on Market Segmentation by End-user
Executive Summary - Chart on Incremental Growth
Executive Summary - Data Table on Incremental Growth
Executive Summary - Chart on Company Market Positioning

2. Technavio Analysis

2.1 Analysis of price sensitivity, lifecycle, customer purchase basket, adoption rates, and purchase criteria

2.2 Criticality of inputs and Factors of differentiation

Chart on Overview on criticality of inputs and factors of differentiation

2.3 Factors of disruption

Chart on Overview on factors of disruption

2.4 Impact of drivers and challenges

Chart on Impact of drivers and challenges in 2025 and 2030

3. Market Landscape

3.1 Market ecosystem

Chart on Parent Market
Data Table on - Parent Market

3.2 Market characteristics

Chart on Market characteristics analysis

3.3 Value chain analysis

Chart on Value chain analysis

4. Market Sizing

4.1 Market definition

Data Table on Offerings of companies included in the market definition

4.2 Market segment analysis

Market segments

4.3 Market size 2025

4.4 Market outlook: Forecast for 2025-2030

Chart on Global - Market size and forecast 2025-2030 ($ million)
Data Table on Global - Market size and forecast 2025-2030 ($ million)
Chart on Global Market: Year-over-year growth 2025-2030 (%)
Data Table on Global Market: Year-over-year growth 2025-2030 (%)

5. Historic Market Size

5.1 Global Automotive Rear Cross Traffic Alert (RCTA) Market 2020 - 2024

Historic Market Size - Data Table on Global Automotive Rear Cross Traffic Alert (RCTA) Market 2020 - 2024 ($ million)

5.2 Application segment analysis 2020 - 2024

Historic Market Size - Application Segment 2020 - 2024 ($ million)

5.3 Technology segment analysis 2020 - 2024

Historic Market Size - Technology Segment 2020 - 2024 ($ million)

5.4 End-user segment analysis 2020 - 2024

Historic Market Size - End-user Segment 2020 - 2024 ($ million)

5.5 Geography segment analysis 2020 - 2024

Historic Market Size - Geography Segment 2020 - 2024 ($ million)

5.6 Country segment analysis 2020 - 2024

Historic Market Size - Country Segment 2020 - 2024 ($ million)

6. Qualitative Analysis

6.1 The AI impact on global automotive rear cross traffic alert (RCTA) market

7. Five Forces Analysis

7.1 Five forces summary

Five forces analysis - Comparison between 2025 and 2030

7.2 Bargaining power of buyers

Bargaining power of buyers - Impact of key factors 2025 and 2030

7.3 Bargaining power of suppliers

Bargaining power of suppliers - Impact of key factors in 2025 and 2030

7.4 Threat of new entrants

Threat of new entrants - Impact of key factors in 2025 and 2030

7.5 Threat of substitutes

Threat of substitutes - Impact of key factors in 2025 and 2030

7.6 Threat of rivalry

Threat of rivalry - Impact of key factors in 2025 and 2030

7.7 Market condition

Chart on Market condition - Five forces 2025 and 2030

8. Market Segmentation by Application

8.1 Market segments

Chart on Application - Market share 2025-2030 (%)
Data Table on Application - Market share 2025-2030 (%)

8.2 Comparison by Application

Chart on Comparison by Application
Data Table on Comparison by Application

8.3 Passenger cars - Market size and forecast 2025-2030

Chart on Passenger cars - Market size and forecast 2025-2030 ($ million)
Data Table on Passenger cars - Market size and forecast 2025-2030 ($ million)
Chart on Passenger cars - Year-over-year growth 2025-2030 (%)
Data Table on Passenger cars - Year-over-year growth 2025-2030 (%)

8.4 Commercial vehicles - Market size and forecast 2025-2030

Chart on Commercial vehicles - Market size and forecast 2025-2030 ($ million)
Data Table on Commercial vehicles - Market size and forecast 2025-2030 ($ million)
Chart on Commercial vehicles - Year-over-year growth 2025-2030 (%)
Data Table on Commercial vehicles - Year-over-year growth 2025-2030 (%)

8.5 Market opportunity by Application

Market opportunity by Application ($ million)
Data Table on Market opportunity by Application ($ million)

9. Market Segmentation by Technology

9.1 Market segments

Chart on Technology - Market share 2025-2030 (%)
Data Table on Technology - Market share 2025-2030 (%)

9.2 Comparison by Technology

Chart on Comparison by Technology
Data Table on Comparison by Technology

9.3 Radar based - Market size and forecast 2025-2030

Chart on Radar based - Market size and forecast 2025-2030 ($ million)
Data Table on Radar based - Market size and forecast 2025-2030 ($ million)
Chart on Radar based - Year-over-year growth 2025-2030 (%)
Data Table on Radar based - Year-over-year growth 2025-2030 (%)

9.4 Camera based - Market size and forecast 2025-2030

Chart on Camera based - Market size and forecast 2025-2030 ($ million)
Data Table on Camera based - Market size and forecast 2025-2030 ($ million)
Chart on Camera based - Year-over-year growth 2025-2030 (%)
Data Table on Camera based - Year-over-year growth 2025-2030 (%)

9.5 Ultrasonic based - Market size and forecast 2025-2030

Chart on Ultrasonic based - Market size and forecast 2025-2030 ($ million)
Data Table on Ultrasonic based - Market size and forecast 2025-2030 ($ million)
Chart on Ultrasonic based - Year-over-year growth 2025-2030 (%)
Data Table on Ultrasonic based - Year-over-year growth 2025-2030 (%)

9.6 Hybrid - Market size and forecast 2025-2030

Chart on Hybrid - Market size and forecast 2025-2030 ($ million)
Data Table on Hybrid - Market size and forecast 2025-2030 ($ million)
Chart on Hybrid - Year-over-year growth 2025-2030 (%)
Data Table on Hybrid - Year-over-year growth 2025-2030 (%)

9.7 Market opportunity by Technology

Market opportunity by Technology ($ million)
Data Table on Market opportunity by Technology ($ million)

10. Market Segmentation by End-user

10.1 Market segments

Chart on End-user - Market share 2025-2030 (%)
Data Table on End-user - Market share 2025-2030 (%)

10.2 Comparison by End-user

Chart on Comparison by End-user
Data Table on Comparison by End-user

10.3 OEM - Market size and forecast 2025-2030

Chart on OEM - Market size and forecast 2025-2030 ($ million)
Data Table on OEM - Market size and forecast 2025-2030 ($ million)
Chart on OEM - Year-over-year growth 2025-2030 (%)
Data Table on OEM - Year-over-year growth 2025-2030 (%)

10.4 Aftermarket - Market size and forecast 2025-2030

Chart on Aftermarket - Market size and forecast 2025-2030 ($ million)
Data Table on Aftermarket - Market size and forecast 2025-2030 ($ million)
Chart on Aftermarket - Year-over-year growth 2025-2030 (%)
Data Table on Aftermarket - Year-over-year growth 2025-2030 (%)

10.5 Market opportunity by End-user

Market opportunity by End-user ($ million)
Data Table on Market opportunity by End-user ($ million)

11. Customer Landscape

11.1 Customer landscape overview

Analysis of price sensitivity, lifecycle, customer purchase basket, adoption rates, and purchase criteria

12. Geographic Landscape

12.1 Geographic segmentation

Chart on Market share by geography 2025-2030 (%)
Data Table on Market share by geography 2025-2030 (%)

12.2 Geographic comparison

Chart on Geographic comparison
Data Table on Geographic comparison

12.3 North America - Market size and forecast 2025-2030

Chart on North America - Market size and forecast 2025-2030 ($ million)
Data Table on North America - Market size and forecast 2025-2030 ($ million)
Chart on North America - Year-over-year growth 2025-2030 (%)
Data Table on North America - Year-over-year growth 2025-2030 (%)
Chart on Regional Comparison - North America
Data Table on Regional Comparison - North America

12.3.1 US - Market size and forecast 2025-2030

Chart on US - Market size and forecast 2025-2030 ($ million)
Data Table on US - Market size and forecast 2025-2030 ($ million)
Chart on US - Year-over-year growth 2025-2030 (%)
Data Table on US - Year-over-year growth 2025-2030 (%)

12.3.2 Canada - Market size and forecast 2025-2030

Chart on Canada - Market size and forecast 2025-2030 ($ million)
Data Table on Canada - Market size and forecast 2025-2030 ($ million)
Chart on Canada - Year-over-year growth 2025-2030 (%)
Data Table on Canada - Year-over-year growth 2025-2030 (%)

12.3.3 Mexico - Market size and forecast 2025-2030

Chart on Mexico - Market size and forecast 2025-2030 ($ million)
Data Table on Mexico - Market size and forecast 2025-2030 ($ million)
Chart on Mexico - Year-over-year growth 2025-2030 (%)
Data Table on Mexico - Year-over-year growth 2025-2030 (%)

12.4 Europe - Market size and forecast 2025-2030

Chart on Europe - Market size and forecast 2025-2030 ($ million)
Data Table on Europe - Market size and forecast 2025-2030 ($ million)
Chart on Europe - Year-over-year growth 2025-2030 (%)
Data Table on Europe - Year-over-year growth 2025-2030 (%)
Chart on Regional Comparison - Europe
Data Table on Regional Comparison - Europe

12.4.1 Germany - Market size and forecast 2025-2030

Chart on Germany - Market size and forecast 2025-2030 ($ million)
Data Table on Germany - Market size and forecast 2025-2030 ($ million)
Chart on Germany - Year-over-year growth 2025-2030 (%)
Data Table on Germany - Year-over-year growth 2025-2030 (%)

12.4.2 UK - Market size and forecast 2025-2030

Chart on UK - Market size and forecast 2025-2030 ($ million)
Data Table on UK - Market size and forecast 2025-2030 ($ million)
Chart on UK - Year-over-year growth 2025-2030 (%)
Data Table on UK - Year-over-year growth 2025-2030 (%)

12.4.3 France - Market size and forecast 2025-2030

Chart on France - Market size and forecast 2025-2030 ($ million)
Data Table on France - Market size and forecast 2025-2030 ($ million)
Chart on France - Year-over-year growth 2025-2030 (%)
Data Table on France - Year-over-year growth 2025-2030 (%)

12.4.4 Italy - Market size and forecast 2025-2030

Chart on Italy - Market size and forecast 2025-2030 ($ million)
Data Table on Italy - Market size and forecast 2025-2030 ($ million)
Chart on Italy - Year-over-year growth 2025-2030 (%)
Data Table on Italy - Year-over-year growth 2025-2030 (%)

12.4.5 Spain - Market size and forecast 2025-2030

Chart on Spain - Market size and forecast 2025-2030 ($ million)
Data Table on Spain - Market size and forecast 2025-2030 ($ million)
Chart on Spain - Year-over-year growth 2025-2030 (%)
Data Table on Spain - Year-over-year growth 2025-2030 (%)

12.4.6 The Netherlands - Market size and forecast 2025-2030

Chart on The Netherlands - Market size and forecast 2025-2030 ($ million)
Data Table on The Netherlands - Market size and forecast 2025-2030 ($ million)
Chart on The Netherlands - Year-over-year growth 2025-2030 (%)
Data Table on The Netherlands - Year-over-year growth 2025-2030 (%)

12.5 APAC - Market size and forecast 2025-2030

Chart on APAC - Market size and forecast 2025-2030 ($ million)
Data Table on APAC - Market size and forecast 2025-2030 ($ million)
Chart on APAC - Year-over-year growth 2025-2030 (%)
Data Table on APAC - Year-over-year growth 2025-2030 (%)
Chart on Regional Comparison - APAC
Data Table on Regional Comparison - APAC

12.5.1 China - Market size and forecast 2025-2030

Chart on China - Market size and forecast 2025-2030 ($ million)
Data Table on China - Market size and forecast 2025-2030 ($ million)
Chart on China - Year-over-year growth 2025-2030 (%)
Data Table on China - Year-over-year growth 2025-2030 (%)

12.5.2 Japan - Market size and forecast 2025-2030

Chart on Japan - Market size and forecast 2025-2030 ($ million)
Data Table on Japan - Market size and forecast 2025-2030 ($ million)
Chart on Japan - Year-over-year growth 2025-2030 (%)
Data Table on Japan - Year-over-year growth 2025-2030 (%)

12.5.3 South Korea - Market size and forecast 2025-2030

Chart on South Korea - Market size and forecast 2025-2030 ($ million)
Data Table on South Korea - Market size and forecast 2025-2030 ($ million)
Chart on South Korea - Year-over-year growth 2025-2030 (%)
Data Table on South Korea - Year-over-year growth 2025-2030 (%)

12.5.4 India - Market size and forecast 2025-2030

Chart on India - Market size and forecast 2025-2030 ($ million)
Data Table on India - Market size and forecast 2025-2030 ($ million)
Chart on India - Year-over-year growth 2025-2030 (%)
Data Table on India - Year-over-year growth 2025-2030 (%)

12.5.5 Australia - Market size and forecast 2025-2030

Chart on Australia - Market size and forecast 2025-2030 ($ million)
Data Table on Australia - Market size and forecast 2025-2030 ($ million)
Chart on Australia - Year-over-year growth 2025-2030 (%)
Data Table on Australia - Year-over-year growth 2025-2030 (%)

12.5.6 Indonesia - Market size and forecast 2025-2030

Chart on Indonesia - Market size and forecast 2025-2030 ($ million)
Data Table on Indonesia - Market size and forecast 2025-2030 ($ million)
Chart on Indonesia - Year-over-year growth 2025-2030 (%)
Data Table on Indonesia - Year-over-year growth 2025-2030 (%)

12.6 Middle East and Africa - Market size and forecast 2025-2030

Chart on Middle East and Africa - Market size and forecast 2025-2030 ($ million)
Data Table on Middle East and Africa - Market size and forecast 2025-2030 ($ million)
Chart on Middle East and Africa - Year-over-year growth 2025-2030 (%)
Data Table on Middle East and Africa - Year-over-year growth 2025-2030 (%)
Chart on Regional Comparison - Middle East and Africa
Data Table on Regional Comparison - Middle East and Africa

12.6.1 Saudi Arabia - Market size and forecast 2025-2030

Chart on Saudi Arabia - Market size and forecast 2025-2030 ($ million)
Data Table on Saudi Arabia - Market size and forecast 2025-2030 ($ million)
Chart on Saudi Arabia - Year-over-year growth 2025-2030 (%)
Data Table on Saudi Arabia - Year-over-year growth 2025-2030 (%)

12.6.2 UAE - Market size and forecast 2025-2030

Chart on UAE - Market size and forecast 2025-2030 ($ million)
Data Table on UAE - Market size and forecast 2025-2030 ($ million)
Chart on UAE - Year-over-year growth 2025-2030 (%)
Data Table on UAE - Year-over-year growth 2025-2030 (%)

12.6.3 South Africa - Market size and forecast 2025-2030

Chart on South Africa - Market size and forecast 2025-2030 ($ million)
Data Table on South Africa - Market size and forecast 2025-2030 ($ million)
Chart on South Africa - Year-over-year growth 2025-2030 (%)
Data Table on South Africa - Year-over-year growth 2025-2030 (%)

12.6.4 Israel - Market size and forecast 2025-2030

Chart on Israel - Market size and forecast 2025-2030 ($ million)
Data Table on Israel - Market size and forecast 2025-2030 ($ million)
Chart on Israel - Year-over-year growth 2025-2030 (%)
Data Table on Israel - Year-over-year growth 2025-2030 (%)

12.6.5 Turkey - Market size and forecast 2025-2030

Chart on Turkey - Market size and forecast 2025-2030 ($ million)
Data Table on Turkey - Market size and forecast 2025-2030 ($ million)
Chart on Turkey - Year-over-year growth 2025-2030 (%)
Data Table on Turkey - Year-over-year growth 2025-2030 (%)

12.7 South America - Market size and forecast 2025-2030

Chart on South America - Market size and forecast 2025-2030 ($ million)
Data Table on South America - Market size and forecast 2025-2030 ($ million)
Chart on South America - Year-over-year growth 2025-2030 (%)
Data Table on South America - Year-over-year growth 2025-2030 (%)
Chart on Regional Comparison - South America
Data Table on Regional Comparison - South America

12.7.1 Brazil - Market size and forecast 2025-2030

Chart on Brazil - Market size and forecast 2025-2030 ($ million)
Data Table on Brazil - Market size and forecast 2025-2030 ($ million)
Chart on Brazil - Year-over-year growth 2025-2030 (%)
Data Table on Brazil - Year-over-year growth 2025-2030 (%)

12.7.2 Argentina - Market size and forecast 2025-2030

Chart on Argentina - Market size and forecast 2025-2030 ($ million)
Data Table on Argentina - Market size and forecast 2025-2030 ($ million)
Chart on Argentina - Year-over-year growth 2025-2030 (%)
Data Table on Argentina - Year-over-year growth 2025-2030 (%)

12.7.3 Colombia - Market size and forecast 2025-2030

Chart on Colombia - Market size and forecast 2025-2030 ($ million)
Data Table on Colombia - Market size and forecast 2025-2030 ($ million)
Chart on Colombia - Year-over-year growth 2025-2030 (%)
Data Table on Colombia - Year-over-year growth 2025-2030 (%)

12.8 Market opportunity by geography

Market opportunity by geography ($ million)
Data Tables on Market opportunity by geography ($ million)

13. Drivers, Challenges, and Opportunity

13.1 Market drivers

Increasing stringency of safety regulations and NCAP standards
Rising consumer demand for active safety and accident prevention
Technological advancements in radar sensors and sensor fusion

13.2 Market challenges

Supply chain fragility and geopolitical semiconductor risks
Consumer skepticism and nuisance factor of active safety alerts
Economic barriers to standardization in entry-level segments

13.3 Impact of drivers and challenges

Impact of drivers and challenges in 2025 and 2030

13.4 Market opportunities

Adoption of 4D imaging radar for enhanced object classification
Regulatory expansion into commercial and heavy-duty vehicle safety
Integration of artificial intelligence for software-defined safety

14. Competitive Landscape

14.1 Overview

14.2

Overview on criticality of inputs and factors of differentiation

14.3 Landscape disruption

Overview on factors of disruption

14.4 Industry risks

Impact of key risks on business

15. Competitive Analysis

15.1 Companies profiled

Companies covered

15.2 Company ranking index

15.3 Market positioning of companies

Matrix on companies position and classification

15.4 Aptiv Plc

Aptiv Plc - Overview
Aptiv Plc - Business segments
Aptiv Plc - Key news
Aptiv Plc - Key offerings
Aptiv Plc - Segment focus
SWOT

15.5 Continental AG

Continental AG - Overview
Continental AG - Business segments
Continental AG - Key news
Continental AG - Key offerings
Continental AG - Segment focus
SWOT

15.6 DENSO Corp.

DENSO Corp. - Overview
DENSO Corp. - Business segments
DENSO Corp. - Key news
DENSO Corp. - Key offerings
DENSO Corp. - Segment focus
SWOT

15.7 Ford Motor Co.

Ford Motor Co. - Overview
Ford Motor Co. - Business segments
Ford Motor Co. - Key offerings
Ford Motor Co. - Segment focus
SWOT

15.8 General Motors Co.

General Motors Co. - Overview
General Motors Co. - Business segments
General Motors Co. - Key news
General Motors Co. - Key offerings
General Motors Co. - Segment focus
SWOT

15.9 Honda Motor Co. Ltd.

Honda Motor Co. Ltd. - Overview
Honda Motor Co. Ltd. - Business segments
Honda Motor Co. Ltd. - Key news
Honda Motor Co. Ltd. - Key offerings
Honda Motor Co. Ltd. - Segment focus
SWOT

15.10 Infineon Technologies AG

Infineon Technologies AG - Overview
Infineon Technologies AG - Business segments
Infineon Technologies AG - Key news
Infineon Technologies AG - Key offerings
Infineon Technologies AG - Segment focus
SWOT

15.11 Magna International Inc.

Magna International Inc. - Overview
Magna International Inc. - Business segments
Magna International Inc. - Key news
Magna International Inc. - Key offerings
Magna International Inc. - Segment focus
SWOT

15.12 Mazda Motor Corp.

Mazda Motor Corp. - Overview
Mazda Motor Corp. - Business segments
Mazda Motor Corp. - Key offerings
Mazda Motor Corp. - Segment focus
SWOT

15.13 Nissan Motor Co. Ltd.

Nissan Motor Co. Ltd. - Overview
Nissan Motor Co. Ltd. - Business segments
Nissan Motor Co. Ltd. - Key news
Nissan Motor Co. Ltd. - Key offerings
Nissan Motor Co. Ltd. - Segment focus
SWOT

15.14 Panasonic Holdings Corp.

Panasonic Holdings Corp. - Overview
Panasonic Holdings Corp. - Business segments
Panasonic Holdings Corp. - Key news
Panasonic Holdings Corp. - Key offerings
Panasonic Holdings Corp. - Segment focus
SWOT

15.15 Robert Bosch GmbH

Robert Bosch GmbH - Overview
Robert Bosch GmbH - Product / Service
Robert Bosch GmbH - Key offerings
SWOT

15.16 Toyota Motor Corp.

Toyota Motor Corp. - Overview
Toyota Motor Corp. - Business segments
Toyota Motor Corp. - Key news
Toyota Motor Corp. - Key offerings
Toyota Motor Corp. - Segment focus
SWOT

15.17 Valeo SA

Valeo SA - Overview
Valeo SA - Business segments
Valeo SA - Key news
Valeo SA - Key offerings
Valeo SA - Segment focus
SWOT

15.18 Veoneer Inc.

Veoneer Inc. - Overview
Veoneer Inc. - Product / Service
Veoneer Inc. - Key offerings
SWOT

16. Appendix

16.1 Scope of the report

Market definition
Objectives
Notes and caveats

16.2 Inclusions and exclusions checklist

Inclusions checklist
Exclusions checklist

16.3 Currency conversion rates for US$

16.4 Research methodology

16.5 Data procurement

Information sources

16.6 Data validation

16.7 Validation techniques employed for market sizing

16.8 Data synthesis

16.9 360 degree market analysis

16.10 List of abbreviations

Research Methodology

Technavio presents a detailed picture of the market by way of study, synthesis, and summation of data from multiple sources. The analysts have presented the various facets of the market with a particular focus on identifying the key industry influencers. The data thus presented is comprehensive, reliable, and the result of extensive research, both primary and secondary.

INFORMATION SOURCES

Primary sources

  • Manufacturers and suppliers
  • Channel partners
  • Industry experts
  • Strategic decision makers

Secondary sources

  • Industry journals and periodicals
  • Government data
  • Financial reports of key industry players
  • Historical data
  • Press releases

DATA ANALYSIS

Data Synthesis

  • Collation of data
  • Estimation of key figures
  • Analysis of derived insights

Data Validation

  • Triangulation with data models
  • Reference against proprietary databases
  • Corroboration with industry experts

REPORT WRITING

Qualitative

  • Market drivers
  • Market challenges
  • Market trends
  • Five forces analysis

Quantitative

  • Market size and forecast
  • Market segmentation
  • Geographical insights
  • Competitive landscape

Interested in this report?

Get your sample now to see our research methodology and insights!

Download Now

Frequently Asked Questions

Automotive Rear Cross Traffic Alert (RCTA) market growth will increase by USD 4551.1 million during 2026-2030.

The Automotive Rear Cross Traffic Alert (RCTA) market is expected to grow at a CAGR of 10.4% during 2026-2030.

Automotive Rear Cross Traffic Alert (RCTA) market is segmented by Application (Passenger cars, Commercial vehicles) Technology (Radar based, Camera based, Ultrasonic based, Hybrid) End-user (OEM, Aftermarket)

Aptiv Plc, Continental AG, DENSO Corp., Ford Motor Co., General Motors Co., Honda Motor Co. Ltd., Infineon Technologies AG, Magna International Inc., Mazda Motor Corp., Nissan Motor Co. Ltd., Panasonic Holdings Corp., Robert Bosch GmbH, Texas Instruments Inc., Toyota Motor Corp., Valeo SA, Veoneer Inc., Volkswagen Group are a few of the key vendors in the Automotive Rear Cross Traffic Alert (RCTA) market.

North America will register the highest growth rate of 37.7% among the other regions. Therefore, the Automotive Rear Cross Traffic Alert (RCTA) market in North America is expected to garner significant business opportunities for the vendors during the forecast period.

US, Canada, Mexico, Germany, UK, France, Italy, Spain, The Netherlands, China, Japan, South Korea, India, Australia, Indonesia, Saudi Arabia, UAE, South Africa, Israel, Turkey, Brazil, Argentina, Colombia

  • Increasing stringency of safety regulations and NCAP standards is the driving factor this market.

The Automotive Rear Cross Traffic Alert (RCTA) market vendors should focus on grabbing business opportunities from the Application segment as it accounted for the largest market share in the base year.
RIA - Research AI Assistant
Ask RIA