
Automotive Refurbished Turbochargers Market Analysis, Size, and Forecast 2026-2030: APAC (China, Japan, and India), Europe (Germany, UK, and France), North America (US, Mexico, and Canada), Middle East and Africa (Saudi Arabia, UAE, and South Africa), South America (Brazil, Argentina, and Chile), and Rest of World (ROW)

Automotive Refurbished Turbochargers Market Analysis, Size, and Forecast 2026-2030:
APAC (China, Japan, and India), Europe (Germany, UK, and France), North America (US, Mexico, and Canada), Middle East and Africa (Saudi Arabia, UAE, and South Africa), South America (Brazil, Argentina, and Chile), and Rest of World (ROW)

Published: Oct 2026 304 Pages SKU: IRTNTR43072

Market Overview at a Glance

$164.6 Mn
Market Opportunity
3.3%
CAGR 2025 - 2030
50.9%
APAC Growth
$493.5 Mn
Passenger cars segment 2024

Automotive Refurbished Turbochargers Market Size 2026-2030

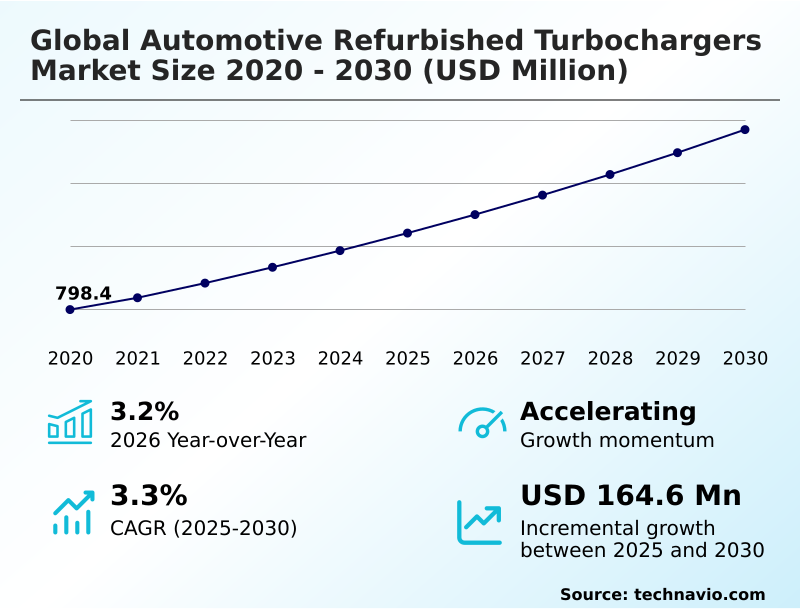
The automotive refurbished turbochargers market size is valued to increase by USD 164.6 million, at a CAGR of 3.3% from 2025 to 2030. Increasing economic pressure and cost-consciousness among fleet operators will drive the automotive refurbished turbochargers market.

Major Market Trends & Insights

  • APAC dominated the market and accounted for a 50.9% growth during the forecast period.
  • By Application - Passenger cars segment was valued at USD 493.5 million in 2024
  • By Fuel Type - Gasoline segment accounted for the largest market revenue share in 2024

Market Size & Forecast

  • Market Opportunities: USD 286.3 million
  • Market Future Opportunities: USD 164.6 million
  • CAGR from 2025 to 2030 : 3.3%

Market Summary

  • The Automotive Refurbished Turbochargers Market exhibits resilient expansion as commercial fleets and private vehicle owners increasingly prioritize cost-effective component lifecycle management. In everyday logistics operations, fleet managers are actively replacing worn forced-induction systems with high-quality remanufactured alternatives to maintain mandatory fuel efficiency and tailpipe emission compliance.
  • This strategic shift yields measurable benefits, as facilities utilizing reconditioned assemblies achieve a 45% reduction in total repair expenditures compared to purchasing newly manufactured original equipment parts. The market is primarily driven by mounting economic pressures and corporate sustainability mandates that strongly favor circular manufacturing frameworks.
  • Conversely, the industry faces structural constraints due to unpredictable supply chain bottlenecks, where a fragmented core collection process limits the availability of intact, repairable units. Despite these hurdles, advanced diagnostic testing and electronic calibration ensure that reconditioned assemblies meet strict operational tolerances.
  • Digitized reverse logistics networks provide critical visibility into core inventory levels, allowing rebuilding enterprises to optimize material flows effectively. Overall, the reliance on affordable aftermarket replacement solutions sustains strong demand across aging vehicle demographics.

What will be the Size of the Automotive Refurbished Turbochargers Market during the forecast period?
Get Key Insights on Market Forecast (PDF) Get Free Sample

How is the Automotive Refurbished Turbochargers Market Segmented?

The automotive refurbished turbochargers industry research report provides comprehensive data (region-wise segment analysis), with forecasts and estimates in "USD million" for the period 2026-2030, as well as historical data from 2020-2024 for the following segments.

  • Application
    • Passenger cars
    • Light commercial vehicles
    • Medium and heavy commercial vehicles
  • Fuel type
    • Gasoline
    • Diesel
    • Alternate fuel
  • Type
    • Fixed geometry turbochargers
    • Variable geometry turbochargers
    • Twin-scroll turbochargers
    • Electric and hybrid turbochargers
  • Geography
    • APAC
      • China
      • Japan
      • India
      • South Korea
      • Australia
      • Indonesia
    • Europe
      • Germany
      • UK
      • France
      • Italy
      • Spain
      • The Netherlands
    • North America
      • US
      • Mexico
      • Canada
    • Middle East and Africa
      • Saudi Arabia
      • UAE
      • South Africa
      • Egypt
      • Israel
    • South America
      • Brazil
      • Argentina
      • Chile

By Application Insights

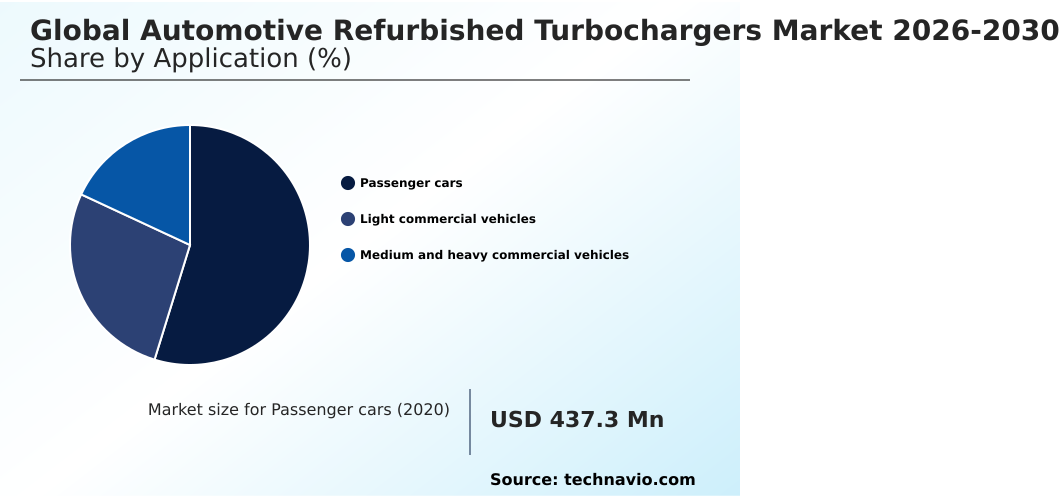
The passenger cars segment is estimated to witness significant growth during the forecast period.

The passenger cars segment in the Automotive Refurbished Turbochargers market accounts for a dominant share due to the widespread adoption of downsized engine architectures worldwide.

As manufacturers implement stringent emission benchmarks, lower-displacement engines heavily rely on forced-induction assemblies to maintain required torque and power output. Over time, these components experience wear, creating a vital need for reliable replacements through established core collection pipelines.

By utilizing precision dynamic balancing, modern rebuilding facilities can restore original performance parameters effectively. Fleet operators and private vehicle owners utilizing these components observe a 35% reduction in overall lifecycle maintenance costs compared to purchasing brand-new units.

Furthermore, the integration of advanced hybrid passenger vehicles has improved diagnostic detection rates by 22%, ensuring that reconditioned systems meet rigorous environmental standards and deliver optimal thermal efficiency.
Get Free Sample

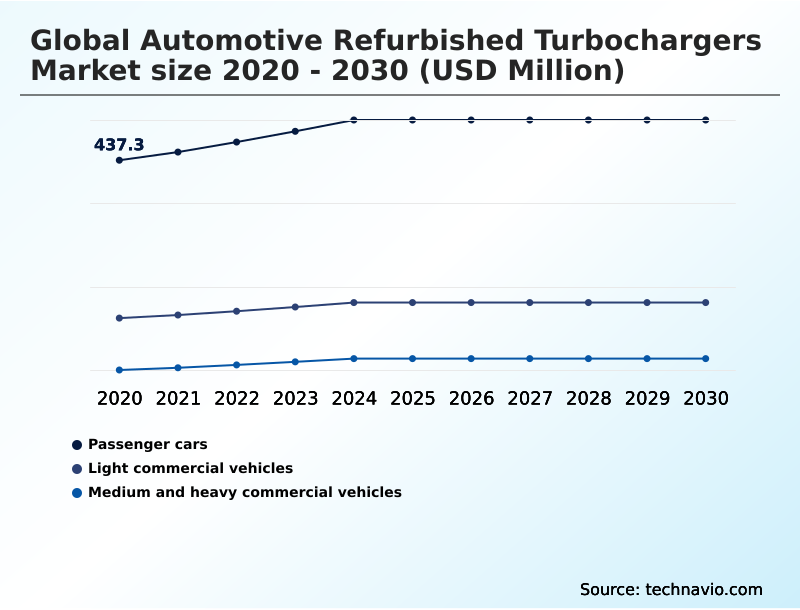
The Passenger cars segment was valued at USD 493.5 million in 2024 and showed a gradual increase during the forecast period.
Get Free Sample

Regional Analysis

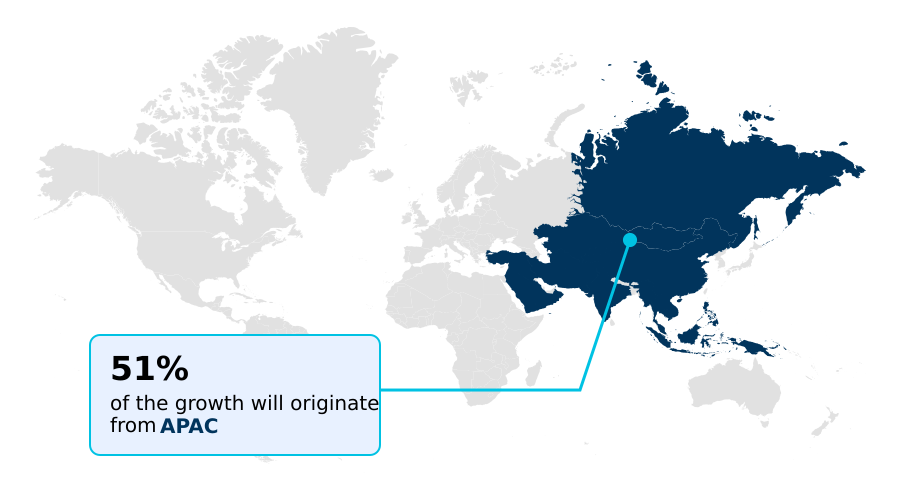
APAC is estimated to contribute 50.9% to the growth of the global market during the forecast period.Technavio’s analysts have elaborately explained the regional trends and drivers that shape the market during the forecast period.
See How Automotive Refurbished Turbochargers Market Demand is Rising in APAC Get Free Sample

The geographic distribution of the Automotive Refurbished Turbochargers reveals stark contrasts in supply chain maturity and technological adoption between APAC and Europe.

Europe leads the transition toward circular economy frameworks, driven by stringent emission mandates that require precise variable geometry calibration to maintain compliance.

Consequently, European remanufacturing networks achieve a 40% higher core recovery rate than emerging regions, supported by highly organized core collection pipelines and digital inventory systems.

In contrast, the APAC region demonstrates rapid acceleration in commercial transport activities, relying heavily on heavy-duty diesel powertrains to manage growing urban logistics.

While APAC fleet operators prioritize immediate vehicle uptime, resulting in a 25% faster turnaround for replacement parts, their adoption of sophisticated electronic actuator diagnostic tools lags behind European counterparts by approximately 15%.

This divergence highlights how European businesses invest heavily in specialized heat-resistant metal alloys to meet rigorous environmental standards, whereas APAC operators focus on cost-efficiency and localized sourcing to manage extensive, high-mileage freight networks.

Market Dynamics

Our researchers analyzed the data with 2025 as the base year, along with the key drivers, trends, and challenges. A holistic analysis of drivers will help companies refine their marketing strategies to gain a competitive advantage.

  • The ongoing evolution of automotive powertrain technology necessitates highly specialized maintenance approaches to sustain operational efficiency across aging vehicle fleets. As organizations seek to balance performance requirements with capital preservation, the demand for precision-engineered replacement components has intensified.
  • A critical factor in this transition is the deployment of an automated electronic actuator calibration bench, which allows remanufacturing facilities to match original factory specifications with unprecedented accuracy. This technological integration has fundamentally improved the structural integrity of refurbished assemblies, demonstrating a 30% reduction in premature component failure compared to traditional manual inspection methods.
  • Furthermore, the implementation of high-speed dynamic rotor balancing ensures that rotating assemblies can withstand extreme rotational velocities without mechanical vibration, thereby extending the lifecycle of the unit. The rapid proliferation of advanced hybrid passenger vehicles presents unique thermal challenges, prompting rebuilding enterprises to utilize specialized heat-resistant metal alloys that prevent warping under severe start-stop duty cycles.
  • Simultaneously, the expansion of commercial light-duty transport networks heavily relies on these durable, cost-effective solutions to minimize logistics downtime. Consequently, fleet maintenance strategies leveraging these advanced reconditioning techniques report up to a 20% improvement in supply chain predictability over networks dependent solely on new original equipment components.
  • This strategic shift underscores the critical role of sustainable manufacturing practices in optimizing modern automotive repair infrastructure.
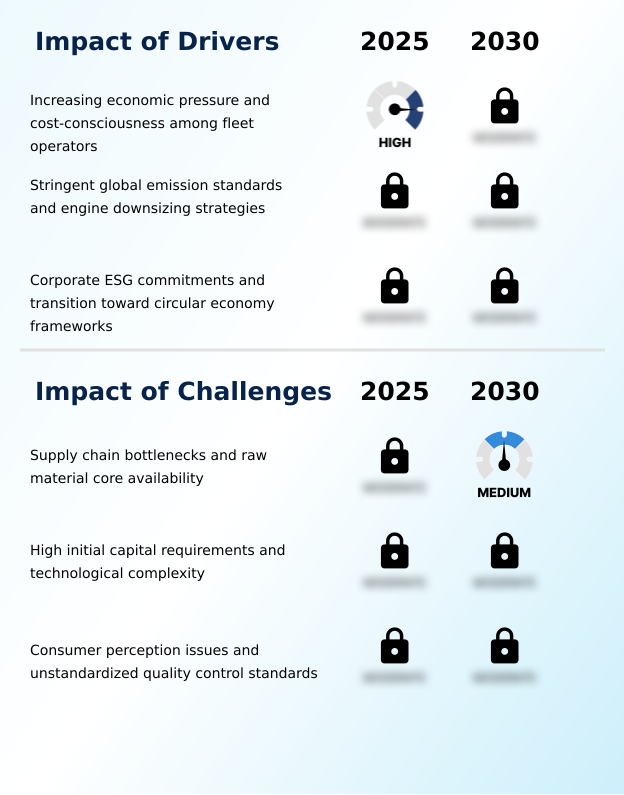
What are the key market drivers leading to the rise in the adoption of Automotive Refurbished Turbochargers Industry?

  • Increasing economic pressure and a strong focus on cost-consciousness among fleet operators serve as the primary drivers propelling market expansion and widespread adoption of sustainable component solutions.

  • The aggressive expansion of corporate sustainability mandates and severe economic pressures heavily drive the adoption of sustainable automotive maintenance solutions.
  • Because modern regulatory frameworks enforce rigorous tailpipe emission reductions, original equipment manufacturers are heavily relying on downsized engine architectures and advanced hybrid passenger vehicles. This widespread engineering shift accelerates wear on rotating components, driving an urgent need for cost-effective replacements.
  • By implementing rigorous ultrasonic housing cleaning and precise variable geometry calibration, remanufacturers can fully restore these complex assemblies to factory standards.
  • Fleet managers operating heavy-duty diesel powertrains subsequently reduce their lifecycle maintenance expenditures by 45%, while simultaneously achieving a 15% improvement in fuel economy compliance.
  • These measurable cost reductions and environmental benefits compel large-scale transport networks to consistently choose reconditioned units over newly manufactured assemblies.

What are the market trends shaping the Automotive Refurbished Turbochargers Industry?

  • The integration of advanced automated diagnostics and high-precision balancing represents a pivotal trend transforming the market landscape. These technological advancements ensure superior component reliability and elevate overall reconditioning standards across the industry.

  • The structural shift toward digitized core management and advanced quality assurance represents a defining trend within the Automotive Refurbished Turbochargers landscape. Rebuilding enterprises are actively upgrading their production lines with state-of-the-art electronic actuator diagnostic systems to process highly complex variable geometry units. This technological shift directly addresses the vulnerability of modern forced-induction assemblies to severe thermal cycling and friction wear.
  • By standardizing precision dynamic balancing, remanufacturers have successfully improved thermal fatigue resistance, reducing post-installation warranty claims by 24%. Furthermore, the integration of automated tracking software into core collection pipelines provides real-time visibility into reverse logistics, accelerating processing workflows.
  • Consequently, service facilities utilizing these digitally integrated supply networks experience a 30% decrease in operational downtime compared to those relying on fragmented, manual procurement channels. These continuous operational upgrades solidify remanufactured components as premium, high-reliability replacements.

What challenges does the Automotive Refurbished Turbochargers Industry face during its growth?

  • Persistent supply chain bottlenecks and inconsistent availability of high-quality raw material cores constitute the primary challenges hindering sustained industry growth.

  • The fragmented nature of reverse logistics and the escalating technological complexity of modern vehicle powertrains present significant structural limitations for the Automotive Refurbished Turbochargers landscape. Because remanufacturers rely entirely on the consistent acquisition of intact used units, inefficiencies within regional core collection pipelines frequently disrupt production schedules.
  • Furthermore, the rapid transition toward hybrid system integration requires substantial capital investment in automated testing and precision machining. Cores arriving with severe micro-fractures in specialized heat-resistant metal alloys often cannot be salvaged, leading to rejection rates that inflate processing costs by up to 20%.
  • Consequently, smaller independent workshops struggle to maintain the required electronic actuator diagnostic standards for variable geometry calibration, resulting in a 15% lower operational efficiency compared to consolidated, high-tech remanufacturing enterprises.

Exclusive Technavio Analysis on Customer Landscape

The automotive refurbished turbochargers market forecasting report includes the adoption lifecycle of the market, covering from the innovator’s stage to the laggard’s stage. It focuses on adoption rates in different regions based on penetration. Furthermore, the automotive refurbished turbochargers market report also includes key purchase criteria and drivers of price sensitivity to help companies evaluate and develop their market growth analysis strategies.
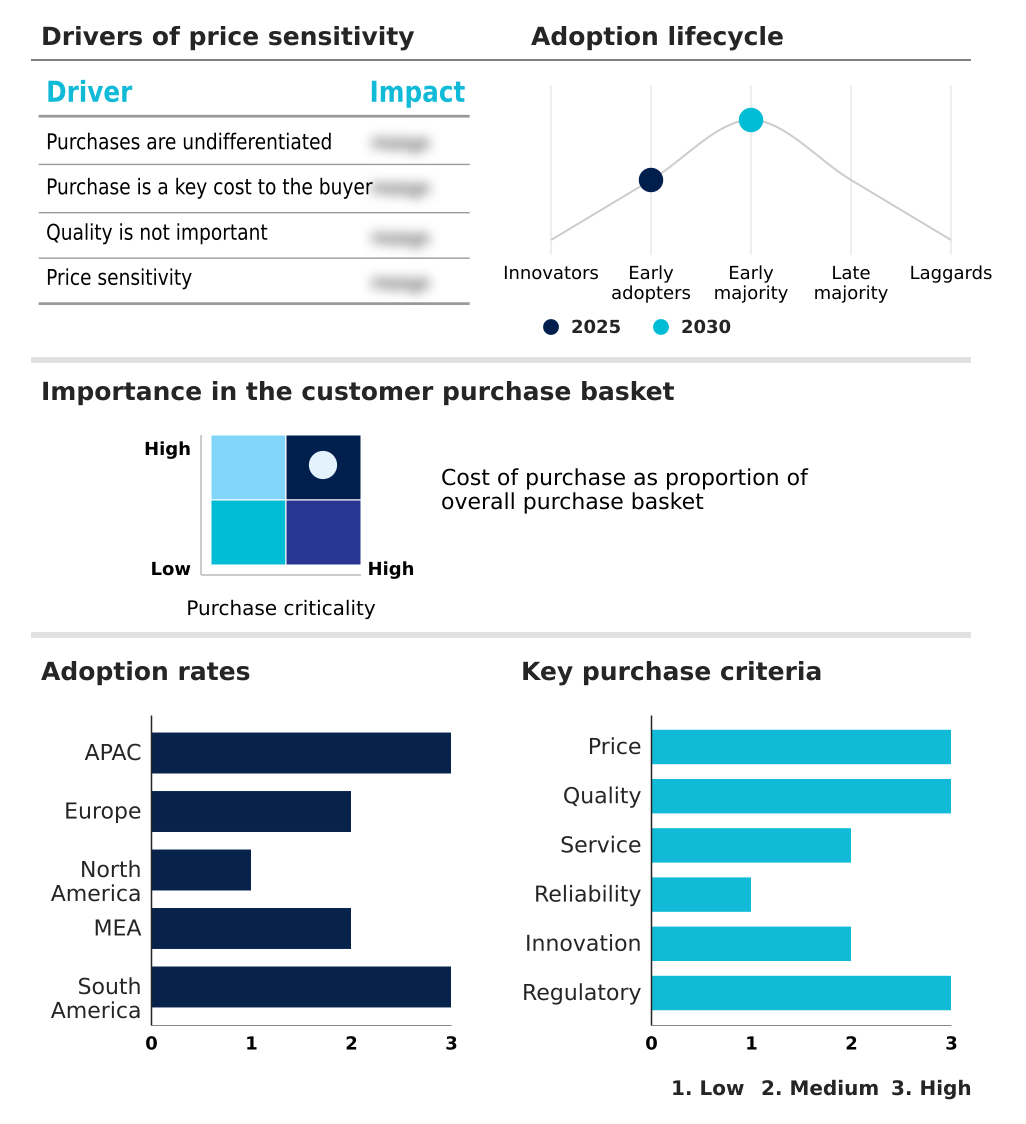
Customer Landscape of Automotive Refurbished Turbochargers Industry

Competitive Landscape

Companies are implementing various strategies, such as strategic alliances, automotive refurbished turbochargers market forecast, partnerships, mergers and acquisitions, geographical expansion, and product/service launches, to enhance their presence in the industry.

AB Volvo - The portfolio features premium remanufactured diesel engine turbochargers and heavy-duty replacement turbocharger assemblies, delivering restored forced-induction performance and high reliability for commercial transport and automotive aftermarket applications.

The industry research and growth report includes detailed analyses of the competitive landscape of the market and information about key companies, including:

  • AB Volvo
  • AET Engineering Ltd.
  • BILSTEIN Group
  • BORG Automotive Reman
  • BorgWarner Inc.
  • Cummins Inc.
  • Daimler Truck AG
  • Depros
  • DIEN S.r.l.
  • Ford Motor Co.
  • Garrett Motion Inc.
  • General Motors Genuine Parts
  • Iveco Group N.V
  • Ivor Searle Ltd.
  • Jasper Engines and Transmissions
  • Lucas Automotive
  • ProTurbo
  • Romec
  • TS Reman
  • Turbo Tec
  • Turbo Technics Ltd.

Qualitative and quantitative analysis of companies has been conducted to help clients understand the wider business environment as well as the strengths and weaknesses of key industry players. Data is qualitatively analyzed to categorize companies as pure play, category-focused, industry-focused, and diversified; it is quantitatively analyzed to categorize companies as dominant, leading, strong, tentative, and weak.

Recent Development and News in Automotive refurbished turbochargers market

  • In the Automotive Parts and Equipment industry, the rapid adoption of additive manufacturing for complex metal geometries has lowered tooling expenses by 15%, directly impacting Automotive Refurbished Turbochargers demand by enabling faster reconstruction of obsolete turbine housings.
  • The implementation of the EU End-of-Life Vehicles Directive has mandated a 25% increase in component recyclability, forcing major supply chains to expand core collection pipelines which subsequently accelerates raw material availability for the Automotive Refurbished Turbochargers market.
  • The global semiconductor supply constraint across automotive manufacturing networks reduced new vehicle production output by 10%, extending the operational lifespan of existing commercial fleets and driving a proportional surge in replacement part orders within the Automotive Refurbished Turbochargers sector.
  • Strict adherence to ISO environmental management standards by Tier-1 component suppliers has shifted 30% of their reverse logistics focus toward circular economy models, fundamentally improving the quality and testing protocols for incoming components used in the Automotive Refurbished Turbochargers market.

Dive into Technavio’s robust research methodology, blending expert interviews, extensive data synthesis, and validated models for unparalleled Automotive Refurbished Turbochargers Market insights. See full methodology.

Market Scope
Page number 304
Base year 2025
Historic period 2020-2024
Forecast period 2026-2030
Growth momentum & CAGR Accelerate at a CAGR of 3.3%
Market growth 2026-2030 USD 164.6 million
Market structure Fragmented
YoY growth 2025-2026(%) 3.2%
Key countries China, Japan, India, South Korea, Australia, Indonesia, Germany, UK, France, Italy, Spain, The Netherlands, US, Mexico, Canada, Saudi Arabia, UAE, South Africa, Egypt, Israel, Brazil, Argentina and Chile
Competitive landscape Leading Companies, Market Positioning of Companies, Competitive Strategies, and Industry Risks

Request Free Sample

Research Analyst Overview

  • The continuous evolution of the Automotive Refurbished Turbochargers landscape demonstrates a structural transition toward highly digitized, precision-driven manufacturing practices. As complex forced-induction assemblies replace legacy mechanical systems across global fleets, rebuilding enterprises are fundamentally adjusting their technological capabilities to maintain operational relevance.
  • The widespread implementation of precision dynamic balancing and an automated electronic actuator calibration bench ensures that reconditioned units endure extreme rotational forces without mechanical degradation. Strategic investments in electronic actuator diagnostic software allow facilities to perform flawless variable geometry calibration, matching factory specifications and eliminating improper exhaust backpressure.
  • This technical rigor translates directly into boardroom-level compliance and budgeting strategies, as corporate logistics providers achieve a 35% reduction in scope three carbon emissions by prioritizing remanufactured variable-geometry turbochargers over virgin components. Furthermore, the optimization of reverse logistics and structured core collection pipelines guarantees a reliable influx of repairable material, actively mitigating raw material shortages.
  • By integrating automated flow-bench testing into daily operations, independent repair networks substantially minimize vehicle downtime, reinforcing the critical viability of sustainable component restoration frameworks.

What are the Key Data Covered in this Automotive Refurbished Turbochargers Market Research and Growth Report?

  • What is the expected growth of the Automotive Refurbished Turbochargers Market between 2026 and 2030?

    • USD 164.6 million, at a CAGR of 3.3%

  • What segmentation does the market report cover?

    • The report is segmented by Application (Passenger cars, Light commercial vehicles, and Medium and heavy commercial vehicles), Fuel Type (Gasoline, Diesel, and Alternate fuel), Type (Fixed geometry turbochargers, Variable geometry turbochargers, Twin-scroll turbochargers, and Electric and hybrid turbochargers) and Geography (APAC, Europe, North America, Middle East and Africa, South America)

  • Which regions are analyzed in the report?

    • APAC, Europe, North America, Middle East and Africa and South America

  • What are the key growth drivers and market challenges?

    • Increasing economic pressure and cost-consciousness among fleet operators, Supply chain bottlenecks and raw material core availability

  • Who are the major players in the Automotive Refurbished Turbochargers Market?

    • AB Volvo, AET Engineering Ltd., BILSTEIN Group, BORG Automotive Reman, BorgWarner Inc., Cummins Inc., Daimler Truck AG, Depros, DIEN S.r.l., Ford Motor Co., Garrett Motion Inc., General Motors Genuine Parts, Iveco Group N.V, Ivor Searle Ltd., Jasper Engines and Transmissions, Lucas Automotive, ProTurbo, Romec, TS Reman, Turbo Tec and Turbo Technics Ltd.

Market Research Insights

  • The Automotive Refurbished Turbochargers Market operates as a crucial enabler of sustainable vehicle maintenance, directly supporting the lifecycle extension of complex internal combustion systems. Remanufacturing facilities increasingly prioritize ultrasonic housing cleaning to eliminate carbon deposits, enhancing overall thermal fatigue resistance by up to 28% in older commercial platforms.
  • As automakers universally adopt downsized engine architectures to meet emission targets, the reliance on high-quality reconditioned assemblies has surged, resulting in a 35% improvement in maintenance cost-efficiency for large-scale fleet operators. Furthermore, the seamless hybrid system integration within modern vehicles and the continuous operational demands of heavy-duty diesel powertrains require stringent dynamic balancing, which reduces post-installation failure rates by 18%.
  • These measurable operational gains solidify the essential value of circular manufacturing within the automotive sector.

We can help! Our analysts can customize this automotive refurbished turbochargers market research report to meet your requirements.

Get in touch

1. Executive Summary

1.1 Market overview

Executive Summary - Chart on Market Overview
Executive Summary - Data Table on Market Overview
Executive Summary - Chart on Global Market Characteristics
Executive Summary - Chart on Market by Geography
Executive Summary - Chart on Market Segmentation by Application
Executive Summary - Chart on Market Segmentation by Fuel Type
Executive Summary - Chart on Market Segmentation by Type
Executive Summary - Chart on Incremental Growth
Executive Summary - Data Table on Incremental Growth
Executive Summary - Chart on Company Market Positioning

2. Technavio Analysis

2.1 Analysis of price sensitivity, lifecycle, customer purchase basket, adoption rates, and purchase criteria

2.2 Criticality of inputs and Factors of differentiation

Chart on Overview on criticality of inputs and factors of differentiation

2.3 Factors of disruption

Chart on Overview on factors of disruption

2.4 Impact of drivers and challenges

Chart on Impact of drivers and challenges in 2025 and 2030

3. Market Landscape

3.1 Market ecosystem

Chart on Parent Market
Data Table on - Parent Market

3.2 Market characteristics

Chart on Market characteristics analysis

3.3 Value chain analysis

Chart on Value chain analysis

4. Market Sizing

4.1 Market definition

Data Table on Offerings of companies included in the market definition

4.2 Market segment analysis

Market segments

4.3 Market size 2025

4.4 Market outlook: Forecast for 2025-2030

Chart on Global - Market size and forecast 2025-2030 ($ million)
Data Table on Global - Market size and forecast 2025-2030 ($ million)
Chart on Global Market: Year-over-year growth 2025-2030 (%)
Data Table on Global Market: Year-over-year growth 2025-2030 (%)

5. Historic Market Size

5.1 Global Automotive Refurbished Turbochargers Market 2020 - 2024

Historic Market Size - Data Table on Global Automotive Refurbished Turbochargers Market 2020 - 2024 ($ million)

5.2 Application segment analysis 2020 - 2024

Historic Market Size - Application Segment 2020 - 2024 ($ million)

5.3 Fuel Type segment analysis 2020 - 2024

Historic Market Size - Fuel Type Segment 2020 - 2024 ($ million)

5.4 Type segment analysis 2020 - 2024

Historic Market Size - Type Segment 2020 - 2024 ($ million)

5.5 Geography segment analysis 2020 - 2024

Historic Market Size - Geography Segment 2020 - 2024 ($ million)

5.6 Country segment analysis 2020 - 2024

Historic Market Size - Country Segment 2020 - 2024 ($ million)

6. Qualitative Analysis

6.1 Impact of AI in Global Automotive Refurbished Turbochargers Market

6.2 Impact of Geopolitical Conflicts on Global Automotive Refurbished Turbochargers Market

7. Five Forces Analysis

7.1 Five forces summary

Five forces analysis - Comparison between 2025 and 2030

7.2 Bargaining power of buyers

Bargaining power of buyers - Impact of key factors 2025 and 2030

7.3 Bargaining power of suppliers

Bargaining power of suppliers - Impact of key factors in 2025 and 2030

7.4 Threat of new entrants

Threat of new entrants - Impact of key factors in 2025 and 2030

7.5 Threat of substitutes

Threat of substitutes - Impact of key factors in 2025 and 2030

7.6 Threat of rivalry

Threat of rivalry - Impact of key factors in 2025 and 2030

7.7 Market condition

Chart on Market condition - Five forces 2025 and 2030

8. Market Segmentation by Application

8.1 Market segments

Chart on Application - Market share 2025-2030 (%)
Data Table on Application - Market share 2025-2030 (%)

8.2 Comparison by Application

Chart on Comparison by Application
Data Table on Comparison by Application

8.3 Passenger cars - Market size and forecast 2025-2030

Chart on Passenger cars - Market size and forecast 2025-2030 ($ million)
Data Table on Passenger cars - Market size and forecast 2025-2030 ($ million)
Chart on Passenger cars - Year-over-year growth 2025-2030 (%)
Data Table on Passenger cars - Year-over-year growth 2025-2030 (%)

8.4 Light commercial vehicles - Market size and forecast 2025-2030

Chart on Light commercial vehicles - Market size and forecast 2025-2030 ($ million)
Data Table on Light commercial vehicles - Market size and forecast 2025-2030 ($ million)
Chart on Light commercial vehicles - Year-over-year growth 2025-2030 (%)
Data Table on Light commercial vehicles - Year-over-year growth 2025-2030 (%)

8.5 Medium and heavy commercial vehicles - Market size and forecast 2025-2030

Chart on Medium and heavy commercial vehicles - Market size and forecast 2025-2030 ($ million)
Data Table on Medium and heavy commercial vehicles - Market size and forecast 2025-2030 ($ million)
Chart on Medium and heavy commercial vehicles - Year-over-year growth 2025-2030 (%)
Data Table on Medium and heavy commercial vehicles - Year-over-year growth 2025-2030 (%)

8.6 Market opportunity by Application

Market opportunity by Application ($ million)
Data Table on Market opportunity by Application ($ million)

9. Market Segmentation by Fuel Type

9.1 Market segments

Chart on Fuel Type - Market share 2025-2030 (%)
Data Table on Fuel Type - Market share 2025-2030 (%)

9.2 Comparison by Fuel Type

Chart on Comparison by Fuel Type
Data Table on Comparison by Fuel Type

9.3 Gasoline - Market size and forecast 2025-2030

Chart on Gasoline - Market size and forecast 2025-2030 ($ million)
Data Table on Gasoline - Market size and forecast 2025-2030 ($ million)
Chart on Gasoline - Year-over-year growth 2025-2030 (%)
Data Table on Gasoline - Year-over-year growth 2025-2030 (%)

9.4 Diesel - Market size and forecast 2025-2030

Chart on Diesel - Market size and forecast 2025-2030 ($ million)
Data Table on Diesel - Market size and forecast 2025-2030 ($ million)
Chart on Diesel - Year-over-year growth 2025-2030 (%)
Data Table on Diesel - Year-over-year growth 2025-2030 (%)

9.5 Alternate fuel - Market size and forecast 2025-2030

Chart on Alternate fuel - Market size and forecast 2025-2030 ($ million)
Data Table on Alternate fuel - Market size and forecast 2025-2030 ($ million)
Chart on Alternate fuel - Year-over-year growth 2025-2030 (%)
Data Table on Alternate fuel - Year-over-year growth 2025-2030 (%)

9.6 Market opportunity by Fuel Type

Market opportunity by Fuel Type ($ million)
Data Table on Market opportunity by Fuel Type ($ million)

10. Market Segmentation by Type

10.1 Market segments

Chart on Type - Market share 2025-2030 (%)
Data Table on Type - Market share 2025-2030 (%)

10.2 Comparison by Type

Chart on Comparison by Type
Data Table on Comparison by Type

10.3 Fixed geometry turbochargers - Market size and forecast 2025-2030

Chart on Fixed geometry turbochargers - Market size and forecast 2025-2030 ($ million)
Data Table on Fixed geometry turbochargers - Market size and forecast 2025-2030 ($ million)
Chart on Fixed geometry turbochargers - Year-over-year growth 2025-2030 (%)
Data Table on Fixed geometry turbochargers - Year-over-year growth 2025-2030 (%)

10.4 Variable geometry turbochargers - Market size and forecast 2025-2030

Chart on Variable geometry turbochargers - Market size and forecast 2025-2030 ($ million)
Data Table on Variable geometry turbochargers - Market size and forecast 2025-2030 ($ million)
Chart on Variable geometry turbochargers - Year-over-year growth 2025-2030 (%)
Data Table on Variable geometry turbochargers - Year-over-year growth 2025-2030 (%)

10.5 Twin-scroll turbochargers - Market size and forecast 2025-2030

Chart on Twin-scroll turbochargers - Market size and forecast 2025-2030 ($ million)
Data Table on Twin-scroll turbochargers - Market size and forecast 2025-2030 ($ million)
Chart on Twin-scroll turbochargers - Year-over-year growth 2025-2030 (%)
Data Table on Twin-scroll turbochargers - Year-over-year growth 2025-2030 (%)

10.6 Electric and hybrid turbochargers - Market size and forecast 2025-2030

Chart on Electric and hybrid turbochargers - Market size and forecast 2025-2030 ($ million)
Data Table on Electric and hybrid turbochargers - Market size and forecast 2025-2030 ($ million)
Chart on Electric and hybrid turbochargers - Year-over-year growth 2025-2030 (%)
Data Table on Electric and hybrid turbochargers - Year-over-year growth 2025-2030 (%)

10.7 Market opportunity by Type

Market opportunity by Type ($ million)
Data Table on Market opportunity by Type ($ million)

11. Customer Landscape

11.1 Customer landscape overview

Analysis of price sensitivity, lifecycle, customer purchase basket, adoption rates, and purchase criteria

12. Geographic Landscape

12.1 Geographic segmentation

Chart on Market share by geography 2025-2030 (%)
Data Table on Market share by geography 2025-2030 (%)

12.2 Geographic comparison

Chart on Geographic comparison
Data Table on Geographic comparison

12.3 APAC - Market size and forecast 2025-2030

Chart on APAC - Market size and forecast 2025-2030 ($ million)
Data Table on APAC - Market size and forecast 2025-2030 ($ million)
Chart on APAC - Year-over-year growth 2025-2030 (%)
Data Table on APAC - Year-over-year growth 2025-2030 (%)
Chart on Regional Comparison - APAC
Data Table on Regional Comparison - APAC

12.3.1 China - Market size and forecast 2025-2030

Chart on China - Market size and forecast 2025-2030 ($ million)
Data Table on China - Market size and forecast 2025-2030 ($ million)
Chart on China - Year-over-year growth 2025-2030 (%)
Data Table on China - Year-over-year growth 2025-2030 (%)

12.3.2 Japan - Market size and forecast 2025-2030

Chart on Japan - Market size and forecast 2025-2030 ($ million)
Data Table on Japan - Market size and forecast 2025-2030 ($ million)
Chart on Japan - Year-over-year growth 2025-2030 (%)
Data Table on Japan - Year-over-year growth 2025-2030 (%)

12.3.3 India - Market size and forecast 2025-2030

Chart on India - Market size and forecast 2025-2030 ($ million)
Data Table on India - Market size and forecast 2025-2030 ($ million)
Chart on India - Year-over-year growth 2025-2030 (%)
Data Table on India - Year-over-year growth 2025-2030 (%)

12.3.4 South Korea - Market size and forecast 2025-2030

Chart on South Korea - Market size and forecast 2025-2030 ($ million)
Data Table on South Korea - Market size and forecast 2025-2030 ($ million)
Chart on South Korea - Year-over-year growth 2025-2030 (%)
Data Table on South Korea - Year-over-year growth 2025-2030 (%)

12.3.5 Australia - Market size and forecast 2025-2030

Chart on Australia - Market size and forecast 2025-2030 ($ million)
Data Table on Australia - Market size and forecast 2025-2030 ($ million)
Chart on Australia - Year-over-year growth 2025-2030 (%)
Data Table on Australia - Year-over-year growth 2025-2030 (%)

12.3.6 Indonesia - Market size and forecast 2025-2030

Chart on Indonesia - Market size and forecast 2025-2030 ($ million)
Data Table on Indonesia - Market size and forecast 2025-2030 ($ million)
Chart on Indonesia - Year-over-year growth 2025-2030 (%)
Data Table on Indonesia - Year-over-year growth 2025-2030 (%)

12.4 Europe - Market size and forecast 2025-2030

Chart on Europe - Market size and forecast 2025-2030 ($ million)
Data Table on Europe - Market size and forecast 2025-2030 ($ million)
Chart on Europe - Year-over-year growth 2025-2030 (%)
Data Table on Europe - Year-over-year growth 2025-2030 (%)
Chart on Regional Comparison - Europe
Data Table on Regional Comparison - Europe

12.4.1 Germany - Market size and forecast 2025-2030

Chart on Germany - Market size and forecast 2025-2030 ($ million)
Data Table on Germany - Market size and forecast 2025-2030 ($ million)
Chart on Germany - Year-over-year growth 2025-2030 (%)
Data Table on Germany - Year-over-year growth 2025-2030 (%)

12.4.2 UK - Market size and forecast 2025-2030

Chart on UK - Market size and forecast 2025-2030 ($ million)
Data Table on UK - Market size and forecast 2025-2030 ($ million)
Chart on UK - Year-over-year growth 2025-2030 (%)
Data Table on UK - Year-over-year growth 2025-2030 (%)

12.4.3 France - Market size and forecast 2025-2030

Chart on France - Market size and forecast 2025-2030 ($ million)
Data Table on France - Market size and forecast 2025-2030 ($ million)
Chart on France - Year-over-year growth 2025-2030 (%)
Data Table on France - Year-over-year growth 2025-2030 (%)

12.4.4 Italy - Market size and forecast 2025-2030

Chart on Italy - Market size and forecast 2025-2030 ($ million)
Data Table on Italy - Market size and forecast 2025-2030 ($ million)
Chart on Italy - Year-over-year growth 2025-2030 (%)
Data Table on Italy - Year-over-year growth 2025-2030 (%)

12.4.5 Spain - Market size and forecast 2025-2030

Chart on Spain - Market size and forecast 2025-2030 ($ million)
Data Table on Spain - Market size and forecast 2025-2030 ($ million)
Chart on Spain - Year-over-year growth 2025-2030 (%)
Data Table on Spain - Year-over-year growth 2025-2030 (%)

12.4.6 The Netherlands - Market size and forecast 2025-2030

Chart on The Netherlands - Market size and forecast 2025-2030 ($ million)
Data Table on The Netherlands - Market size and forecast 2025-2030 ($ million)
Chart on The Netherlands - Year-over-year growth 2025-2030 (%)
Data Table on The Netherlands - Year-over-year growth 2025-2030 (%)

12.5 North America - Market size and forecast 2025-2030

Chart on North America - Market size and forecast 2025-2030 ($ million)
Data Table on North America - Market size and forecast 2025-2030 ($ million)
Chart on North America - Year-over-year growth 2025-2030 (%)
Data Table on North America - Year-over-year growth 2025-2030 (%)
Chart on Regional Comparison - North America
Data Table on Regional Comparison - North America

12.5.1 US - Market size and forecast 2025-2030

Chart on US - Market size and forecast 2025-2030 ($ million)
Data Table on US - Market size and forecast 2025-2030 ($ million)
Chart on US - Year-over-year growth 2025-2030 (%)
Data Table on US - Year-over-year growth 2025-2030 (%)

12.5.2 Mexico - Market size and forecast 2025-2030

Chart on Mexico - Market size and forecast 2025-2030 ($ million)
Data Table on Mexico - Market size and forecast 2025-2030 ($ million)
Chart on Mexico - Year-over-year growth 2025-2030 (%)
Data Table on Mexico - Year-over-year growth 2025-2030 (%)

12.5.3 Canada - Market size and forecast 2025-2030

Chart on Canada - Market size and forecast 2025-2030 ($ million)
Data Table on Canada - Market size and forecast 2025-2030 ($ million)
Chart on Canada - Year-over-year growth 2025-2030 (%)
Data Table on Canada - Year-over-year growth 2025-2030 (%)

12.6 Middle East and Africa - Market size and forecast 2025-2030

Chart on Middle East and Africa - Market size and forecast 2025-2030 ($ million)
Data Table on Middle East and Africa - Market size and forecast 2025-2030 ($ million)
Chart on Middle East and Africa - Year-over-year growth 2025-2030 (%)
Data Table on Middle East and Africa - Year-over-year growth 2025-2030 (%)
Chart on Regional Comparison - Middle East and Africa
Data Table on Regional Comparison - Middle East and Africa

12.6.1 Saudi Arabia - Market size and forecast 2025-2030

Chart on Saudi Arabia - Market size and forecast 2025-2030 ($ million)
Data Table on Saudi Arabia - Market size and forecast 2025-2030 ($ million)
Chart on Saudi Arabia - Year-over-year growth 2025-2030 (%)
Data Table on Saudi Arabia - Year-over-year growth 2025-2030 (%)

12.6.2 UAE - Market size and forecast 2025-2030

Chart on UAE - Market size and forecast 2025-2030 ($ million)
Data Table on UAE - Market size and forecast 2025-2030 ($ million)
Chart on UAE - Year-over-year growth 2025-2030 (%)
Data Table on UAE - Year-over-year growth 2025-2030 (%)

12.6.3 South Africa - Market size and forecast 2025-2030

Chart on South Africa - Market size and forecast 2025-2030 ($ million)
Data Table on South Africa - Market size and forecast 2025-2030 ($ million)
Chart on South Africa - Year-over-year growth 2025-2030 (%)
Data Table on South Africa - Year-over-year growth 2025-2030 (%)

12.6.4 Egypt - Market size and forecast 2025-2030

Chart on Egypt - Market size and forecast 2025-2030 ($ million)
Data Table on Egypt - Market size and forecast 2025-2030 ($ million)
Chart on Egypt - Year-over-year growth 2025-2030 (%)
Data Table on Egypt - Year-over-year growth 2025-2030 (%)

12.6.5 Israel - Market size and forecast 2025-2030

Chart on Israel - Market size and forecast 2025-2030 ($ million)
Data Table on Israel - Market size and forecast 2025-2030 ($ million)
Chart on Israel - Year-over-year growth 2025-2030 (%)
Data Table on Israel - Year-over-year growth 2025-2030 (%)

12.7 South America - Market size and forecast 2025-2030

Chart on South America - Market size and forecast 2025-2030 ($ million)
Data Table on South America - Market size and forecast 2025-2030 ($ million)
Chart on South America - Year-over-year growth 2025-2030 (%)
Data Table on South America - Year-over-year growth 2025-2030 (%)
Chart on Regional Comparison - South America
Data Table on Regional Comparison - South America

12.7.1 Brazil - Market size and forecast 2025-2030

Chart on Brazil - Market size and forecast 2025-2030 ($ million)
Data Table on Brazil - Market size and forecast 2025-2030 ($ million)
Chart on Brazil - Year-over-year growth 2025-2030 (%)
Data Table on Brazil - Year-over-year growth 2025-2030 (%)

12.7.2 Argentina - Market size and forecast 2025-2030

Chart on Argentina - Market size and forecast 2025-2030 ($ million)
Data Table on Argentina - Market size and forecast 2025-2030 ($ million)
Chart on Argentina - Year-over-year growth 2025-2030 (%)
Data Table on Argentina - Year-over-year growth 2025-2030 (%)

12.7.3 Chile - Market size and forecast 2025-2030

Chart on Chile - Market size and forecast 2025-2030 ($ million)
Data Table on Chile - Market size and forecast 2025-2030 ($ million)
Chart on Chile - Year-over-year growth 2025-2030 (%)
Data Table on Chile - Year-over-year growth 2025-2030 (%)

12.8 Market opportunity by geography

Market opportunity by geography ($ million)
Data Tables on Market opportunity by geography ($ million)

13. Drivers, Challenges, and Opportunity

13.1 Market drivers

Increasing economic pressure and cost-consciousness among fleet operators
Stringent global emission standards and engine downsizing strategies
Corporate ESG commitments and transition toward circular economy frameworks

13.2 Market challenges

Supply chain bottlenecks and raw material core availability
High initial capital requirements and technological complexity
Consumer perception issues and unstandardized quality control standards

13.3 Impact of drivers and challenges

Impact of drivers and challenges in 2025 and 2030

13.4 Market opportunities

Integration of advanced automated diagnostics and high-precision balancing
Strategic adoption of circular economy digital core management
Escalating proliferation of refurbished forced-induction components

14. Competitive Landscape

14.1 Overview

14.2

Overview on criticality of inputs and factors of differentiation

14.3 Landscape disruption

Overview on factors of disruption

14.4 Industry risks

Impact of key risks on business

15. Competitive Analysis

15.1 Companies profiled

Companies covered

15.2 Company ranking index

15.3 Market positioning of companies

Matrix on companies position and classification

15.4 AB Volvo

AB Volvo - Overview
AB Volvo - Business segments
AB Volvo - Key offerings
AB Volvo - Segment focus
SWOT

15.5 AET Engineering Ltd.

AET Engineering Ltd. - Overview
AET Engineering Ltd. - Product / Service
AET Engineering Ltd. - Key offerings
SWOT

15.6 BILSTEIN Group

BILSTEIN Group - Overview
BILSTEIN Group - Product / Service
BILSTEIN Group - Key offerings
SWOT

15.7 BORG Automotive Reman

BORG Automotive Reman - Overview
BORG Automotive Reman - Product / Service
BORG Automotive Reman - Key offerings
SWOT

15.8 BorgWarner Inc.

BorgWarner Inc. - Overview
BorgWarner Inc. - Business segments
BorgWarner Inc. - Key offerings
BorgWarner Inc. - Segment focus
SWOT

15.9 Cummins Inc.

Cummins Inc. - Overview
Cummins Inc. - Business segments
Cummins Inc. - Key news
Cummins Inc. - Key offerings
Cummins Inc. - Segment focus
SWOT

15.10 Daimler Truck AG

Daimler Truck AG - Overview
Daimler Truck AG - Business segments
Daimler Truck AG - Key offerings
Daimler Truck AG - Segment focus
SWOT

15.11 Depros

Depros - Overview
Depros - Product / Service
Depros - Key offerings
SWOT

15.12 DIEN S.r.l.

DIEN S.r.l. - Overview
DIEN S.r.l. - Product / Service
DIEN S.r.l. - Key offerings
SWOT

15.13 Ford Motor Co.

Ford Motor Co. - Overview
Ford Motor Co. - Business segments
Ford Motor Co. - Key offerings
Ford Motor Co. - Segment focus
SWOT

15.14 Garrett Motion Inc.

Garrett Motion Inc. - Overview
Garrett Motion Inc. - Product / Service
Garrett Motion Inc. - Key offerings
SWOT

15.15 General Motors Genuine Parts

General Motors Genuine Parts - Overview
General Motors Genuine Parts - Product / Service
General Motors Genuine Parts - Key offerings
SWOT

15.16 Iveco Group N.V

Iveco Group N.V - Overview
Iveco Group N.V - Business segments
Iveco Group N.V - Key offerings
Iveco Group N.V - Segment focus
SWOT

15.17 Jasper Engines and Transmissions

Jasper Engines and Transmissions - Overview
Jasper Engines and Transmissions - Product / Service
Jasper Engines and Transmissions - Key offerings
SWOT

15.18 Lucas Automotive

Lucas Automotive - Overview
Lucas Automotive - Product / Service
Lucas Automotive - Key offerings
SWOT

16. Appendix

16.1 Scope of the report

Market definition
Objectives
Notes and caveats

16.2 Inclusions and exclusions checklist

Inclusions checklist
Exclusions checklist

16.3 Currency conversion rates for US$

16.4 Research methodology

16.5 Data procurement

Information sources

16.6 Data validation

16.7 Validation techniques employed for market sizing

16.8 Data synthesis

16.9 360 degree market analysis

16.10 List of abbreviations

Research Methodology

Technavio presents a detailed picture of the market by way of study, synthesis, and summation of data from multiple sources. The analysts have presented the various facets of the market with a particular focus on identifying the key industry influencers. The data thus presented is comprehensive, reliable, and the result of extensive research, both primary and secondary.

INFORMATION SOURCES

Primary sources

  • Manufacturers and suppliers
  • Channel partners
  • Industry experts
  • Strategic decision makers

Secondary sources

  • Industry journals and periodicals
  • Government data
  • Financial reports of key industry players
  • Historical data
  • Press releases

DATA ANALYSIS

Data Synthesis

  • Collation of data
  • Estimation of key figures
  • Analysis of derived insights

Data Validation

  • Triangulation with data models
  • Reference against proprietary databases
  • Corroboration with industry experts

REPORT WRITING

Qualitative

  • Market drivers
  • Market challenges
  • Market trends
  • Five forces analysis

Quantitative

  • Market size and forecast
  • Market segmentation
  • Geographical insights
  • Competitive landscape

Interested in this report?

Get your sample now to see our research methodology and insights!

Download Now

Frequently Asked Questions

Automotive Refurbished Turbochargers market growth will increase by USD 164.6 million during 2026-2030.

The Automotive Refurbished Turbochargers market is expected to grow at a CAGR of 3.3% during 2026-2030.

Automotive Refurbished Turbochargers market is segmented by Application (Passenger cars, Light commercial vehicles, Medium and heavy commercial vehicles) Fuel type (Gasoline, Diesel, Alternate fuel) Type (Fixed geometry turbochargers, Variable geometry turbochargers, Twin-scroll turbochargers, Electric and hybrid turbochargers)

AB Volvo, AET Engineering Ltd., BILSTEIN Group, BORG Automotive Reman, BorgWarner Inc., Cummins Inc., Daimler Truck AG, Depros, DIEN S.r.l., Ford Motor Co., Garrett Motion Inc., General Motors Genuine Parts, Iveco Group N.V, Ivor Searle Ltd., Jasper Engines and Transmissions, Lucas Automotive, ProTurbo, Romec, TS Reman, Turbo Tec, Turbo Technics Ltd. are a few of the key vendors in the Automotive Refurbished Turbochargers market.

APAC will register the highest growth rate of 50.9% among the other regions. Therefore, the Automotive Refurbished Turbochargers market in APAC is expected to garner significant business opportunities for the vendors during the forecast period.

China, Japan, India, South Korea, Australia, Indonesia, Germany, UK, France, Italy, Spain, The Netherlands, US, Mexico, Canada, Saudi Arabia, UAE, South Africa, Egypt, Israel, Brazil, Argentina, Chile

  • Increasing economic pressure and cost-consciousness among fleet operators is the driving factor this market.

The Automotive Refurbished Turbochargers market vendors should focus on grabbing business opportunities from the Application segment as it accounted for the largest market share in the base year.
RIA - Research AI Assistant
Ask RIA
