
Automotive Repair And Maintenance Services Market Size 2025-2029
The automotive repair and maintenance services market size is forecast to increase by USD 154.1 billion, at a CAGR of 5.7% between 2024 and 2029.
- The market is shaped by three key drivers and challenges. Firstly, the increasing emphasis on passenger safety is fueling market growth, as consumers prioritize regular vehicle inspections and maintenance to ensure the well-being of their families. Secondly, the surge in popularity of electric vehicles is creating new opportunities for service providers, as these vehicles require specialized expertise and equipment for repair and maintenance. However, the market also faces challenges, including the growing use of public transport and ride-sharing services, which may reduce the demand for personal vehicle maintenance.
- Additionally, the increasing complexity of modern vehicles poses a significant challenge, as repair and maintenance require advanced technical skills and knowledge. Companies in this market must adapt to these trends and challenges by investing in training and technology to meet evolving consumer needs and expectations.
What will be the Size of the Automotive Repair And Maintenance Services Market during the forecast period?
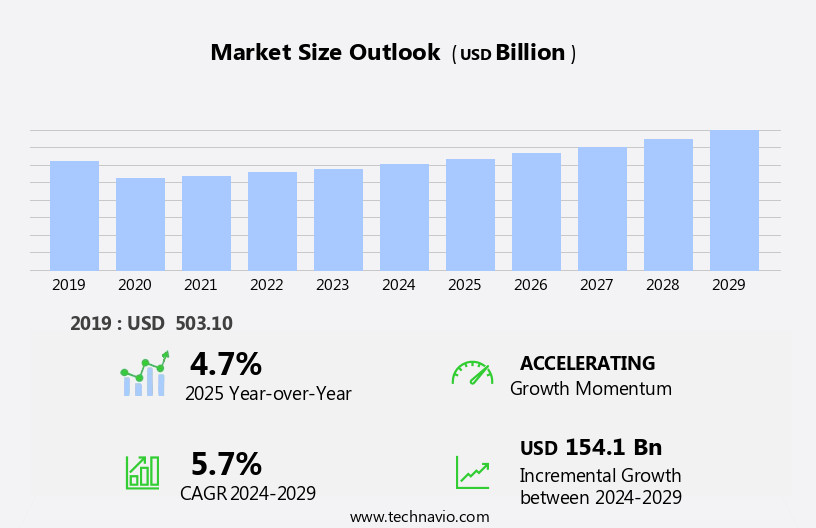
Explore in-depth regional segment analysis with market size data - historical 2019-2023 and forecasts 2025-2029 - in the full report.
Request Free Sample
The market continues to evolve, with ongoing dynamics shaping various sectors. From water pump replacement and axle repair to muffler replacement and shop equipment, the industry remains in a constant state of change. Rotor resurfacing, brake repair, and clutch repair are essential services that keep vehicles running smoothly. Synthetic blend oil, mass airflow sensors, and brake pad replacement are just a few examples of the advanced technologies integrated into modern vehicles. Mechanic certification, windshield repair, and online booking are innovations that enhance the customer experience. Electrical system repair, ball joint replacement, and engine tune-up are crucial services that ensure optimal vehicle performance.
Transmission fluid, alternator replacement, and catalytic converter repairs are essential for maintaining the longevity of a vehicle's powertrain. The industry's continuous evolution is also reflected in the emergence of specialized tools, such as OBD-II scanners and diagnostic scan tools. Preventative maintenance practices, like oil changes, air conditioning repair, and fluid flushes, are increasingly popular as vehicle owners seek to minimize repair costs and extend the life of their vehicles. Moreover, safety regulations continue to drive advancements in cooling system repair, motor oil, and exhaust system repair. The integration of sensor replacement, steering system repair, and suspension repair into routine maintenance schedules is transforming the industry's approach to vehicle upkeep.
In conclusion, the market is characterized by continuous dynamism, with a diverse range of services and technologies shaping its evolution. From water pump replacement to online booking, the industry remains focused on meeting the evolving needs of vehicle owners and ensuring optimal performance and safety.
How is this Automotive Repair And Maintenance Services Industry segmented?
The automotive repair and maintenance services industry research report provides comprehensive data (region-wise segment analysis), with forecasts and estimates in "USD billion" for the period 2025-2029, as well as historical data from 2019-2023 for the following segments.
- Type
- ICE
- Electric
- Service
- Tires
- Wear and tear parts
- Collision body
- Batteries
- Others
- Vehicle Type
- Passenger vehicle
- Commercial vehicle
- Channel
- Online booking and on-demand services
- Walk-in service centers
- Subscription-based maintenance plans
- Geography
- North America
- US
- Canada
- Europe
- France
- Germany
- Italy
- UK
- APAC
- China
- India
- Japan
- South Korea
- Rest of World (ROW)
- North America
By Type Insights
The ice segment is estimated to witness significant growth during the forecast period.
The market encompasses various offerings, including spring replacement, tire balancing, timing belt replacement, body repair, driveshaft repair, radiator repair, control arm replacement, appointment scheduling, tire rotation, adherence to safety regulations, cooling system repair, motor oil changes, automatic transmission service, exhaust pipe repair, paint repair, starter replacement, catalytic converter repair, ignition system repair, strut replacement, OBD-II scanner utilization, fuel system repair, wheel alignment, caliper replacement, suspension repair, sensor replacement, steering system repair, lift equipment usage, oil changes, air conditioning repair, warranty claims processing, engine diagnostics, fuel injector cleaning, oxygen sensor replacement, wheel bearing replacement, thermostat replacement, transmission service, differential fluid replacement, synthetic oil utilization, exhaust system repair, repair manuals, vehicle inspections, wiring harness repair, battery replacement, mobile repair services, fluid flushes, diagnostic scan tool usage, power steering pump and fluid replacement, manual and CVT transmission service, collision repair, spark plug replacement, customer service, specialized tools application, serpentine belt replacement, preventative maintenance, shock absorber replacement, water pump replacement, axle repair, muffler replacement, shop equipment usage, rotor resurfacing, brake repair, clutch repair, synthetic blend oil usage, mass airflow sensor replacement, brake pad replacement, mechanic certification, windshield repair, online booking, electrical system repair, and ball joint replacement.
The Internal Combustion Engine (ICE) segment has experienced significant growth and is anticipated to continue expanding due to the increasing demand for passenger and commercial vehicles in both developed and developing countries. The scarcity of electric vehicle charging infrastructure globally is also a contributing factor to the expansion of the ICE segment. Furthermore, the rising popularity of petrol vehicles and the increasing production of oil and shale gas are additional factors fueling the growth of the ICE segment. The aging of vehicles positively impacts industry growth as older vehicles require more frequent repairs and replacements. Additionally, the growing demand for shared mobility is driving up the annual maintenance costs of taxis or shared vehicles due to increased annual mileage.

The ICE segment was valued at USD 393.60 billion in 2019 and showed a gradual increase during the forecast period.
Regional Analysis
APAC is estimated to contribute 33% to the growth of the global market during the forecast period.Technavio’s analysts have elaborately explained the regional trends and drivers that shape the market during the forecast period.

The market in North America is experiencing growth due to the expanding automobile industry in the region. With a high concentration of passenger and commercial vehicle manufacturers in the US and Canada, the market is poised for significant expansion. The increasing production rate of vehicles, driven by the rising preference for fuel-efficient models, particularly mid- and compact-sized crossovers, is fueling this growth. Automotive repair and maintenance services encompass various offerings, including spring replacement, tire balancing, timing belt replacement, body repair, driveshaft repair, radiator repair, control arm replacement, appointment scheduling, tire rotation, and safety regulations compliance. Additionally, services such as cooling system repair, motor oil changes, automatic transmission repairs, exhaust pipe repair, paint repair, starter replacement, catalytic converter repairs, ignition system repairs, strut replacement, OBD-II scanner diagnostics, fuel system repairs, wheel alignment, caliper replacement, suspension repairs, sensor replacements, steering system repairs, lift equipment usage, air conditioning repairs, warranty claims processing, engine diagnostics, fuel injector cleanings, oxygen sensor replacements, wheel bearing replacements, thermostat replacements, transmission services, differential fluid changes, synthetic oil usage, exhaust system repairs, repair manuals, vehicle inspections, wiring harness repairs, battery replacements, mobile repair services, fluid flushes, diagnostic scan tool usage, power steering pump and fluid replacement, manual and CVT transmission repairs, collision repairs, spark plug replacements, customer service, specialized tools utilization, serpentine belt replacements, preventative maintenance, shock absorber replacements, water pump replacements, axle repairs, muffler replacements, shop equipment usage, rotor resurfacing, brake repairs, clutch repairs, synthetic blend oil usage, mass airflow sensor replacements, brake pad replacements, mechanic certifications, windshield repairs, online booking, electrical system repairs, and ball joint replacements are in high demand.
These services are essential for maintaining the longevity and optimal performance of vehicles. The market is further driven by the increasing complexity of modern vehicles, which require specialized tools and expertise for repairs. The adoption of advanced technologies, such as OBD-II scanners and electronic diagnostic systems, is also contributing to the growth of the market. Moreover, the increasing awareness of safety regulations and the importance of regular vehicle maintenance are further boosting the demand for automotive repair and maintenance services.
Market Dynamics
Our researchers analyzed the data with 2024 as the base year, along with the key drivers, trends, and challenges. A holistic analysis of drivers will help companies refine their marketing strategies to gain a competitive advantage.
In the market, consumers seek reliable solutions to keep their vehicles in optimal condition. From engine diagnostics and oil changes to brake repairs and tire alignments, these essential services ensure safe and efficient vehicle performance. Regular maintenance, including air filter replacements and transmission flushes, prolongs a car's lifespan and saves costs in the long run. Additionally, electronic services like battery testing and computer system checks address modern vehicle needs. Collision repair, paint jobs, and bodywork restore damaged vehicles to their former glory. With expertise in various makes and models, skilled technicians employ advanced tools and techniques to deliver top-notch automotive repair and maintenance services.
What are the key market drivers leading to the rise in the adoption of Automotive Repair And Maintenance Services Industry?
- Ensuring the safety of passengers is the primary priority and significant market driver in the transportation industry.
- Maintaining a vehicle in optimal condition is essential for ensuring road safety and reducing the likelihood of unexpected breakdowns. Neglected components can increase the risk of accidents and hinder proper vehicle performance. Several automotive parts necessitate regular service and maintenance to ensure vehicle safety and efficiency. Exhaust systems require periodic inspections and repairs to prevent harmful emissions and maintain engine performance. Repair manuals and specialized tools are necessary for exhaust system repair. Wiring harnesses, which connect various electrical components, may deteriorate over time, necessitating replacement. Battery replacement is crucial to ensure the vehicle's starting system functions correctly.
- Mobile repair services are convenient for addressing issues on the go, while fluid flushes help maintain the longevity of power steering pumps and power steering fluid. Manual transmissions and continuously variable transmissions (CVT) require periodic maintenance to maintain smooth shifting and extend their lifespan. Collision repair is essential after an accident to restore the vehicle's structural integrity and safety. Spark plug replacement ensures optimal engine performance and fuel efficiency. Customer service is vital in the automotive repair industry, as it enhances the overall experience and builds trust between the service provider and the customer.
- Preventative maintenance, such as serpentine belt replacement, shock absorber replacement, and diagnostic scan tool usage, helps identify potential issues before they escalate into costly repairs. By focusing on these essential services and components, vehicle owners can ensure their vehicles remain safe, reliable, and efficient.
What are the market trends shaping the Automotive Repair And Maintenance Services Industry?
- The increasing demand for electric vehicles represents a significant market trend. This shift towards sustainable transportation solutions is a noteworthy development in the automotive industry.
- The market encompasses various offerings, including water pump replacement, axle repair, muffler replacement, rotor resurfacing, brake repair, clutch repair, synthetic blend oil change, mass airflow sensor diagnosis, brake pad replacement, mechanic certification training, windshield repair, online booking systems, electrical system repair, ball joint replacement, engine tune-up, transmission fluid change, and alternator replacement. These services are essential for maintaining the optimal performance and longevity of vehicles. Water pumps, axles, and mufflers are critical components that require periodic replacement to ensure the vehicle's smooth operation. Rotors and drums may need resurfacing, while brakes and clutches require regular maintenance to ensure safe and efficient vehicle operation.
- Synthetic blend oil changes and mass airflow sensor diagnoses help maintain engine efficiency and performance. Brake pad replacement, electrical system repair, and transmission fluid changes are crucial services that ensure the vehicle's safety and longevity. Mechanic certification training is essential for maintaining high-quality service standards and ensuring that technicians are up-to-date with the latest technologies and repair techniques. Online booking systems and windshield repair services provide added convenience for customers, while ball joint replacement and engine tune-ups help maintain the vehicle's structural integrity and performance. Alternator replacement is necessary to ensure the vehicle's electrical system functions correctly.
- In summary, the market offers a range of essential services to keep vehicles running efficiently and safely. These services include water pump replacement, axle repair, muffler replacement, rotor resurfacing, brake repair, clutch repair, synthetic blend oil change, mass airflow sensor diagnosis, brake pad replacement, mechanic certification training, windshield repair, online booking systems, electrical system repair, ball joint replacement, engine tune-up, transmission fluid change, and alternator replacement.
What challenges does the Automotive Repair And Maintenance Services Industry face during its growth?
- The increasing reliance on public transportation represents a significant challenge to the industry's expansion.
- The market is witnessing significant growth due to several factors. Increasing pollution levels and stringent safety regulations are driving the demand for regular vehicle maintenance. Replacement services such as spring replacement, tire balancing, timing belt replacement, body repair, driveshaft repair, radiator repair, control arm replacement, and exhaust pipe repair are in high demand. Additionally, routine services like tire rotation, cooling system repair, motor oil change, automatic transmission repair, ignition system repair, starter replacement, catalytic converter replacement, and paint repair are essential for the proper functioning of vehicles.
- Governments worldwide are investing in public transportation infrastructure, including metro rails and buses, to reduce air pollution caused by the exponential growth of the commercial vehicle and passenger car industries. Safety regulations require regular vehicle inspections, ensuring a consistent demand for automotive repair and maintenance services.
Exclusive Customer Landscape
The automotive repair and maintenance services market forecasting report includes the adoption lifecycle of the market, covering from the innovator’s stage to the laggard’s stage. It focuses on adoption rates in different regions based on penetration. Furthermore, the automotive repair and maintenance services market report also includes key purchase criteria and drivers of price sensitivity to help companies evaluate and develop their market growth analysis strategies.

Customer Landscape
Key Companies & Market Insights
Companies are implementing various strategies, such as strategic alliances, automotive repair and maintenance services market forecast, partnerships, mergers and acquisitions, geographical expansion, and product/service launches, to enhance their presence in the industry.
ALL-TECH Transmission Inc. - This company specializes in comprehensive automotive services, encompassing electrical system diagnostics, tire repairs, and air conditioning and heating system maintenance, in addition to oil and lube treatments. Our proficient team utilizes advanced technologies and techniques to ensure optimal vehicle performance and longevity. By prioritizing precision and efficiency, we deliver unparalleled value to our clients. Our commitment to excellence and continuous improvement sets us apart in the competitive automotive services industry.
The industry research and growth report includes detailed analyses of the competitive landscape of the market and information about key companies, including:
- ALL-TECH Transmission Inc.
- Apex Tool Group LLC
- Arnold Clark Automobiles Ltd.
- Asbury Automotive Group Inc.
- Ashland Auto Repair
- Belron International Ltd.
- Bridgestone Corp.
- CarMax Inc.
- Driven Brands Holdings Inc.
- Firestone Complete Auto Care
- Halfords Group Plc
- Jiffy Lube International Inc.
- LeasePlan Corp. NV
- Monro Inc.
- myTVS Accessories
- Pendragon Vehicle Management Ltd.
- Robert Bosch GmbH
- Rust Oleum Corp.
- Sumitomo Corp.
- The Goodyear Tire and Rubber Co.
Qualitative and quantitative analysis of companies has been conducted to help clients understand the wider business environment as well as the strengths and weaknesses of key industry players. Data is qualitatively analyzed to categorize companies as pure play, category-focused, industry-focused, and diversified; it is quantitatively analyzed to categorize companies as dominant, leading, strong, tentative, and weak.
Recent Development and News in Automotive Repair And Maintenance Services Market
- In January 2024, Bosch and Shell announced a strategic collaboration to develop and market advanced mobility services, including automotive repair and maintenance, under the Shell Helix Service Station brand. This partnership aimed to leverage Bosch's expertise in automotive technology and Shell's global reach in the retail automotive sector (Bosch press release).
- In March 2024, Pep Boys, a leading automotive aftermarket service provider, completed the acquisition of Tasca Automotive Group, significantly expanding its presence in the NorthEastern United States. The acquisition added 18 service centers and 34 quick lube locations to Pep Boys' network (Pep Boys press release).
- In May 2024, General Motors (GM) unveiled its new OnStar Maintenance Plans, which include remote diagnostics and maintenance services for select vehicles. The plans aim to provide customers with personalized vehicle care and reduce the need for frequent visits to repair shops (GM press release).
- In February 2025, Denso Corporation, a leading automotive components manufacturer, received regulatory approval for its new automated repair system, which uses artificial intelligence and robotics to diagnose and repair vehicle issues. The system is expected to increase efficiency and reduce labor costs for repair shops (Denso press release).
Research Analyst Overview
- The market is experiencing significant shifts as technology advances and consumer preferences evolve. Payment processing solutions enable seamless transactions, while mobile mechanic apps offer convenience and flexibility for customers. Performance metrics and vehicle history reports help shops optimize efficiency and improve customer satisfaction. Heavy-duty vehicle repair and electric vehicle repair require specialized skills and tools, necessitating technician certifications and costly investments in inventory management. Pricing strategies and preventive maintenance programs are essential for retaining customers and reducing costs. Work order management systems streamline operations, and digital marketing strategies attract new business. Telematics integration and data analytics provide valuable insights for fleet maintenance and insurance claims processing.
- Parts sourcing and distribution networks require efficient optimization to ensure timely delivery and minimize inventory holding costs. Employee training and shop management software are crucial for maintaining a skilled workforce and managing day-to-day operations. Cost reduction strategies, such as invoice processing automation and parts price negotiations, help shops remain competitive. Hybrid vehicle repair and repair estimates are becoming increasingly common as the market shifts towards more sustainable transportation solutions. Ultimately, the market demands a data-driven, customer-focused approach to succeed in today's dynamic landscape.
Dive into Technavio’s robust research methodology, blending expert interviews, extensive data synthesis, and validated models for unparalleled Automotive Repair And Maintenance Services Market insights. See full methodology.
|
Market Scope |
|
|
Report Coverage |
Details |
|
Page number |
238 |
|
Base year |
2024 |
|
Historic period |
2019-2023 |
|
Forecast period |
2025-2029 |
|
Growth momentum & CAGR |
Accelerate at a CAGR of 5.7% |
|
Market growth 2025-2029 |
USD 154.1 billion |
|
Market structure |
Fragmented |
|
YoY growth 2024-2025(%) |
4.7 |
|
Key countries |
US, China, Japan, India, UK, Canada, Germany, South Korea, Italy, and France |
|
Competitive landscape |
Leading Companies, Market Positioning of Companies, Competitive Strategies, and Industry Risks |
What are the Key Data Covered in this Automotive Repair And Maintenance Services Market Research and Growth Report?
- CAGR of the Automotive Repair And Maintenance Services industry during the forecast period
- Detailed information on factors that will drive the growth and forecasting between 2025 and 2029
- Precise estimation of the size of the market and its contribution of the industry in focus to the parent market
- Accurate predictions about upcoming growth and trends and changes in consumer behaviour
- Growth of the market across North America, APAC, Europe, South America, and Middle East and Africa
- Thorough analysis of the market’s competitive landscape and detailed information about companies
- Comprehensive analysis of factors that will challenge the automotive repair and maintenance services market growth of industry companies
We can help! Our analysts can customize this automotive repair and maintenance services market research report to meet your requirements.