
Automotive Touch Screen Control Systems Market Size 2025-2029
The automotive touch screen control systems market size is forecast to increase by USD 2.94 billion, at a CAGR of 5.3% between 2024 and 2029.
- The market is witnessing significant growth, driven by the increasing integration of electronics in automobiles. This trend is evident as automakers continue to prioritize advanced infotainment systems and connectivity features to meet customer demands for enhanced in-car experiences. Furthermore, the emergence of large-screen display systems is transforming the automotive landscape, offering drivers a more interactive and user-friendly interface for controlling various vehicle functions. However, the market faces challenges, including the slowdown in global automobile sales, which may impact the demand for touch screen control systems.
- Additionally, the development and implementation of these systems require substantial investment in research and development, as well as the integration of various technologies, posing financial and operational challenges for automakers. Companies seeking to capitalize on market opportunities must navigate these challenges effectively by focusing on innovation, cost optimization, and strategic partnerships to remain competitive in the evolving automotive technology landscape.
What will be the Size of the Automotive Touch Screen Control Systems Market during the forecast period?
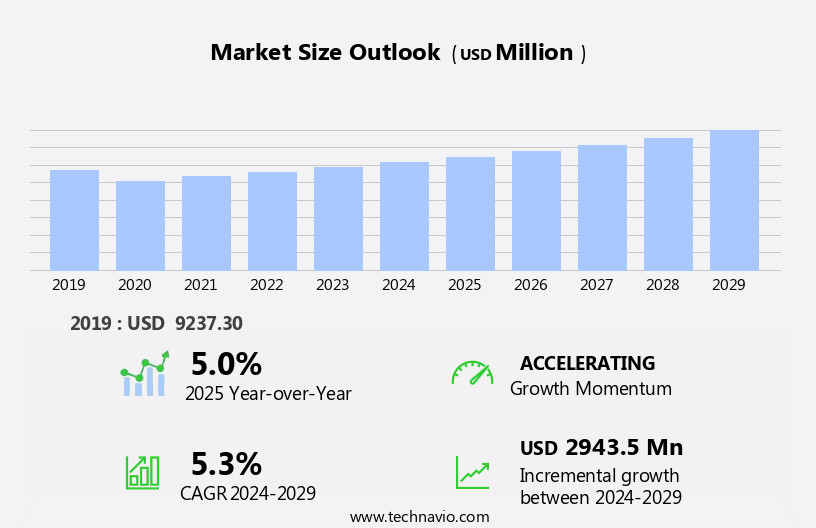
Explore in-depth regional segment analysis with market size data - historical 2019-2023 and forecasts 2025-2029 - in the full report.
Request Free Sample
The automotive touch screen control system market continues to evolve, integrating advanced technologies to enhance the driving experience. Wireless connectivity enables seamless integration of vehicle data logging, lane departure warning, and real-time ethernet communication. Autonomous driving systems, anti-theft mechanisms, and operating systems are seamlessly integrated, providing a comprehensive solution. Gesture recognition and hardware compatibility add to the user-friendly interface, ensuring resistance to vibration and temperature extremes. Multimedia systems, resistive touchscreens, and automotive-grade capacitive touchscreens offer superior functionality and durability. Advanced features such as audio amplifiers, touchscreen controllers, embedded systems, and software integration are essential components. Blind spot detection, data encryption, and adaptive cruise control are integrated to ensure safety and security.
EMI/RFI shielding, GPS integration, and ADAS integration are critical for optimal performance. Remote access, haptic feedback, and security measures add to the convenience and functionality of these systems. Driver development and multi-touch technology are ongoing priorities, ensuring the touchscreen display remains at the forefront of automotive innovation. CAN bus communication and Lin bus communication enable seamless connectivity between various vehicle systems. Navigation systems with intuitive GUI design, digital audio processing, and video systems offer enhanced driver experience. The market's continuous dynamism underscores its potential for significant growth and innovation.
How is this Automotive Touch Screen Control Systems Industry segmented?
The automotive touch screen control systems industry research report provides comprehensive data (region-wise segment analysis), with forecasts and estimates in "USD million" for the period 2025-2029, as well as historical data from 2019-2023 for the following segments.
- Application
- Resistive
- Capacitive
- Vehicle Type
- Passenger cars
- Commercial vehicles
- Geography
- North America
- US
- Canada
- Europe
- France
- Germany
- UK
- APAC
- Australia
- China
- India
- Japan
- South Korea
- Rest of World (ROW)
- North America
By Application Insights
The resistive segment is estimated to witness significant growth during the forecast period.
The market is witnessing significant advancements, with resistive and capacitive touchscreens gaining popularity in vehicle infotainment systems. Resistive touchscreens, consisting of a glass substrate and film substrate with conductive layers, offer high accuracy through voltage shift detection upon user contact. These systems support various features, including ip67 rating for water and dust resistance, vehicle data logging, lane departure warning, ethernet communication, temperature resistance, over-the-air updates, camera integration, audio system, rearview camera, user interface, speaker system, wireless connectivity, autonomous driving, anti-theft system, operating system, gesture recognition, hardware compatibility, vibration resistance, multimedia system, and resistive touchscreen. Additionally, capacitive touchscreens, which respond to conductivity changes from a user's touch, are known for their sleek design and responsiveness.
Integration of advanced technologies like blind spot detection, data encryption, adaptive cruise control, emi/rfi shielding, navigation system, gui design, digital audio processing, video system, lin bus communication, remote access, haptic feedback, security measures, driver development, multi-touch technology, touchscreen display, can bus communication, infotainment system, gps integration, and adas integration, further enhances the functionality and user experience of these systems.

The Resistive segment was valued at USD 5.67 billion in 2019 and showed a gradual increase during the forecast period.
Regional Analysis
APAC is estimated to contribute 55% to the growth of the global market during the forecast period.Technavio’s analysts have elaborately explained the regional trends and drivers that shape the market during the forecast period.

In the dynamic automotive industry, the touch screen control systems market is experiencing notable advancements, particularly in Asia Pacific (APAC). With emerging manufacturing hubs in countries like India and China, this region is poised for substantial growth. The increasing preference for in-vehicle infotainment systems in developing markets such as India, Thailand, and Indonesia is driving this trend. The passenger car segment in APAC is projected to expand at a faster rate compared to other regions. Consumers' growing demand for sophisticated in-vehicle technologies is fueling this market's growth. Advanced features like ip67 rating, vehicle data logging, lane departure warning, ethernet communication, temperature resistance, over-the-air updates, camera integration, audio system, rearview camera, user interface, speaker system, wireless connectivity, autonomous driving, anti-theft system, operating system, gesture recognition, hardware compatibility, vibration resistance, multimedia system, resistive touchscreen, automotive grade, capacitive touchscreen, audio amplifier, touchscreen controller, embedded system, software integration, blind spot detection, data encryption, adaptive cruise control, emi/rfi shielding, navigation system, gui design, digital audio processing, video system, lin bus communication, remote access, haptic feedback, security measures, driver development, multi-touch technology, touchscreen display, can bus communication, infotainment system, gps integration, and adas integration are increasingly becoming standard in modern vehicles.
These features enhance the driving experience and provide added safety and convenience, making them indispensable in today's automotive landscape.
Market Dynamics
Our researchers analyzed the data with 2024 as the base year, along with the key drivers, trends, and challenges. A holistic analysis of drivers will help companies refine their marketing strategies to gain a competitive advantage.
What are the key market drivers leading to the rise in the adoption of Automotive Touch Screen Control Systems Industry?
- The increasing integration of electronics in automobiles is the primary market driver, propelling significant growth in this industry.
- The market is experiencing significant growth due to the increasing penetration of automotive electronics. These systems, which utilize advanced electronics and software, form the foundation for the design and development of automotive display systems. The automotive electronics sector is projected to account for approximately half of the total vehicle value by 2030. The global automotive electronics market is anticipated to expand at a compound annual growth rate (CAGR) of around 7% between 2019 and 2030.
- The integration of Advanced Driver-Assistance Systems (ADAS) is another key factor fueling market growth. As technological innovations continue to shape the automotive industry, the demand for electronic components and sub-systems, particularly in passenger vehicles, is on the rise.
What are the market trends shaping the Automotive Touch Screen Control Systems Industry?
- The emergence of large-screen display systems is a notable market trend, signifying a significant shift towards immersive visual experiences in various industries. This trend is driven by advancements in technology and increasing consumer demand for high-definition visuals.
- The market is experiencing significant growth due to the integration of advanced technologies. Large in-vehicle touch screens are becoming increasingly popular, driving market expansion. These displays offer enhanced user experiences with features like lane departure warning, camera integration, and temperature resistance. The systems also support ethernet communication, vehicle data logging, and over-the-air updates. The market's evolution from analog instrument clusters and binary music systems in the early 2000s to digital displays in modern-day infotainment systems is a testament to technological advancements and competition in the automotive sector.
- These touch screen control systems not only improve vehicle functionality but also contribute to a more immersive and harmonious driving experience. Key features include user-friendly interfaces, speaker systems, and ip67 rating for water and dust resistance. These systems are essential components of modern vehicles, offering both convenience and safety.
What challenges does the Automotive Touch Screen Control Systems Industry face during its growth?
- The global automobile industry faces significant challenges due to a decelerating sales trend, which poses a substantial threat to industry expansion.
- The market experiences significant growth due to the increasing integration of advanced technologies in vehicles. Wireless connectivity, a key feature in these systems, enables seamless communication between vehicles and external devices, enhancing the driving experience. Autonomous driving is another significant trend driving market growth, as touch screens serve as primary interfaces for vehicle control in self-driving cars. Moreover, touch screen control systems offer advanced features such as anti-theft systems, gesture recognition, and multimedia systems, adding value to the overall vehicle purchasing decision. Hardware compatibility and vibration resistance are essential factors ensuring the durability and functionality of these systems.
- Operating systems used in these systems continue to evolve, providing more intuitive user interfaces and improved performance. Despite the market's growth potential, the industry faced challenges in 2020 due to the COVID-19 pandemic. The global vehicle sales decline led to a decrease in demand for automotive touch screen control systems. Production shutdowns and supply chain disruptions further impacted the market's revenue. However, as the world recovers from the pandemic, the market is expected to rebound, driven by the increasing adoption of advanced technologies in vehicles.
Exclusive Customer Landscape
The automotive touch screen control systems market forecasting report includes the adoption lifecycle of the market, covering from the innovator’s stage to the laggard’s stage. It focuses on adoption rates in different regions based on penetration. Furthermore, the automotive touch screen control systems market report also includes key purchase criteria and drivers of price sensitivity to help companies evaluate and develop their market growth analysis strategies.

Customer Landscape
Key Companies & Market Insights
Companies are implementing various strategies, such as strategic alliances, automotive touch screen control systems market forecast, partnerships, mergers and acquisitions, geographical expansion, and product/service launches, to enhance their presence in the industry.
Analog Devices Inc. - The company specializes in advanced touch screen control systems for the automotive industry. Our solutions encompass single-chip technologies for humidity, position, and proximity sensing, ensuring optimal user experience. By integrating these features, we enhance vehicle functionality and safety. Our systems are designed to elevate the driving experience, providing drivers with intuitive and responsive controls. Our commitment to innovation and quality sets us apart in the market.
The industry research and growth report includes detailed analyses of the competitive landscape of the market and information about key companies, including:
- Analog Devices Inc.
- Continental AG
- Dawar Technologies
- Fujitsu Ltd.
- Infineon Technologies AG
- Kyocera Corp.
- Lascar electronics Ltd.
- LEONHARD KURZ Stiftung and Co. KG
- Methode Electronics Inc.
- Microchip Technology Inc.
- Orient Display USA Corp.
- Robert Bosch GmbH
- Samsung Electronics Co. Ltd.
- Semtech Corp.
- STAFL Systems LLC
- STMicroelectronics NV
- Synaptics Inc.
- Texas Instruments Inc.
- TouchNetix Ltd.
- US Micro Products Inc.
Qualitative and quantitative analysis of companies has been conducted to help clients understand the wider business environment as well as the strengths and weaknesses of key industry players. Data is qualitatively analyzed to categorize companies as pure play, category-focused, industry-focused, and diversified; it is quantitatively analyzed to categorize companies as dominant, leading, strong, tentative, and weak.
Recent Development and News in Automotive Touch Screen Control Systems Market
- In February 2023, Bosch announced the launch of its new generation of touch screen control systems, featuring advanced voice recognition technology and improved connectivity options. This development underscores Bosch's commitment to enhancing user experience in automotive infotainment systems (Bosch press release, 2023).
- In November 2024, Magna International and Intel collaborated to develop a new automotive touch screen control system powered by Intel's autonomous driving platform, Mobileye. This strategic partnership aims to integrate advanced driver assistance systems and touch screen control functionalities, paving the way for future autonomous vehicles (Intel press release, 2024).
- In March 2025, Continental AG acquired SAP's software business for automotive industry solutions. This acquisition will enable Continental to strengthen its position in the market by integrating SAP's software expertise and expanding its product portfolio (Continental AG press release, 2025).
- In July 2025, Volkswagen unveiled its latest touch screen control system, featuring an expansive 15-inch display and augmented reality capabilities. This significant technological advancement sets a new standard for in-vehicle infotainment systems, providing drivers with enhanced connectivity, navigation, and entertainment options (Volkswagen press release, 2025).
- Sources:
- Bosch press release, 2023. "Bosch Introduces New Generation of Touchscreen Control Systems." Bosch.Com.
- Intel press release, 2024. "Intel and Magna International Collaborate to Develop Next-Generation Automotive Infotainment Systems." Intel.Com.
- Continental AG press release, 2025. "Continental Acquires SAP's Software Business for the Automotive Industry." Continental-ag.Com.
- Volkswagen press release, 2025. "Volkswagen Unveils New 15-inch Touchscreen Control System with Augmented Reality Capabilities." Volkswagen.Com.
Research Analyst Overview
- The market is experiencing significant advancements, driven by the integration of complex technologies such as cloud computing, computer vision, and artificial intelligence. These innovations aim to enhance user experience by enabling real-time processing of big data analytics and improving response time. Networking protocols and machine learning algorithms facilitate seamless data transmission and system integration. Manufacturers focus on touchscreen calibration, pixel density, color gamut, and contrast ratio to deliver high-quality displays, including OLED and TFT LCD. Integration of these technologies, however, increases development time and power consumption, necessitating testing and validation for regulatory compliance and human-machine interface optimization.
- Moreover, machine learning and AI-driven algorithms are essential in mitigating driver distraction and ensuring touchscreen sensitivity. Regulatory compliance and certification requirements remain crucial considerations, as these systems become increasingly integrated into vehicle safety systems. With advancements in real-time processing and big data analytics, the market is poised for continued growth.
Dive into Technavio’s robust research methodology, blending expert interviews, extensive data synthesis, and validated models for unparalleled Automotive Touch Screen Control Systems Market insights. See full methodology.
|
Market Scope |
|
|
Report Coverage |
Details |
|
Page number |
202 |
|
Base year |
2024 |
|
Historic period |
2019-2023 |
|
Forecast period |
2025-2029 |
|
Growth momentum & CAGR |
Accelerate at a CAGR of 5.3% |
|
Market growth 2025-2029 |
USD 2943.5 million |
|
Market structure |
Fragmented |
|
YoY growth 2024-2025(%) |
5.0 |
|
Key countries |
China, US, Germany, Japan, South Korea, Canada, France, India, UK, and Australia |
|
Competitive landscape |
Leading Companies, Market Positioning of Companies, Competitive Strategies, and Industry Risks |
What are the Key Data Covered in this Automotive Touch Screen Control Systems Market Research and Growth Report?
- CAGR of the Automotive Touch Screen Control Systems industry during the forecast period
- Detailed information on factors that will drive the growth and forecasting between 2025 and 2029
- Precise estimation of the size of the market and its contribution of the industry in focus to the parent market
- Accurate predictions about upcoming growth and trends and changes in consumer behaviour
- Growth of the market across APAC, Europe, North America, South America, and Middle East and Africa
- Thorough analysis of the market’s competitive landscape and detailed information about companies
- Comprehensive analysis of factors that will challenge the automotive touch screen control systems market growth of industry companies
We can help! Our analysts can customize this automotive touch screen control systems market research report to meet your requirements.