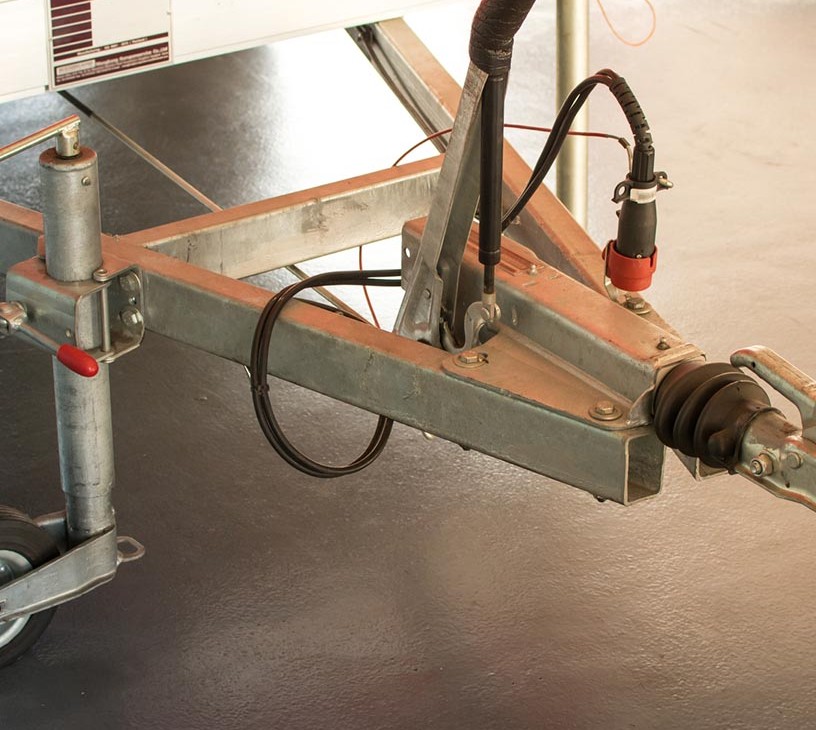
Automotive Tow Bars Market Analysis, Size, and Forecast 2026-2030: Europe (Germany, UK, and France), APAC (China, Japan, and India), North America (US, Canada, and Mexico), South America (Brazil, Argentina, and Chile), Middle East and Africa (Saudi Arabia, South Africa, and Turkey), and Rest of World (ROW)

Automotive Tow Bars Market Analysis, Size, and Forecast 2026-2030:
Europe (Germany, UK, and France), APAC (China, Japan, and India), North America (US, Canada, and Mexico), South America (Brazil, Argentina, and Chile), Middle East and Africa (Saudi Arabia, South Africa, and Turkey), and Rest of World (ROW)

Published: Oct 2026 295 Pages SKU: IRTNTR43783

Market Overview at a Glance

$1.25 B
Market Opportunity
4.6%
CAGR 2025 - 2030
36.3%
APAC Growth
$1.45 B
Non retractable segment 2024

Automotive Tow Bars Market Size 2026-2030

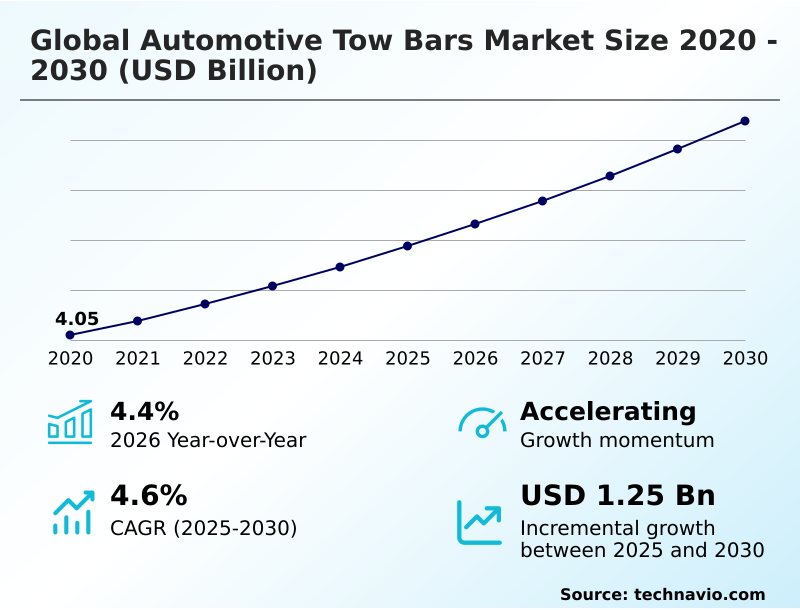
The automotive tow bars market size is valued to increase by USD 1.25 billion, at a CAGR of 4.6% from 2025 to 2030. Massive global proliferation of sport utility vehicles and light commercial transport platforms will drive the automotive tow bars market.

Major Market Trends & Insights

  • APAC dominated the market and accounted for a 36.3% growth during the forecast period.
  • By Product Type - Non retractable segment was valued at USD 1.45 billion in 2024
  • By Vehicle Type - Passenger cars segment accounted for the largest market revenue share in 2024

Market Size & Forecast

  • Market Opportunities: USD 2.14 billion
  • Market Future Opportunities: USD 1.25 billion
  • CAGR from 2025 to 2030 : 4.6%

Market Summary

  • The Automotive Tow Bars Market is experiencing rapid structural evolution driven by shifting consumer lifestyles and major architectural redesigns in modern passenger vehicles. A critical driver for this expansion is the sustained surge in outdoor recreational tourism, which drastically increases the demand for secure mechanical interfaces necessary to transport travel trailers and marine equipment.
  • For instance, automotive distributors optimizing their supply chains for lifestyle accessories have witnessed a 20% higher conversion rate when offering factory-integrated towing solutions compared to separate aftermarket installations. However, the industry confronts severe engineering challenges related to electric vehicle underbody battery pack configurations.
  • The flat skateboard architecture of modern electrified platforms leaves minimal structural clearance for traditional crossmembers, forcing suppliers to redesign brackets that avoid sensitive cooling channels. To address these constraints, manufacturers are shifting toward ultra-high-strength lightweight steel and advanced aluminum alloys, ensuring robust pulling capabilities without compromising vehicle range.
  • These strategic adaptations emphasize the necessity of aligning mechanical towing resilience with contemporary environmental mandates and the expanding global park of multi-purpose utility vehicles.

What will be the Size of the Automotive Tow Bars Market during the forecast period?
Get Key Insights on Market Forecast (PDF) Get Free Sample

How is the Automotive Tow Bars Market Segmented?

The automotive tow bars industry research report provides comprehensive data (region-wise segment analysis), with forecasts and estimates in "USD million" for the period 2026-2030, as well as historical data from 2020-2024 for the following segments.

  • Product type
    • Non retractable
    • Retractable
    • Swiveling
    • Others
  • Vehicle type
    • Passenger cars
    • LCVs
    • HCVs
  • Channel
    • OEMs
    • Aftermarket
  • Geography
    • Europe
      • Germany
      • UK
      • France
      • Italy
      • Spain
      • The Netherlands
    • APAC
      • China
      • Japan
      • India
      • South Korea
      • Australia
      • Indonesia
    • North America
      • US
      • Canada
      • Mexico
    • South America
      • Brazil
      • Argentina
      • Chile
    • Middle East and Africa
      • Saudi Arabia
      • South Africa
      • Turkey
      • UAE
      • Israel

By Product Type Insights

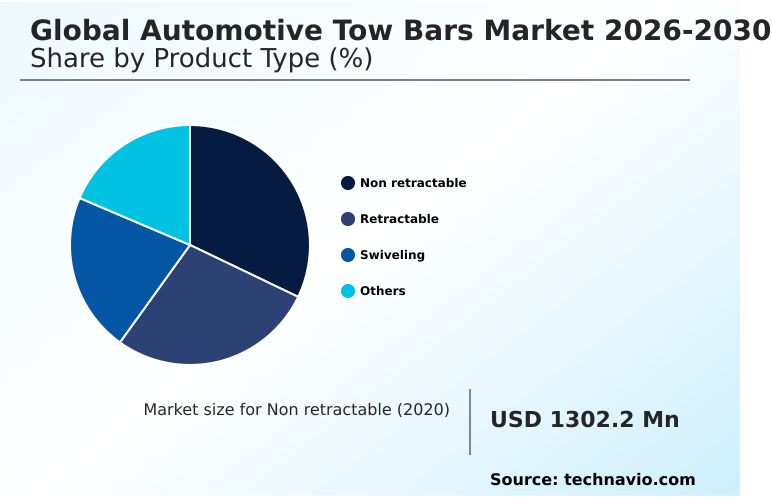
The non retractable segment is estimated to witness significant growth during the forecast period.

The non retractable segment of the Automotive Tow Bars constitutes the foundational category within the towing infrastructure landscape, offering absolute structural permanence and cost-effective durability.

This sub-segment involves rigid structures mounted to the rear chassis without integrated folding mechanisms, making them indispensable for commercial logistics providers utilizing heavy-duty pintle hooks and agricultural enterprises requiring continuous load-bearing capabilities.

Fabricated using high-tensile structural carbon steel and treated with anti-corrosive powder coatings, these permanent configurations resist severe weather degradation and chemical road salts.

Market transition toward optimized robotic welding methodologies has successfully compressed manufacturing overheads, improving overall automated assembly efficiency by 15%.

In contrast to premium detachable setups, the non retractable category maintains a 25% higher adoption rate among light commercial vehicle fleets due to its straightforward mechanical design, ensuring immediate operational readiness and minimizing long-term total cost of ownership across rigorous transport networks.
Get Free Sample

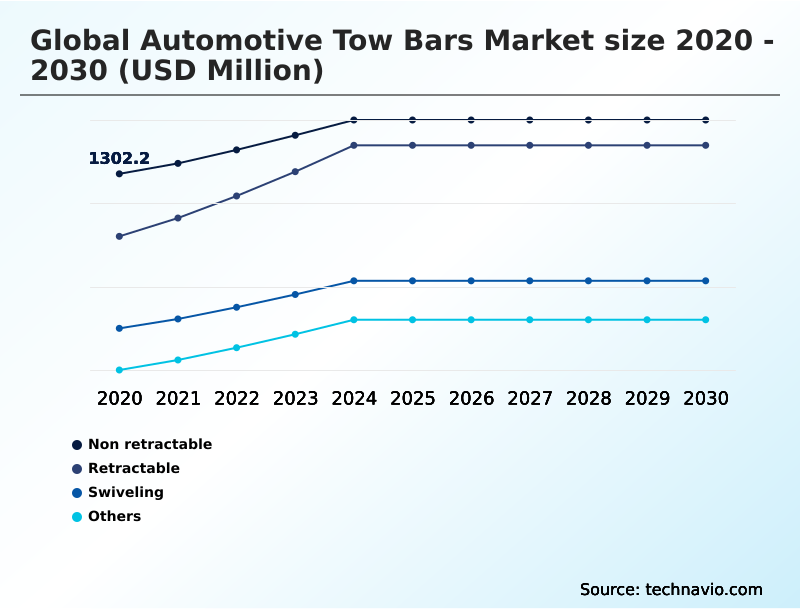
The Non retractable segment was valued at USD 1.45 billion in 2024 and showed a gradual increase during the forecast period.
Get Free Sample

Regional Analysis

APAC is estimated to contribute 36.3% to the growth of the global market during the forecast period.Technavio’s analysts have elaborately explained the regional trends and drivers that shape the market during the forecast period.
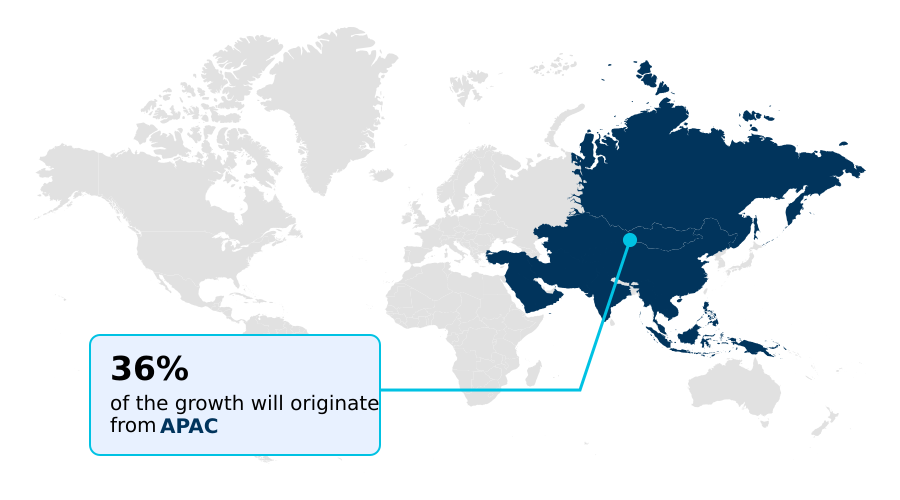
See How Automotive Tow Bars Market Demand is Rising in APAC Get Free Sample

The geographical landscape of the Automotive Tow Bars demonstrates stark structural contrasts between established European hubs and rapidly emerging Asia-Pacific production centers.

Europe maintains a highly mature ecosystem driven by stringent safety frameworks and a deep cultural affinity for caravanning, leading to a 35% higher penetration rate of automated retractable tow bar systems compared to North America.

This maturity demands continuous cyclic stress actions testing and precision-forged steel alloy drawbars to meet regulatory type-approvals. Conversely, APAC is undergoing an aggressive manufacturing modernization, leveraging large-scale light commercial vehicle fleets and expanding decentralized logistics.

By establishing localized stamping facilities and integrating robotic welding methodologies, suppliers in APAC have compressed regional supply chain delivery lead times by 22%.

Furthermore, the adoption of modular towing systems across Chinese and Indian assembly lines has improved raw material utilization efficiency by 15%, allowing regional producers to rapidly scale output of high-tensile structural carbon steel accessories to meet the non-discretionary demands of a burgeoning utility vehicle consumer base.

Market Dynamics

Our researchers analyzed the data with 2025 as the base year, along with the key drivers, trends, and challenges. A holistic analysis of drivers will help companies refine their marketing strategies to gain a competitive advantage.

  • As the global automotive manufacturing landscape undergoes a radical transformation toward electrification and smart connectivity, the engineering requirements for rear-mounted utility accessories have grown exponentially complex. The transition to battery electric vehicle skateboard architecture forces tier-one suppliers to fundamentally rethink structural clearances, ensuring that heavy-duty coupling mechanisms do not interfere with sensitive high-voltage underfloor systems.
  • To address these payload and mass limitations without compromising structural integrity, leading engineers are aggressively implementing the ultra lightweight modular tow bar framework, which utilizes advanced micro-alloyed compositions to shed excess unladen mass.
  • Concurrently, luxury automotive brands are driving the adoption of hidden automated retractable towbar systems that completely preserve exterior vehicle styling and aerodynamic drag coefficients when not actively hauling loads. Meeting the rigorous safety mandates of the unece regulation fifty five protocol demands that these highly sophisticated structures undergo extreme dynamic stress validation, ensuring flawless performance over millions of cycles.
  • In terms of operational planning, manufacturers integrating ai synchronized smart load sensors directly into their wiring harnesses have achieved a 30% reduction in post-sale electronic calibration errors compared to traditional passive hitch brackets.
  • This digital integration automatically adjusts vehicle torque vectoring and regenerative braking profiles based on real-time trailing weights, ultimately aligning aftermarket and original equipment supply chains with the overarching industry mandate for absolute passenger safety and intelligent vehicle interoperability.
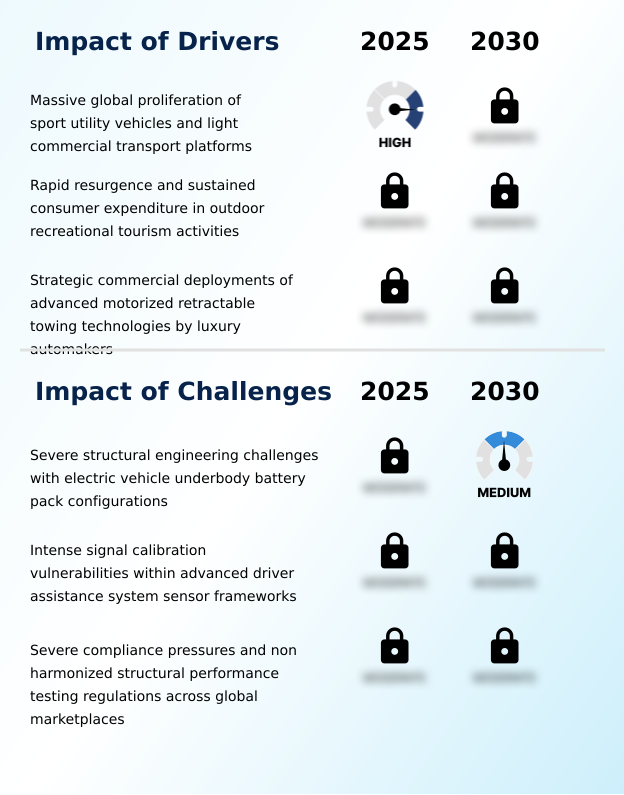
What are the key market drivers leading to the rise in the adoption of Automotive Tow Bars Industry?

  • The massive global proliferation of sport utility vehicles and light commercial transport platforms serves as the primary catalyst propelling the expansion of the market.

  • The continuous global sport utility vehicle proliferation and the rapid expansion of light commercial vehicle fleets serve as massive industrial catalysts for the Automotive Tow Bars.
  • Modern consumer purchasing behavior heavily favors high-clearance platforms engineered with baseline torque profiles inherently suited for heavy transport tasks, including outdoor recreational tourism.
  • To accommodate this expanding vehicle park, tier-one manufacturers are systematically supplying modular towing systems that offer rapid physical interchanges between varying trailer hitches.
  • Upgrading commercial delivery fleets with these quick-release structural solutions has accelerated daily turnaround operations, effectively reducing vehicle loading downtime by 20%.
  • Furthermore, standardizing automated retractable tow bar systems across premium passenger lines has amplified original equipment accessory conversion rates by 25%. This aggressive utility vehicle adoption guarantees a stable, non-discretionary baseline of demand for resilient, high-capacity mechanical coupling interfaces.

What are the market trends shaping the Automotive Tow Bars Industry?

  • The accelerating material integration of ultra-high-strength lightweight structural carbon alloys represents a prominent trend redefining the market. This technological shift enables manufacturers to reduce vehicle mass while maintaining essential load-bearing capabilities.

  • The rapid displacement of conventional heavy carbon metals in favor of ultra-high-strength lightweight steel and structural aluminum compositions is fundamentally reshaping the Automotive Tow Bars. Driven by the critical necessity to extend the driving range of newly electrified platforms, advanced material integration prevents excessive payload penalties on the rear chassis.
  • This optimization ensures that vehicles maintain high gross towing weight ratings while preserving the aerodynamic profile preservation required for modern transit efficiency. By deploying these micro-alloyed structures, automotive suppliers have successfully reduced per-unit component mass by up to 30%, which subsequently lowers inbound logistics and shipping expenditures by 15%.
  • Additionally, the application of robotic powder coatings over these alloys has improved long-term corrosion resistance, decreasing fleet maintenance outlays by 12%. This material transition ultimately enables commercial and recreational users to maximize transport capacity without compromising strict environmental sustainability targets or vehicle energy consumption.

What challenges does the Automotive Tow Bars Industry face during its growth?

  • Severe structural engineering challenges associated with mounting systems around complex electric vehicle underbody battery pack configurations pose a critical barrier to market growth.

  • Harmonizing complex aftermarket towing hardware with hyper-sensitive advanced driver assistance systems presents a severe operational bottleneck for the Automotive Tow Bars. The physical installation of heavy-duty pintle hooks or a detachable swan-neck assembly frequently obstructs the pre-calibrated field of view of rear radar geometries, triggering false proximity warnings and disabling critical autonomous emergency braking protocols.
  • To resolve these digital conflicts, suppliers must engineer universally compatible electronic stability control module bypasses that systematically reprogram onboard sensor parameters. The intensive software research required to bridge proprietary vehicle architectures has consequently inflated initial accessory development costs by 35%.
  • Moreover, testing these digital integrations against continuous cyclic stress actions prolongs compliance certification timelines by 20%, restricting the rapid commercial introduction of novel intelligent towing solutions across fragmented international distribution channels.

Exclusive Technavio Analysis on Customer Landscape

The automotive tow bars market forecasting report includes the adoption lifecycle of the market, covering from the innovator’s stage to the laggard’s stage. It focuses on adoption rates in different regions based on penetration. Furthermore, the automotive tow bars market report also includes key purchase criteria and drivers of price sensitivity to help companies evaluate and develop their market growth analysis strategies.
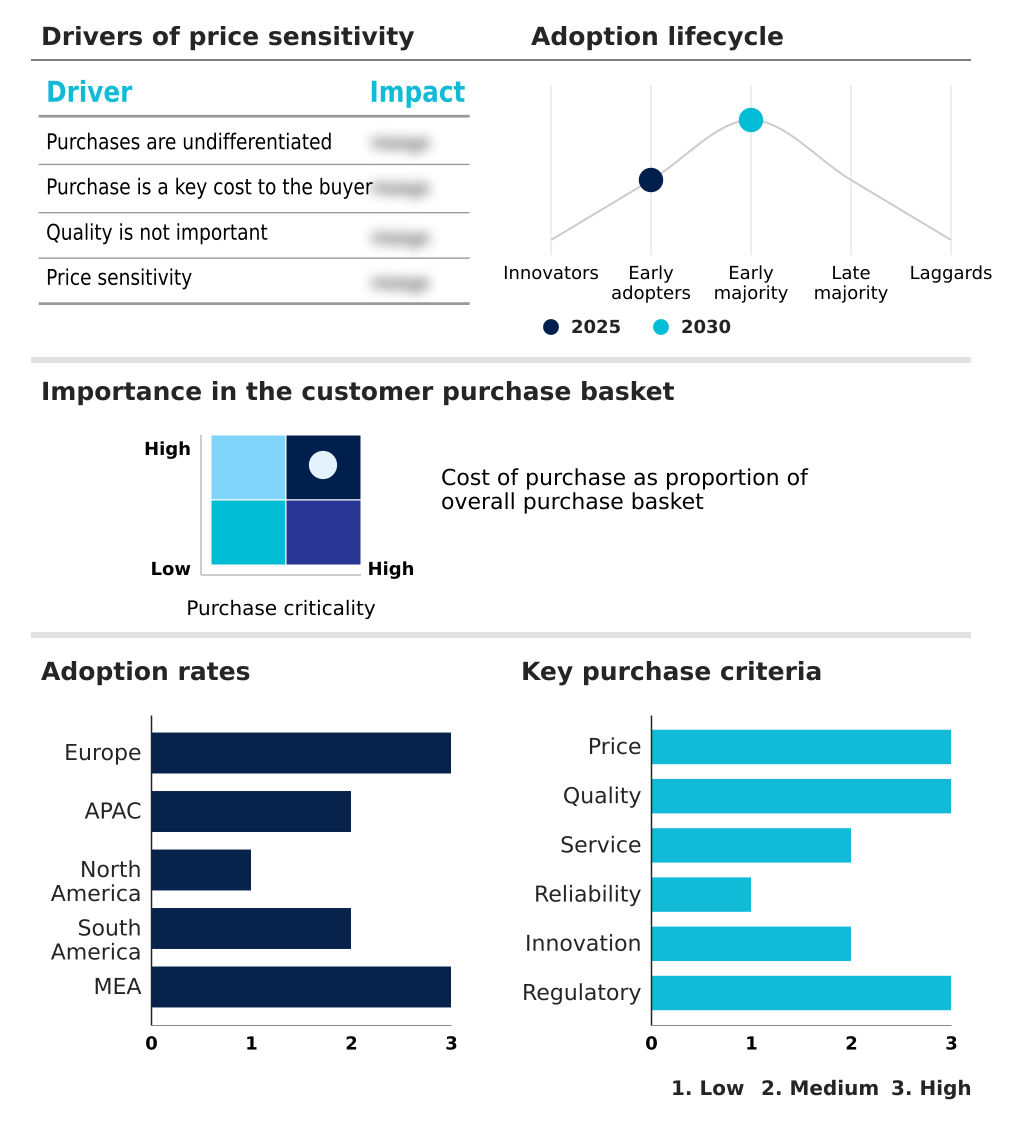
Customer Landscape of Automotive Tow Bars Industry

Competitive Landscape

Companies are implementing various strategies, such as strategic alliances, automotive tow bars market forecast, partnerships, mergers and acquisitions, geographical expansion, and product/service launches, to enhance their presence in the industry.

ACPS Automotive GmbH - Delivers technologically advanced automotive tow bars, including automated retractable variants and seamlessly integrated towing systems equipped with safety-focused electronic modules for superior vehicle alignment and payload management.

The industry research and growth report includes detailed analyses of the competitive landscape of the market and information about key companies, including:

  • ACPS Automotive GmbH
  • AL KO Vehicle Technology
  • AUTO HAK SP. Z O.O
  • Boronia Tow Bars Pty Ltd
  • Bosal Nederland BV
  • Brink Group B.V.
  • CURT Manufacturing LLC
  • GDW NV
  • Hayman Reese
  • MVG
  • North Shore Towbars
  • PCT Automotive Ltd.
  • Steinhof Sp
  • TAG Towbars
  • Tow Trust Towbars Ltd.
  • Umbra Rimorchi s.r.l
  • Westfalia Automotive GmbH
  • Witter Towbar Systems Ltd

Qualitative and quantitative analysis of companies has been conducted to help clients understand the wider business environment as well as the strengths and weaknesses of key industry players. Data is qualitatively analyzed to categorize companies as pure play, category-focused, industry-focused, and diversified; it is quantitatively analyzed to categorize companies as dominant, leading, strong, tentative, and weak.

Recent Development and News in Automotive tow bars market

  • In the Automotive Parts and Equipment industry, the aggressive integration of electronic control units up to 150 units per luxury vehicle has directly influenced Automotive Tow Bars demand by necessitating advanced smart load sensing harness systems capable of interfacing with multiplex communication bus architectures.
  • The widespread adoption of strict circular economy initiatives and green steel frameworks has accelerated the transition toward recyclable aluminum alloys, driving Automotive Tow Bars manufacturers to reduce carbon emissions per unit by 30% while preserving aerodynamic profile preservation.
  • The transition toward flat underfloor skateboard architectures in battery electric vehicles has created structural clearance limitations near high-voltage battery enclosures, compelling Automotive Tow Bars suppliers to develop highly customized multi-point frame reinforcement solutions.
  • Stringent global safety regulations mandating advanced driver assistance systems such as blind-spot detection and autonomous emergency braking have reshaped Automotive Tow Bars engineering, requiring automatic recalibration of rear radar geometries whenever a trailer is mechanically coupled.

Dive into Technavio’s robust research methodology, blending expert interviews, extensive data synthesis, and validated models for unparalleled Automotive Tow Bars Market insights. See full methodology.

Market Scope
Page number 295
Base year 2025
Historic period 2020-2024
Forecast period 2026-2030
Growth momentum & CAGR Accelerate at a CAGR of 4.6%
Market growth 2026-2030 USD 1252.8 million
Market structure Fragmented
YoY growth 2025-2026(%) 4.4%
Key countries Germany, UK, France, Italy, Spain, The Netherlands, China, Japan, India, South Korea, Australia, Indonesia, US, Canada, Mexico, Brazil, Argentina, Chile, Saudi Arabia, South Africa, Turkey, UAE and Israel
Competitive landscape Leading Companies, Market Positioning of Companies, Competitive Strategies, and Industry Risks

Request Free Sample

Research Analyst Overview

  • The Automotive Tow Bars is rapidly transitioning from passive mechanical brackets to highly intelligent, digitally integrated vehicle safety components. A definitive trend shaping corporate product strategy is the seamless integration of artificial intelligence synchronization and smart load sensing harness architectures directly into the vehicle multiplex communication bus.
  • This technological shift allows the central computer to automatically adjust torque vectoring calibration and regenerative braking force distribution based on real-time vertical tongue weight and trailer sway metrics. By adopting these sophisticated vehicle dedicated wiring kits, automotive safety engineers have realized a 40% improvement in automated safety network integration response times during high-speed emergency maneuvers.
  • The shift toward electrification also necessitates the use of structural aluminum compositions to offset the immense baseline mass of battery packs. Implementing these advanced lightweight materials allows original equipment manufacturers to meet strict aerodynamic efficiency mandates without sacrificing tow ratings.
  • Consequently, boardroom decisions increasingly prioritize specialized robotic welding methodologies and electronic actuation components to ensure modern transport fleets maintain operational flexibility, absolute structural resilience, and seamless digital interoperability across demanding logistical environments.

What are the Key Data Covered in this Automotive Tow Bars Market Research and Growth Report?

  • What is the expected growth of the Automotive Tow Bars Market between 2026 and 2030?

    • USD 1.25 billion, at a CAGR of 4.6%

  • What segmentation does the market report cover?

    • The report is segmented by Product Type (Non retractable, Retractable, Swiveling, and Others), Vehicle Type (Passenger cars, LCVs, and HCVs), Channel (OEMs, and Aftermarket) and Geography (Europe, APAC, North America, South America, Middle East and Africa)

  • Which regions are analyzed in the report?

    • Europe, APAC, North America, South America and Middle East and Africa

  • What are the key growth drivers and market challenges?

    • Massive global proliferation of sport utility vehicles and light commercial transport platforms, Severe structural engineering challenges with electric vehicle underbody battery pack configurations

  • Who are the major players in the Automotive Tow Bars Market?

    • ACPS Automotive GmbH, AL KO Vehicle Technology, AUTO HAK SP. Z O.O, Boronia Tow Bars Pty Ltd, Bosal Nederland BV, Brink Group B.V., CURT Manufacturing LLC, GDW NV, Hayman Reese, MVG, North Shore Towbars, PCT Automotive Ltd., Steinhof Sp, TAG Towbars, Tow Trust Towbars Ltd., Umbra Rimorchi s.r.l, Westfalia Automotive GmbH and Witter Towbar Systems Ltd

Market Research Insights

  • The Automotive Tow Bars Market is characterized by a rapid integration of intelligent towing technologies and advanced material science. Propelled by the sport utility vehicle proliferation and expanding light commercial vehicle fleets, manufacturers are prioritizing unladen weight reduction and optimal weight distribution optimization.
  • By adopting robotic powder coatings and smart connection modules, top-tier suppliers have improved automated assembly efficiency by 18% while reducing overall warranty claims linked to dynamic pulling forces by 12%. Furthermore, the strategic deployment of vehicle dedicated wiring kits ensures seamless synchronization with onboard stability software, improving electronic stability intervention speeds by 25%.
  • These technological advancements allow modern passenger vehicles to maintain high gross towing weight ratings without sacrificing aerodynamic profile preservation or operational safety.

We can help! Our analysts can customize this automotive tow bars market research report to meet your requirements.

Get in touch

1. Executive Summary

1.1 Market overview

Executive Summary - Chart on Market Overview
Executive Summary - Data Table on Market Overview
Executive Summary - Chart on Global Market Characteristics
Executive Summary - Chart on Market by Geography
Executive Summary - Chart on Market Segmentation by Product Type
Executive Summary - Chart on Market Segmentation by Vehicle Type
Executive Summary - Chart on Market Segmentation by Channel
Executive Summary - Chart on Incremental Growth
Executive Summary - Data Table on Incremental Growth
Executive Summary - Chart on Company Market Positioning

2. Technavio Analysis

2.1 Analysis of price sensitivity, lifecycle, customer purchase basket, adoption rates, and purchase criteria

2.2 Criticality of inputs and Factors of differentiation

Chart on Overview on criticality of inputs and factors of differentiation

2.3 Factors of disruption

Chart on Overview on factors of disruption

2.4 Impact of drivers and challenges

Chart on Impact of drivers and challenges in 2025 and 2030

3. Market Landscape

3.1 Market ecosystem

Chart on Parent Market
Data Table on - Parent Market

3.2 Market characteristics

Chart on Market characteristics analysis

3.3 Value chain analysis

Chart on Value chain analysis

4. Market Sizing

4.1 Market definition

Data Table on Offerings of companies included in the market definition

4.2 Market segment analysis

Market segments

4.3 Market size 2025

4.4 Market outlook: Forecast for 2025-2030

Chart on Global - Market size and forecast 2025-2030 ($ million)
Data Table on Global - Market size and forecast 2025-2030 ($ million)
Chart on Global Market: Year-over-year growth 2025-2030 (%)
Data Table on Global Market: Year-over-year growth 2025-2030 (%)

5. Historic Market Size

5.1 Global Automotive Tow Bars Market 2020 - 2024

Historic Market Size - Data Table on Global Automotive Tow Bars Market 2020 - 2024 ($ million)

5.2 Product Type segment analysis 2020 - 2024

Historic Market Size - Product Type Segment 2020 - 2024 ($ million)

5.3 Vehicle Type segment analysis 2020 - 2024

Historic Market Size - Vehicle Type Segment 2020 - 2024 ($ million)

5.4 Channel segment analysis 2020 - 2024

Historic Market Size - Channel Segment 2020 - 2024 ($ million)

5.5 Geography segment analysis 2020 - 2024

Historic Market Size - Geography Segment 2020 - 2024 ($ million)

5.6 Country segment analysis 2020 - 2024

Historic Market Size - Country Segment 2020 - 2024 ($ million)

6. Qualitative Analysis

6.1 Impact of AI on global automotive tow bars market

6.2 Impact of geopolitical conflicts on global automotive tow bars market

7. Five Forces Analysis

7.1 Five forces summary

Five forces analysis - Comparison between 2025 and 2030

7.2 Bargaining power of buyers

Bargaining power of buyers - Impact of key factors 2025 and 2030

7.3 Bargaining power of suppliers

Bargaining power of suppliers - Impact of key factors in 2025 and 2030

7.4 Threat of new entrants

Threat of new entrants - Impact of key factors in 2025 and 2030

7.5 Threat of substitutes

Threat of substitutes - Impact of key factors in 2025 and 2030

7.6 Threat of rivalry

Threat of rivalry - Impact of key factors in 2025 and 2030

7.7 Market condition

Chart on Market condition - Five forces 2025 and 2030

8. Market Segmentation by Product Type

8.1 Market segments

Chart on Product Type - Market share 2025-2030 (%)
Data Table on Product Type - Market share 2025-2030 (%)

8.2 Comparison by Product Type

Chart on Comparison by Product Type
Data Table on Comparison by Product Type

8.3 Non retractable - Market size and forecast 2025-2030

Chart on Non retractable - Market size and forecast 2025-2030 ($ million)
Data Table on Non retractable - Market size and forecast 2025-2030 ($ million)
Chart on Non retractable - Year-over-year growth 2025-2030 (%)
Data Table on Non retractable - Year-over-year growth 2025-2030 (%)

8.4 Retractable - Market size and forecast 2025-2030

Chart on Retractable - Market size and forecast 2025-2030 ($ million)
Data Table on Retractable - Market size and forecast 2025-2030 ($ million)
Chart on Retractable - Year-over-year growth 2025-2030 (%)
Data Table on Retractable - Year-over-year growth 2025-2030 (%)

8.5 Swiveling - Market size and forecast 2025-2030

Chart on Swiveling - Market size and forecast 2025-2030 ($ million)
Data Table on Swiveling - Market size and forecast 2025-2030 ($ million)
Chart on Swiveling - Year-over-year growth 2025-2030 (%)
Data Table on Swiveling - Year-over-year growth 2025-2030 (%)

8.6 Others - Market size and forecast 2025-2030

Chart on Others - Market size and forecast 2025-2030 ($ million)
Data Table on Others - Market size and forecast 2025-2030 ($ million)
Chart on Others - Year-over-year growth 2025-2030 (%)
Data Table on Others - Year-over-year growth 2025-2030 (%)

8.7 Market opportunity by Product Type

Market opportunity by Product Type ($ million)
Data Table on Market opportunity by Product Type ($ million)

9. Market Segmentation by Vehicle Type

9.1 Market segments

Chart on Vehicle Type - Market share 2025-2030 (%)
Data Table on Vehicle Type - Market share 2025-2030 (%)

9.2 Comparison by Vehicle Type

Chart on Comparison by Vehicle Type
Data Table on Comparison by Vehicle Type

9.3 Passenger cars - Market size and forecast 2025-2030

Chart on Passenger cars - Market size and forecast 2025-2030 ($ million)
Data Table on Passenger cars - Market size and forecast 2025-2030 ($ million)
Chart on Passenger cars - Year-over-year growth 2025-2030 (%)
Data Table on Passenger cars - Year-over-year growth 2025-2030 (%)

9.4 LCVs - Market size and forecast 2025-2030

Chart on LCVs - Market size and forecast 2025-2030 ($ million)
Data Table on LCVs - Market size and forecast 2025-2030 ($ million)
Chart on LCVs - Year-over-year growth 2025-2030 (%)
Data Table on LCVs - Year-over-year growth 2025-2030 (%)

9.5 HCVs - Market size and forecast 2025-2030

Chart on HCVs - Market size and forecast 2025-2030 ($ million)
Data Table on HCVs - Market size and forecast 2025-2030 ($ million)
Chart on HCVs - Year-over-year growth 2025-2030 (%)
Data Table on HCVs - Year-over-year growth 2025-2030 (%)

9.6 Market opportunity by Vehicle Type

Market opportunity by Vehicle Type ($ million)
Data Table on Market opportunity by Vehicle Type ($ million)

10. Market Segmentation by Channel

10.1 Market segments

Chart on Channel - Market share 2025-2030 (%)
Data Table on Channel - Market share 2025-2030 (%)

10.2 Comparison by Channel

Chart on Comparison by Channel
Data Table on Comparison by Channel

10.3 OEMs - Market size and forecast 2025-2030

Chart on OEMs - Market size and forecast 2025-2030 ($ million)
Data Table on OEMs - Market size and forecast 2025-2030 ($ million)
Chart on OEMs - Year-over-year growth 2025-2030 (%)
Data Table on OEMs - Year-over-year growth 2025-2030 (%)

10.4 Aftermarket - Market size and forecast 2025-2030

Chart on Aftermarket - Market size and forecast 2025-2030 ($ million)
Data Table on Aftermarket - Market size and forecast 2025-2030 ($ million)
Chart on Aftermarket - Year-over-year growth 2025-2030 (%)
Data Table on Aftermarket - Year-over-year growth 2025-2030 (%)

10.5 Market opportunity by Channel

Market opportunity by Channel ($ million)
Data Table on Market opportunity by Channel ($ million)

11. Customer Landscape

11.1 Customer landscape overview

Analysis of price sensitivity, lifecycle, customer purchase basket, adoption rates, and purchase criteria

12. Geographic Landscape

12.1 Geographic segmentation

Chart on Market share by geography 2025-2030 (%)
Data Table on Market share by geography 2025-2030 (%)

12.2 Geographic comparison

Chart on Geographic comparison
Data Table on Geographic comparison

12.3 Europe - Market size and forecast 2025-2030

Chart on Europe - Market size and forecast 2025-2030 ($ million)
Data Table on Europe - Market size and forecast 2025-2030 ($ million)
Chart on Europe - Year-over-year growth 2025-2030 (%)
Data Table on Europe - Year-over-year growth 2025-2030 (%)
Chart on Regional Comparison - Europe
Data Table on Regional Comparison - Europe

12.3.1 Germany - Market size and forecast 2025-2030

Chart on Germany - Market size and forecast 2025-2030 ($ million)
Data Table on Germany - Market size and forecast 2025-2030 ($ million)
Chart on Germany - Year-over-year growth 2025-2030 (%)
Data Table on Germany - Year-over-year growth 2025-2030 (%)

12.3.2 UK - Market size and forecast 2025-2030

Chart on UK - Market size and forecast 2025-2030 ($ million)
Data Table on UK - Market size and forecast 2025-2030 ($ million)
Chart on UK - Year-over-year growth 2025-2030 (%)
Data Table on UK - Year-over-year growth 2025-2030 (%)

12.3.3 France - Market size and forecast 2025-2030

Chart on France - Market size and forecast 2025-2030 ($ million)
Data Table on France - Market size and forecast 2025-2030 ($ million)
Chart on France - Year-over-year growth 2025-2030 (%)
Data Table on France - Year-over-year growth 2025-2030 (%)

12.3.4 Italy - Market size and forecast 2025-2030

Chart on Italy - Market size and forecast 2025-2030 ($ million)
Data Table on Italy - Market size and forecast 2025-2030 ($ million)
Chart on Italy - Year-over-year growth 2025-2030 (%)
Data Table on Italy - Year-over-year growth 2025-2030 (%)

12.3.5 Spain - Market size and forecast 2025-2030

Chart on Spain - Market size and forecast 2025-2030 ($ million)
Data Table on Spain - Market size and forecast 2025-2030 ($ million)
Chart on Spain - Year-over-year growth 2025-2030 (%)
Data Table on Spain - Year-over-year growth 2025-2030 (%)

12.3.6 The Netherlands - Market size and forecast 2025-2030

Chart on The Netherlands - Market size and forecast 2025-2030 ($ million)
Data Table on The Netherlands - Market size and forecast 2025-2030 ($ million)
Chart on The Netherlands - Year-over-year growth 2025-2030 (%)
Data Table on The Netherlands - Year-over-year growth 2025-2030 (%)

12.4 APAC - Market size and forecast 2025-2030

Chart on APAC - Market size and forecast 2025-2030 ($ million)
Data Table on APAC - Market size and forecast 2025-2030 ($ million)
Chart on APAC - Year-over-year growth 2025-2030 (%)
Data Table on APAC - Year-over-year growth 2025-2030 (%)
Chart on Regional Comparison - APAC
Data Table on Regional Comparison - APAC

12.4.1 China - Market size and forecast 2025-2030

Chart on China - Market size and forecast 2025-2030 ($ million)
Data Table on China - Market size and forecast 2025-2030 ($ million)
Chart on China - Year-over-year growth 2025-2030 (%)
Data Table on China - Year-over-year growth 2025-2030 (%)

12.4.2 Japan - Market size and forecast 2025-2030

Chart on Japan - Market size and forecast 2025-2030 ($ million)
Data Table on Japan - Market size and forecast 2025-2030 ($ million)
Chart on Japan - Year-over-year growth 2025-2030 (%)
Data Table on Japan - Year-over-year growth 2025-2030 (%)

12.4.3 India - Market size and forecast 2025-2030

Chart on India - Market size and forecast 2025-2030 ($ million)
Data Table on India - Market size and forecast 2025-2030 ($ million)
Chart on India - Year-over-year growth 2025-2030 (%)
Data Table on India - Year-over-year growth 2025-2030 (%)

12.4.4 South Korea - Market size and forecast 2025-2030

Chart on South Korea - Market size and forecast 2025-2030 ($ million)
Data Table on South Korea - Market size and forecast 2025-2030 ($ million)
Chart on South Korea - Year-over-year growth 2025-2030 (%)
Data Table on South Korea - Year-over-year growth 2025-2030 (%)

12.4.5 Australia - Market size and forecast 2025-2030

Chart on Australia - Market size and forecast 2025-2030 ($ million)
Data Table on Australia - Market size and forecast 2025-2030 ($ million)
Chart on Australia - Year-over-year growth 2025-2030 (%)
Data Table on Australia - Year-over-year growth 2025-2030 (%)

12.4.6 Indonesia - Market size and forecast 2025-2030

Chart on Indonesia - Market size and forecast 2025-2030 ($ million)
Data Table on Indonesia - Market size and forecast 2025-2030 ($ million)
Chart on Indonesia - Year-over-year growth 2025-2030 (%)
Data Table on Indonesia - Year-over-year growth 2025-2030 (%)

12.5 North America - Market size and forecast 2025-2030

Chart on North America - Market size and forecast 2025-2030 ($ million)
Data Table on North America - Market size and forecast 2025-2030 ($ million)
Chart on North America - Year-over-year growth 2025-2030 (%)
Data Table on North America - Year-over-year growth 2025-2030 (%)
Chart on Regional Comparison - North America
Data Table on Regional Comparison - North America

12.5.1 US - Market size and forecast 2025-2030

Chart on US - Market size and forecast 2025-2030 ($ million)
Data Table on US - Market size and forecast 2025-2030 ($ million)
Chart on US - Year-over-year growth 2025-2030 (%)
Data Table on US - Year-over-year growth 2025-2030 (%)

12.5.2 Canada - Market size and forecast 2025-2030

Chart on Canada - Market size and forecast 2025-2030 ($ million)
Data Table on Canada - Market size and forecast 2025-2030 ($ million)
Chart on Canada - Year-over-year growth 2025-2030 (%)
Data Table on Canada - Year-over-year growth 2025-2030 (%)

12.5.3 Mexico - Market size and forecast 2025-2030

Chart on Mexico - Market size and forecast 2025-2030 ($ million)
Data Table on Mexico - Market size and forecast 2025-2030 ($ million)
Chart on Mexico - Year-over-year growth 2025-2030 (%)
Data Table on Mexico - Year-over-year growth 2025-2030 (%)

12.6 South America - Market size and forecast 2025-2030

Chart on South America - Market size and forecast 2025-2030 ($ million)
Data Table on South America - Market size and forecast 2025-2030 ($ million)
Chart on South America - Year-over-year growth 2025-2030 (%)
Data Table on South America - Year-over-year growth 2025-2030 (%)
Chart on Regional Comparison - South America
Data Table on Regional Comparison - South America

12.6.1 Brazil - Market size and forecast 2025-2030

Chart on Brazil - Market size and forecast 2025-2030 ($ million)
Data Table on Brazil - Market size and forecast 2025-2030 ($ million)
Chart on Brazil - Year-over-year growth 2025-2030 (%)
Data Table on Brazil - Year-over-year growth 2025-2030 (%)

12.6.2 Argentina - Market size and forecast 2025-2030

Chart on Argentina - Market size and forecast 2025-2030 ($ million)
Data Table on Argentina - Market size and forecast 2025-2030 ($ million)
Chart on Argentina - Year-over-year growth 2025-2030 (%)
Data Table on Argentina - Year-over-year growth 2025-2030 (%)

12.6.3 Chile - Market size and forecast 2025-2030

Chart on Chile - Market size and forecast 2025-2030 ($ million)
Data Table on Chile - Market size and forecast 2025-2030 ($ million)
Chart on Chile - Year-over-year growth 2025-2030 (%)
Data Table on Chile - Year-over-year growth 2025-2030 (%)

12.7 Middle East and Africa - Market size and forecast 2025-2030

Chart on Middle East and Africa - Market size and forecast 2025-2030 ($ million)
Data Table on Middle East and Africa - Market size and forecast 2025-2030 ($ million)
Chart on Middle East and Africa - Year-over-year growth 2025-2030 (%)
Data Table on Middle East and Africa - Year-over-year growth 2025-2030 (%)
Chart on Regional Comparison - Middle East and Africa
Data Table on Regional Comparison - Middle East and Africa

12.7.1 Saudi Arabia - Market size and forecast 2025-2030

Chart on Saudi Arabia - Market size and forecast 2025-2030 ($ million)
Data Table on Saudi Arabia - Market size and forecast 2025-2030 ($ million)
Chart on Saudi Arabia - Year-over-year growth 2025-2030 (%)
Data Table on Saudi Arabia - Year-over-year growth 2025-2030 (%)

12.7.2 South Africa - Market size and forecast 2025-2030

Chart on South Africa - Market size and forecast 2025-2030 ($ million)
Data Table on South Africa - Market size and forecast 2025-2030 ($ million)
Chart on South Africa - Year-over-year growth 2025-2030 (%)
Data Table on South Africa - Year-over-year growth 2025-2030 (%)

12.7.3 Turkey - Market size and forecast 2025-2030

Chart on Turkey - Market size and forecast 2025-2030 ($ million)
Data Table on Turkey - Market size and forecast 2025-2030 ($ million)
Chart on Turkey - Year-over-year growth 2025-2030 (%)
Data Table on Turkey - Year-over-year growth 2025-2030 (%)

12.7.4 UAE - Market size and forecast 2025-2030

Chart on UAE - Market size and forecast 2025-2030 ($ million)
Data Table on UAE - Market size and forecast 2025-2030 ($ million)
Chart on UAE - Year-over-year growth 2025-2030 (%)
Data Table on UAE - Year-over-year growth 2025-2030 (%)

12.7.5 Israel - Market size and forecast 2025-2030

Chart on Israel - Market size and forecast 2025-2030 ($ million)
Data Table on Israel - Market size and forecast 2025-2030 ($ million)
Chart on Israel - Year-over-year growth 2025-2030 (%)
Data Table on Israel - Year-over-year growth 2025-2030 (%)

12.8 Market opportunity by geography

Market opportunity by geography ($ million)
Data Tables on Market opportunity by geography ($ million)

13. Drivers, Challenges, and Opportunity

13.1 Market drivers

Massive global proliferation of sport utility vehicles and light commercial transport platforms
Rapid resurgence and sustained consumer expenditure in outdoor recreational tourism activities
Strategic commercial deployments of advanced motorized retractable towing technologies by luxury automakers

13.2 Market challenges

Severe structural engineering challenges with electric vehicle underbody battery pack configurations
Intense signal calibration vulnerabilities within advanced driver assistance system sensor frameworks
Severe compliance pressures and non harmonized structural performance testing regulations across global marketplaces

13.3 Impact of drivers and challenges

Impact of drivers and challenges in 2025 and 2030

13.4 Market opportunities

Accelerating material integration of ultra high strength lightweight structural carbon alloys
Widespread structural implementation of design forward detachable and hidden automated towbar systems
Strategic deployment of AI synchronized smart load sensing electronic harnesses

14. Competitive Landscape

14.1 Overview

14.2

Overview on criticality of inputs and factors of differentiation

14.3 Landscape disruption

Overview on factors of disruption

14.4 Industry risks

Impact of key risks on business

15. Competitive Analysis

15.1 Companies profiled

Companies covered

15.2 Company ranking index

15.3 Market positioning of companies

Matrix on companies position and classification

15.4 ACPS Automotive GmbH

ACPS Automotive GmbH - Overview
ACPS Automotive GmbH - Product / Service
ACPS Automotive GmbH - Key offerings
SWOT

15.5 AL KO Vehicle Technology

AL KO Vehicle Technology - Overview
AL KO Vehicle Technology - Product / Service
AL KO Vehicle Technology - Key offerings
SWOT

15.6 AUTO HAK SP. Z O.O

AUTO HAK SP. Z O.O - Overview
AUTO HAK SP. Z O.O - Product / Service
AUTO HAK SP. Z O.O - Key offerings
SWOT

15.7 Bosal Nederland BV

Bosal Nederland BV - Overview
Bosal Nederland BV - Product / Service
Bosal Nederland BV - Key offerings
SWOT

15.8 Brink Group B.V.

Brink Group B.V. - Overview
Brink Group B.V. - Product / Service
Brink Group B.V. - Key offerings
SWOT

15.9 CURT Manufacturing LLC

CURT Manufacturing LLC - Overview
CURT Manufacturing LLC - Product / Service
CURT Manufacturing LLC - Key offerings
SWOT

15.10 GDW NV

GDW NV - Overview
GDW NV - Product / Service
GDW NV - Key offerings
SWOT

15.11 Hayman Reese

Hayman Reese - Overview
Hayman Reese - Product / Service
Hayman Reese - Key offerings
SWOT

15.12 North Shore Towbars

North Shore Towbars - Overview
North Shore Towbars - Product / Service
North Shore Towbars - Key offerings
SWOT

15.13 PCT Automotive Ltd.

PCT Automotive Ltd. - Overview
PCT Automotive Ltd. - Product / Service
PCT Automotive Ltd. - Key offerings
SWOT

15.14 Steinhof Sp

Steinhof Sp - Overview
Steinhof Sp - Product / Service
Steinhof Sp - Key offerings
SWOT

15.15 TAG Towbars

TAG Towbars - Overview
TAG Towbars - Product / Service
TAG Towbars - Key offerings
SWOT

15.16 Umbra Rimorchi s.r.l

Umbra Rimorchi s.r.l - Overview
Umbra Rimorchi s.r.l - Product / Service
Umbra Rimorchi s.r.l - Key offerings
SWOT

15.17 Westfalia Automotive GmbH

Westfalia Automotive GmbH - Overview
Westfalia Automotive GmbH - Product / Service
Westfalia Automotive GmbH - Key offerings
SWOT

15.18 Witter Towbar Systems Ltd

Witter Towbar Systems Ltd - Overview
Witter Towbar Systems Ltd - Product / Service
Witter Towbar Systems Ltd - Key offerings
SWOT

16. Appendix

16.1 Scope of the report

Market definition
Objectives
Notes and caveats

16.2 Inclusions and exclusions checklist

Inclusions checklist
Exclusions checklist

16.3 Currency conversion rates for US$

16.4 Research methodology

16.5 Data procurement

Information sources

16.6 Data validation

16.7 Validation techniques employed for market sizing

16.8 Data synthesis

16.9 360 degree market analysis

16.10 List of abbreviations

Research Methodology

Technavio presents a detailed picture of the market by way of study, synthesis, and summation of data from multiple sources. The analysts have presented the various facets of the market with a particular focus on identifying the key industry influencers. The data thus presented is comprehensive, reliable, and the result of extensive research, both primary and secondary.

INFORMATION SOURCES

Primary sources

  • Manufacturers and suppliers
  • Channel partners
  • Industry experts
  • Strategic decision makers

Secondary sources

  • Industry journals and periodicals
  • Government data
  • Financial reports of key industry players
  • Historical data
  • Press releases

DATA ANALYSIS

Data Synthesis

  • Collation of data
  • Estimation of key figures
  • Analysis of derived insights

Data Validation

  • Triangulation with data models
  • Reference against proprietary databases
  • Corroboration with industry experts

REPORT WRITING

Qualitative

  • Market drivers
  • Market challenges
  • Market trends
  • Five forces analysis

Quantitative

  • Market size and forecast
  • Market segmentation
  • Geographical insights
  • Competitive landscape

Interested in this report?

Get your sample now to see our research methodology and insights!

Download Now

Frequently Asked Questions

Automotive Tow Bars market growth will increase by USD 1252.8 million during 2026-2030.

The Automotive Tow Bars market is expected to grow at a CAGR of 4.6% during 2026-2030.

Automotive Tow Bars market is segmented by Product type (Non retractable, Retractable, Swiveling, Others) Vehicle type (Passenger cars, LCVs, HCVs) Channel (OEMs, Aftermarket)

ACPS Automotive GmbH, AL KO Vehicle Technology, AUTO HAK SP. Z O.O, Boronia Tow Bars Pty Ltd, Bosal Nederland BV, Brink Group B.V., CURT Manufacturing LLC, GDW NV, Hayman Reese, MVG, North Shore Towbars, PCT Automotive Ltd., Steinhof Sp, TAG Towbars, Tow Trust Towbars Ltd., Umbra Rimorchi s.r.l, Westfalia Automotive GmbH, Witter Towbar Systems Ltd are a few of the key vendors in the Automotive Tow Bars market.

APAC will register the highest growth rate of 36.3% among the other regions. Therefore, the Automotive Tow Bars market in APAC is expected to garner significant business opportunities for the vendors during the forecast period.

Germany, UK, France, Italy, Spain, The Netherlands, China, Japan, India, South Korea, Australia, Indonesia, US, Canada, Mexico, Brazil, Argentina, Chile, Saudi Arabia, South Africa, Turkey, UAE, Israel

  • Massive global proliferation of sport utility vehicles and light commercial transport platforms is the driving factor this market.

The Automotive Tow Bars market vendors should focus on grabbing business opportunities from the Product type segment as it accounted for the largest market share in the base year.
RIA - Research AI Assistant
Ask RIA
