Autonomous Mobile Robots Market Analysis, Size, and Forecast 2026-2030: North America (US, Canada, and Mexico), APAC (China, Japan, and South Korea), Europe (Germany, UK, and France), Middle East and Africa (UAE, Saudi Arabia, and South Africa), South America (Brazil and Argentina), and Rest of World (ROW)

Autonomous Mobile Robots Market Analysis, Size, and Forecast 2026-2030:
North America (US, Canada, and Mexico), APAC (China, Japan, and South Korea), Europe (Germany, UK, and France), Middle East and Africa (UAE, Saudi Arabia, and South Africa), South America (Brazil and Argentina), and Rest of World (ROW)

Published: Dec 2025 303 Pages SKU: IRTNTR45191

Market Overview at a Glance

$19.04 B
Market Opportunity
34.4%
CAGR 2025 - 2030
35.4%
North America Growth
$1.45 B
Aerospace and defense segment 2024

Autonomous Mobile Robots Market Size 2026-2030

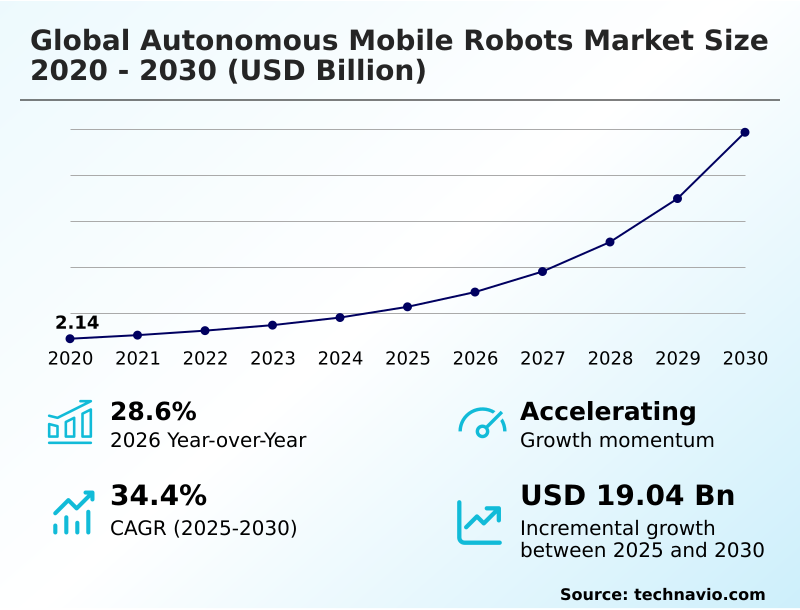
The autonomous mobile robots market size is valued to increase by USD 19.04 billion, at a CAGR of 34.4% from 2025 to 2030. Increasing labor shortages and rising workforce costs will drive the autonomous mobile robots market.

Major Market Trends & Insights

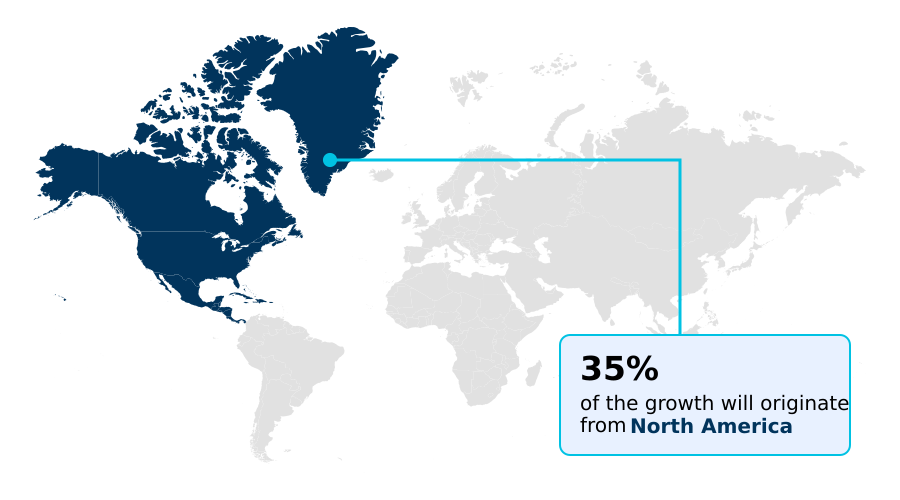
  • North America dominated the market and accounted for a 35.4% growth during the forecast period.
  • By End-user - Aerospace and defense segment was valued at USD 1.45 billion in 2024
  • By Component - Hardware segment accounted for the largest market revenue share in 2024

Market Size & Forecast

  • Market Opportunities: USD 22.53 billion
  • Market Future Opportunities: USD 19.04 billion
  • CAGR from 2025 to 2030 : 34.4%

Market Summary

  • The autonomous mobile robots market is undergoing a significant transformation, driven by the convergence of operational needs and technological maturity. Persistent labor shortages and the high velocity of e-commerce are compelling organizations to rethink intralogistics, moving beyond manual processes toward scalable automation.
  • A key business scenario involves a third-party logistics provider adopting a flexible fleet of autonomous mobile robots to manage seasonal demand spikes without hiring temporary staff, thereby maintaining service level agreements and improving workforce utilization. This shift is facilitated by advancements in AI, which enable robots to navigate complex, dynamic warehouse environments safely alongside human workers.
  • While the initial investment remains a consideration, the adoption of Robots-as-a-Service (RaaS) models is lowering the barrier to entry. However, achieving seamless interoperability between robots from different vendors and integrating them with existing warehouse management systems remains a critical hurdle for unlocking the full potential of these intelligent systems and realizing a truly connected, efficient supply chain.

What will be the Size of the Autonomous Mobile Robots Market during the forecast period?

Get Key Insights on Market Forecast (PDF) Request Free Sample

How is the Autonomous Mobile Robots Market Segmented?

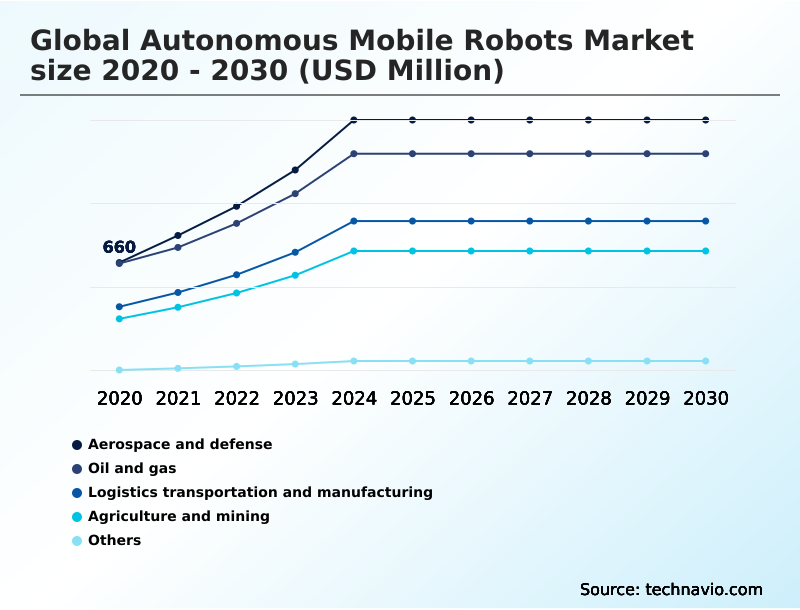
The autonomous mobile robots industry research report provides comprehensive data (region-wise segment analysis), with forecasts and estimates in "USD million" for the period 2026-2030, as well as historical data from 2020-2024 for the following segments.

  • End-user
    • Aerospace and defense
    • Oil and gas
    • Logistics transportation and manufacturing
    • Agriculture and mining
    • Others
  • Component
    • Hardware
    • Software
    • Services
  • Technology
    • Laser or LiDAR
    • Vision guidance
    • Others
  • Geography
    • North America
      • US
      • Canada
      • Mexico
    • APAC
      • China
      • Japan
      • South Korea
    • Europe
      • Germany
      • UK
      • France
    • Middle East and Africa
      • UAE
      • Saudi Arabia
      • South Africa
    • South America
      • Brazil
      • Argentina
    • Rest of World (ROW)

By End-user Insights

The aerospace and defense segment is estimated to witness significant growth during the forecast period.

In the aerospace and defense sector, autonomous logistics solutions are being deployed to modernize supply chains and manufacturing. These systems utilize advanced autonomous navigation and AI-driven path planning to ensure the precise and timely movement of critical components.

The use of vision-guided vehicles and quadrupedal robots enhances automated material handling in both assembly plants and forward-operating bases, improving mission readiness by reducing resupply turnaround times by over 30%.

This shift toward robotic process automation supports predictive maintenance for robots and increases operational resilience in contested environments.

The underlying industrial mobility platforms are also being adapted for adjacent applications, including mining automation robots, demonstrating the versatility of the core lidar sensor fusion technologies.

Request Free Sample

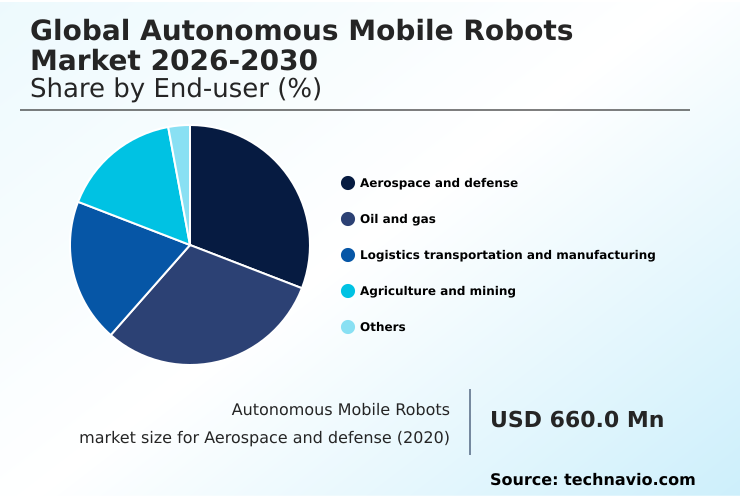
The Aerospace and defense segment was valued at USD 1.45 billion in 2024 and showed a gradual increase during the forecast period.

Request Free Sample

Regional Analysis

North America is estimated to contribute 35.4% to the growth of the global market during the forecast period.Technavio’s analysts have elaborately explained the regional trends and drivers that shape the market during the forecast period.

See How Autonomous Mobile Robots Market Demand is Rising in North America Request Free Sample

The geographic landscape is characterized by distinct regional dynamics, with North America poised to contribute over 35.4% of the market's incremental growth, driven by mature e-commerce and logistics sectors.

In this region, visual slam technology and edge computing in robotics are key differentiators. Meanwhile, APAC is the fastest-growing region, where 5G enabled robotics and swarm intelligence are being rapidly adopted in smart factories, particularly in China and South Korea.

Europe focuses on precision manufacturing, championing interoperability for industrial transport vehicles and heavy-payload transport.

Across all regions, specialized applications are emerging, such as robotics in healthcare logistics and reverse logistics automation, where multi-camera 3d perception improves accuracy for tasks like autonomous inventory tracking.

Market Dynamics

Our researchers analyzed the data with 2025 as the base year, along with the key drivers, trends, and challenges. A holistic analysis of drivers will help companies refine their marketing strategies to gain a competitive advantage.

  • Businesses evaluating the adoption of autonomous mobile robots must consider several strategic factors beyond initial procurement. A thorough analysis of the total cost of autonomous mobile robots deployment is essential, looking past the hardware price to include integration, training, and infrastructure modifications.
  • Calculating the roi for warehouse automation robotics requires a clear understanding of expected efficiency gains and labor cost reductions. Adherence to safety standards for collaborative robots is non-negotiable, particularly when integrating amrs with wms systems to ensure seamless data flow and task management.
  • Choosing the best amr for e-commerce fulfillment often involves a detailed comparison of lidar vs vision guidance for amrs, as each technology offers distinct advantages in different environments. For facilities with mixed fleets, overcoming amr interoperability challenges is a primary concern, making vda 5050 compliance for amrs a critical requirement in many sectors.
  • The rise of raas models for small businesses is democratizing access, though a deep dive into amr fleet management software comparison remains crucial. The benefits of visual slam in amrs, such as enhanced flexibility, are driving adoption, especially in amr applications in automotive industry and for autonomous mobile robots for hospitals.
  • Learning how to implement amrs in existing warehouse environments without significant disruption is key to success, often supported by open source software for mobile robots. Specialized use cases, like amr solutions for cold chain logistics and heavy-duty amrs for industrial transport, demonstrate the technology's adaptability, ultimately focused on reducing operational costs with amrs.
  • Companies that successfully navigate these complexities often see productivity gains more than double those who take a piecemeal approach.

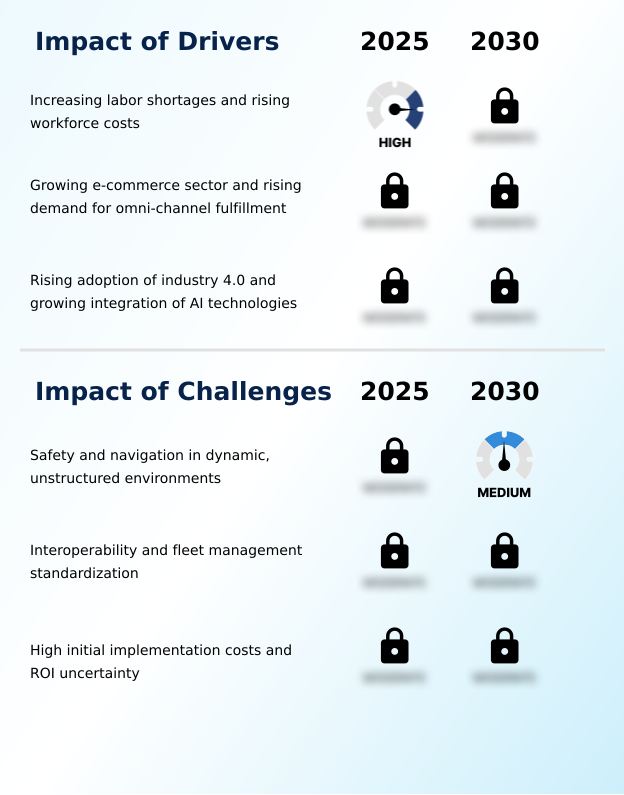
What are the key market drivers leading to the rise in the adoption of Autonomous Mobile Robots Industry?

  • Increasing labor shortages coupled with rising workforce costs are key drivers compelling industries to adopt automation solutions.

  • Market growth is primarily fueled by the intense pressures of modern commerce and persistent labor challenges. The rapid expansion of e-commerce fulfillment automation is a direct response to consumer demand for faster delivery, which requires advanced warehouse automation technologies.
  • Systems built for goods-to-person picking, featuring collaborative mobile robots and sophisticated robotic picking systems, can handle peak season order volumes that are three to four times higher than average.
  • These solutions, including specialized piece-picking robots and sortation robots, are essential for managing omni-channel fulfillment in automated fulfillment centers.
  • With ai-powered fleet coordination, these warehouse robots and systems for robotic order picking directly address labor gaps that can reach up to 20% of the required workforce.

What are the market trends shaping the Autonomous Mobile Robots Industry?

  • The integration of generative artificial intelligence with emerging humanoid form factors represents a transformative trend, creating a new class of general-purpose robots capable of complex reasoning and physical interaction.

  • Key market trends are converging to create more intelligent and versatile automation. The development of foundation models for robotics and the emergence of the bipedal humanoid robot are pushing the boundaries of what general-purpose robots can accomplish in dynamic settings. This enables sophisticated humanoid robot deployment in flexible manufacturing systems designed for human interaction.
  • Concurrently, the drive for interoperability standards like vda 5050 is critical for smart factory integration, allowing for advanced robotic fleet orchestration. This enables facilities to run mobile manipulators alongside other systems seamlessly. Using digital twin simulation, operators can now optimize workflows before deployment, improving task allocation efficiency by over 25% and paving the way for fully automated lights-out warehouses.

What challenges does the Autonomous Mobile Robots Industry face during its growth?

  • Ensuring safe and reliable navigation in dynamic, unstructured environments presents a significant challenge to the widespread adoption and growth of the industry.

  • Despite strong drivers, significant implementation hurdles persist. Ensuring safe human-robot collaboration in dense, dynamic environments remains a primary concern, necessitating advanced fleet management software and 3d vision cameras on mobile cobot systems. The lack of universal interoperability, despite efforts like the massrobotics interoperability standard, often complicates the integration of multi-vendor supply chain robotics, extending deployment timelines by several months.
  • Furthermore, the high initial investment for automated guided vehicles (agvs) and other hardware is a barrier for many, even with the availability of robots-as-a-service (raas) models. Integrating these systems for tasks like automated pallet handling or just-in-time material delivery can require infrastructure upgrades that account for 15-20% of the total project cost.

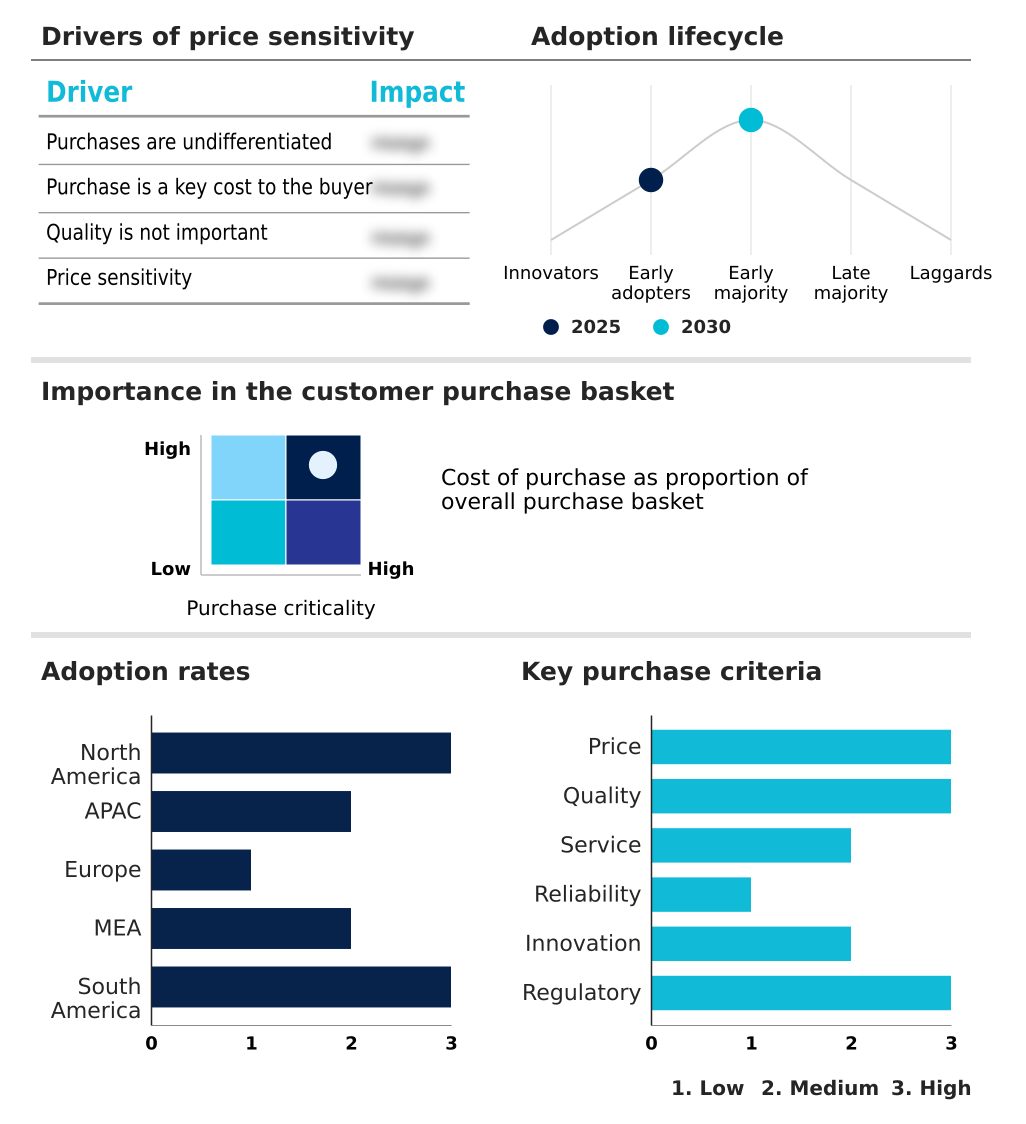
Exclusive Technavio Analysis on Customer Landscape

The autonomous mobile robots market forecasting report includes the adoption lifecycle of the market, covering from the innovator’s stage to the laggard’s stage. It focuses on adoption rates in different regions based on penetration. Furthermore, the autonomous mobile robots market report also includes key purchase criteria and drivers of price sensitivity to help companies evaluate and develop their market growth analysis strategies.

Customer Landscape of Autonomous Mobile Robots Industry

Competitive Landscape

Companies are implementing various strategies, such as strategic alliances, autonomous mobile robots market forecast, partnerships, mergers and acquisitions, geographical expansion, and product/service launches, to enhance their presence in the industry.

6 River Systems Inc. - Offers collaborative mobile robot systems designed to streamline fulfillment automation and enhance warehouse operational workflows.

The industry research and growth report includes detailed analyses of the competitive landscape of the market and information about key companies, including:

  • 6 River Systems Inc.
  • ABB Ltd.
  • Aethon Inc.
  • AGILOX Services GmbH
  • Clearpath Robotics Inc.
  • Fetch Robotics Inc.
  • Geekplus Technology Co. Ltd.
  • Grey Orange Pte. Ltd.
  • inVia Robotics Inc.
  • KUKA AG
  • Locus Robotics Corp.
  • Magazino GmbH
  • Mobile Industrial Robots AS
  • OMRON Corp.
  • Seegrid Corp.
  • Swisslog Holding AG
  • Symbotic Inc.
  • Vecna Robotics Inc.

Qualitative and quantitative analysis of companies has been conducted to help clients understand the wider business environment as well as the strengths and weaknesses of key industry players. Data is qualitatively analyzed to categorize companies as pure play, category-focused, industry-focused, and diversified; it is quantitatively analyzed to categorize companies as dominant, leading, strong, tentative, and weak.

Recent Development and News in Autonomous mobile robots market

  • In September, 2024, Agility Robotics opened RoboFab, a 70,000-square-foot facility in Oregon dedicated to the mass production of its bipedal humanoid robot, Digit, for logistics applications.
  • In October, 2024, ANYbotics entered into a long-term agreement with SLB to provide end-to-end robotics services, deploying its autonomous quadruped robot for inspection and maintenance in the oil and gas industry.
  • In March, 2025, NVIDIA launched its Isaac GR00T foundation model and enhanced software libraries, providing a standardized, hardware-agnostic platform to accelerate the development of autonomous mobile robots and humanoids.
  • In April, 2025, Locus Robotics announced it had surpassed the 5 billion picked items milestone, highlighting the scalability and success of its Robots-as-a-Service (RaaS) subscription model in warehouse fulfillment.

Dive into Technavio’s robust research methodology, blending expert interviews, extensive data synthesis, and validated models for unparalleled Autonomous Mobile Robots Market insights. See full methodology.

Market Scope
Page number 303
Base year 2025
Historic period 2020-2024
Forecast period 2026-2030
Growth momentum & CAGR Accelerate at a CAGR of 34.4%
Market growth 2026-2030 USD 19040.7 million
Market structure Fragmented
YoY growth 2025-2026(%) 28.6%
Key countries US, Canada, Mexico, China, Japan, South Korea, India, Australia, Indonesia, Germany, UK, France, Italy, Spain, The Netherlands, UAE, Saudi Arabia, South Africa, Israel, Egypt, Brazil, Argentina and Chile
Competitive landscape Leading Companies, Market Positioning of Companies, Competitive Strategies, and Industry Risks

Request Free Sample

Research Analyst Overview

  • The market is rapidly evolving beyond simple conveyance, with a strategic pivot toward intelligent, collaborative systems. The integration of advanced autonomous navigation, including simultaneous localization and mapping and visual slam technology, is becoming standard. This allows for sophisticated human-robot collaboration and enables complex applications like robotic picking systems and mobile manipulation.
  • Fleet management software now leverages ai-powered fleet coordination and swarm intelligence to orchestrate diverse fleets of collaborative mobile robots, piece-picking robots, and sortation robots. Interoperability standards, such as vda 5050 and the massrobotics interoperability standard, are addressing vendor lock-in, a key boardroom concern.
  • This shift toward software-defined capabilities, supported by foundation models for robotics and edge computing in robotics, is crucial. As hardware like warehouse robots and vision-guided vehicles becomes more accessible through robots-as-a-service (raas) models, the focus shifts to optimizing robotic process automation to handle tasks like heavy-payload transport, with some deployments reducing order fulfillment cycle times by up to 40%.

What are the Key Data Covered in this Autonomous Mobile Robots Market Research and Growth Report?

  • What is the expected growth of the Autonomous Mobile Robots Market between 2026 and 2030?

    • USD 19.04 billion, at a CAGR of 34.4%

  • What segmentation does the market report cover?

    • The report is segmented by End-user (Aerospace and defense, Oil and gas, Logistics transportation and manufacturing, Agriculture and mining, and Others), Component (Hardware, Software, and Services), Technology (Laser or LiDAR, Vision guidance, and Others) and Geography (North America, APAC, Europe, Middle East and Africa, South America)

  • Which regions are analyzed in the report?

    • North America, APAC, Europe, Middle East and Africa and South America

  • What are the key growth drivers and market challenges?

    • Increasing labor shortages and rising workforce costs, Safety and navigation in dynamic, unstructured environments

  • Who are the major players in the Autonomous Mobile Robots Market?

    • 6 River Systems Inc., ABB Ltd., Aethon Inc., AGILOX Services GmbH, Clearpath Robotics Inc., Fetch Robotics Inc., Geekplus Technology Co. Ltd., Grey Orange Pte. Ltd., inVia Robotics Inc., KUKA AG, Locus Robotics Corp., Magazino GmbH, Mobile Industrial Robots AS, OMRON Corp., Seegrid Corp., Swisslog Holding AG, Symbotic Inc. and Vecna Robotics Inc.

Market Research Insights

  • Market dynamics are shifting as businesses leverage autonomous logistics solutions to achieve significant operational gains, with some facilities reporting that robotic order picking can be up to 80% faster than manual methods. The adoption of warehouse automation technologies is accelerating, driven by the need for more flexible manufacturing systems to support omni-channel fulfillment and just-in-time material delivery.
  • This evolution in supply chain robotics enables companies to meet fluctuating consumer demands, improving throughput by more than double during peak seasons. As a result, investments in intralogistics automation and smart factory integration are becoming central to strategic planning, focusing on scalable and efficient automated material handling.

We can help! Our analysts can customize this autonomous mobile robots market research report to meet your requirements.

Get in touch

1. Executive Summary

1.1 Market overview

Executive Summary - Chart on Market Overview
Executive Summary - Data Table on Market Overview
Executive Summary - Chart on Global Market Characteristics
Executive Summary - Chart on Market by Geography
Executive Summary - Chart on Market Segmentation by End-user
Executive Summary - Chart on Market Segmentation by Component
Executive Summary - Chart on Market Segmentation by Technology
Executive Summary - Chart on Incremental Growth
Executive Summary - Data Table on Incremental Growth
Executive Summary - Chart on Company Market Positioning

2. Technavio Analysis

2.1 Analysis of price sensitivity, lifecycle, customer purchase basket, adoption rates, and purchase criteria

2.2 Criticality of inputs and Factors of differentiation

Chart on Overview on criticality of inputs and factors of differentiation

2.3 Factors of disruption

Chart on Overview on factors of disruption

2.4 Impact of drivers and challenges

Chart on Impact of drivers and challenges in 2025 and 2030

3. Market Landscape

3.1 Market ecosystem

Chart on Parent Market
Data Table on - Parent Market

3.2 Market characteristics

Chart on Market characteristics analysis

3.3 Value chain analysis

Chart on Value chain analysis

4. Market Sizing

4.1 Market definition

Data Table on Offerings of companies included in the market definition

4.2 Market segment analysis

Market segments

4.3 Market size 2025

4.4 Market outlook: Forecast for 2025-2030

Chart on Global - Market size and forecast 2025-2030 ($ million)
Data Table on Global - Market size and forecast 2025-2030 ($ million)
Chart on Global Market: Year-over-year growth 2025-2030 (%)
Data Table on Global Market: Year-over-year growth 2025-2030 (%)

5. Historic Market Size

5.1 Global Autonomous Mobile Robots Market 2020 - 2024

Historic Market Size - Data Table on Global Autonomous Mobile Robots Market 2020 - 2024 ($ million)

5.2 End-user segment analysis 2020 - 2024

Historic Market Size - End-user Segment 2020 - 2024 ($ million)

5.3 Component segment analysis 2020 - 2024

Historic Market Size - Component Segment 2020 - 2024 ($ million)

5.4 Technology segment analysis 2020 - 2024

Historic Market Size - Technology Segment 2020 - 2024 ($ million)

5.5 Geography segment analysis 2020 - 2024

Historic Market Size - Geography Segment 2020 - 2024 ($ million)

5.6 Country segment analysis 2020 - 2024

Historic Market Size - Country Segment 2020 - 2024 ($ million)

6. Qualitative Analysis

6.1 Impact of AI in Global Autonomous Mobile Robots Market

7. Five Forces Analysis

7.1 Five forces summary

Five forces analysis - Comparison between 2025 and 2030

7.2 Bargaining power of buyers

Bargaining power of buyers - Impact of key factors 2025 and 2030

7.3 Bargaining power of suppliers

Bargaining power of suppliers - Impact of key factors in 2025 and 2030

7.4 Threat of new entrants

Threat of new entrants - Impact of key factors in 2025 and 2030

7.5 Threat of substitutes

Threat of substitutes - Impact of key factors in 2025 and 2030

7.6 Threat of rivalry

Threat of rivalry - Impact of key factors in 2025 and 2030

7.7 Market condition

Chart on Market condition - Five forces 2025 and 2030

8. Market Segmentation by End-user

8.1 Market segments

Chart on End-user - Market share 2025-2030 (%)
Data Table on End-user - Market share 2025-2030 (%)

8.2 Comparison by End-user

Chart on Comparison by End-user
Data Table on Comparison by End-user

8.3 Aerospace and defense - Market size and forecast 2025-2030

Chart on Aerospace and defense - Market size and forecast 2025-2030 ($ million)
Data Table on Aerospace and defense - Market size and forecast 2025-2030 ($ million)
Chart on Aerospace and defense - Year-over-year growth 2025-2030 (%)
Data Table on Aerospace and defense - Year-over-year growth 2025-2030 (%)

8.4 Oil and gas - Market size and forecast 2025-2030

Chart on Oil and gas - Market size and forecast 2025-2030 ($ million)
Data Table on Oil and gas - Market size and forecast 2025-2030 ($ million)
Chart on Oil and gas - Year-over-year growth 2025-2030 (%)
Data Table on Oil and gas - Year-over-year growth 2025-2030 (%)

8.5 Logistics transportation and manufacturing - Market size and forecast 2025-2030

Chart on Logistics transportation and manufacturing - Market size and forecast 2025-2030 ($ million)
Data Table on Logistics transportation and manufacturing - Market size and forecast 2025-2030 ($ million)
Chart on Logistics transportation and manufacturing - Year-over-year growth 2025-2030 (%)
Data Table on Logistics transportation and manufacturing - Year-over-year growth 2025-2030 (%)

8.6 Agriculture and mining - Market size and forecast 2025-2030

Chart on Agriculture and mining - Market size and forecast 2025-2030 ($ million)
Data Table on Agriculture and mining - Market size and forecast 2025-2030 ($ million)
Chart on Agriculture and mining - Year-over-year growth 2025-2030 (%)
Data Table on Agriculture and mining - Year-over-year growth 2025-2030 (%)

8.7 Others - Market size and forecast 2025-2030

Chart on Others - Market size and forecast 2025-2030 ($ million)
Data Table on Others - Market size and forecast 2025-2030 ($ million)
Chart on Others - Year-over-year growth 2025-2030 (%)
Data Table on Others - Year-over-year growth 2025-2030 (%)

8.8 Market opportunity by End-user

Market opportunity by End-user ($ million)
Data Table on Market opportunity by End-user ($ million)

9. Market Segmentation by Component

9.1 Market segments

Chart on Component - Market share 2025-2030 (%)
Data Table on Component - Market share 2025-2030 (%)

9.2 Comparison by Component

Chart on Comparison by Component
Data Table on Comparison by Component

9.3 Hardware - Market size and forecast 2025-2030

Chart on Hardware - Market size and forecast 2025-2030 ($ million)
Data Table on Hardware - Market size and forecast 2025-2030 ($ million)
Chart on Hardware - Year-over-year growth 2025-2030 (%)
Data Table on Hardware - Year-over-year growth 2025-2030 (%)

9.4 Software - Market size and forecast 2025-2030

Chart on Software - Market size and forecast 2025-2030 ($ million)
Data Table on Software - Market size and forecast 2025-2030 ($ million)
Chart on Software - Year-over-year growth 2025-2030 (%)
Data Table on Software - Year-over-year growth 2025-2030 (%)

9.5 Services - Market size and forecast 2025-2030

Chart on Services - Market size and forecast 2025-2030 ($ million)
Data Table on Services - Market size and forecast 2025-2030 ($ million)
Chart on Services - Year-over-year growth 2025-2030 (%)
Data Table on Services - Year-over-year growth 2025-2030 (%)

9.6 Market opportunity by Component

Market opportunity by Component ($ million)
Data Table on Market opportunity by Component ($ million)

10. Market Segmentation by Technology

10.1 Market segments

Chart on Technology - Market share 2025-2030 (%)
Data Table on Technology - Market share 2025-2030 (%)

10.2 Comparison by Technology

Chart on Comparison by Technology
Data Table on Comparison by Technology

10.3 Laser or LiDAR - Market size and forecast 2025-2030

Chart on Laser or LiDAR - Market size and forecast 2025-2030 ($ million)
Data Table on Laser or LiDAR - Market size and forecast 2025-2030 ($ million)
Chart on Laser or LiDAR - Year-over-year growth 2025-2030 (%)
Data Table on Laser or LiDAR - Year-over-year growth 2025-2030 (%)

10.4 Vision guidance - Market size and forecast 2025-2030

Chart on Vision guidance - Market size and forecast 2025-2030 ($ million)
Data Table on Vision guidance - Market size and forecast 2025-2030 ($ million)
Chart on Vision guidance - Year-over-year growth 2025-2030 (%)
Data Table on Vision guidance - Year-over-year growth 2025-2030 (%)

10.5 Others - Market size and forecast 2025-2030

Chart on Others - Market size and forecast 2025-2030 ($ million)
Data Table on Others - Market size and forecast 2025-2030 ($ million)
Chart on Others - Year-over-year growth 2025-2030 (%)
Data Table on Others - Year-over-year growth 2025-2030 (%)

10.6 Market opportunity by Technology

Market opportunity by Technology ($ million)
Data Table on Market opportunity by Technology ($ million)

11. Customer Landscape

11.1 Customer landscape overview

Analysis of price sensitivity, lifecycle, customer purchase basket, adoption rates, and purchase criteria

12. Geographic Landscape

12.1 Geographic segmentation

Chart on Market share by geography 2025-2030 (%)
Data Table on Market share by geography 2025-2030 (%)

12.2 Geographic comparison

Chart on Geographic comparison
Data Table on Geographic comparison

12.3 North America - Market size and forecast 2025-2030

Chart on North America - Market size and forecast 2025-2030 ($ million)
Data Table on North America - Market size and forecast 2025-2030 ($ million)
Chart on North America - Year-over-year growth 2025-2030 (%)
Data Table on North America - Year-over-year growth 2025-2030 (%)
Chart on Regional Comparison - North America
Data Table on Regional Comparison - North America

12.3.1 US - Market size and forecast 2025-2030

Chart on US - Market size and forecast 2025-2030 ($ million)
Data Table on US - Market size and forecast 2025-2030 ($ million)
Chart on US - Year-over-year growth 2025-2030 (%)
Data Table on US - Year-over-year growth 2025-2030 (%)

12.3.2 Canada - Market size and forecast 2025-2030

Chart on Canada - Market size and forecast 2025-2030 ($ million)
Data Table on Canada - Market size and forecast 2025-2030 ($ million)
Chart on Canada - Year-over-year growth 2025-2030 (%)
Data Table on Canada - Year-over-year growth 2025-2030 (%)

12.3.3 Mexico - Market size and forecast 2025-2030

Chart on Mexico - Market size and forecast 2025-2030 ($ million)
Data Table on Mexico - Market size and forecast 2025-2030 ($ million)
Chart on Mexico - Year-over-year growth 2025-2030 (%)
Data Table on Mexico - Year-over-year growth 2025-2030 (%)

12.4 APAC - Market size and forecast 2025-2030

Chart on APAC - Market size and forecast 2025-2030 ($ million)
Data Table on APAC - Market size and forecast 2025-2030 ($ million)
Chart on APAC - Year-over-year growth 2025-2030 (%)
Data Table on APAC - Year-over-year growth 2025-2030 (%)
Chart on Regional Comparison - APAC
Data Table on Regional Comparison - APAC

12.4.1 China - Market size and forecast 2025-2030

Chart on China - Market size and forecast 2025-2030 ($ million)
Data Table on China - Market size and forecast 2025-2030 ($ million)
Chart on China - Year-over-year growth 2025-2030 (%)
Data Table on China - Year-over-year growth 2025-2030 (%)

12.4.2 Japan - Market size and forecast 2025-2030

Chart on Japan - Market size and forecast 2025-2030 ($ million)
Data Table on Japan - Market size and forecast 2025-2030 ($ million)
Chart on Japan - Year-over-year growth 2025-2030 (%)
Data Table on Japan - Year-over-year growth 2025-2030 (%)

12.4.3 South Korea - Market size and forecast 2025-2030

Chart on South Korea - Market size and forecast 2025-2030 ($ million)
Data Table on South Korea - Market size and forecast 2025-2030 ($ million)
Chart on South Korea - Year-over-year growth 2025-2030 (%)
Data Table on South Korea - Year-over-year growth 2025-2030 (%)

12.4.4 India - Market size and forecast 2025-2030

Chart on India - Market size and forecast 2025-2030 ($ million)
Data Table on India - Market size and forecast 2025-2030 ($ million)
Chart on India - Year-over-year growth 2025-2030 (%)
Data Table on India - Year-over-year growth 2025-2030 (%)

12.4.5 Australia - Market size and forecast 2025-2030

Chart on Australia - Market size and forecast 2025-2030 ($ million)
Data Table on Australia - Market size and forecast 2025-2030 ($ million)
Chart on Australia - Year-over-year growth 2025-2030 (%)
Data Table on Australia - Year-over-year growth 2025-2030 (%)

12.4.6 Indonesia - Market size and forecast 2025-2030

Chart on Indonesia - Market size and forecast 2025-2030 ($ million)
Data Table on Indonesia - Market size and forecast 2025-2030 ($ million)
Chart on Indonesia - Year-over-year growth 2025-2030 (%)
Data Table on Indonesia - Year-over-year growth 2025-2030 (%)

12.5 Europe - Market size and forecast 2025-2030

Chart on Europe - Market size and forecast 2025-2030 ($ million)
Data Table on Europe - Market size and forecast 2025-2030 ($ million)
Chart on Europe - Year-over-year growth 2025-2030 (%)
Data Table on Europe - Year-over-year growth 2025-2030 (%)
Chart on Regional Comparison - Europe
Data Table on Regional Comparison - Europe

12.5.1 Germany - Market size and forecast 2025-2030

Chart on Germany - Market size and forecast 2025-2030 ($ million)
Data Table on Germany - Market size and forecast 2025-2030 ($ million)
Chart on Germany - Year-over-year growth 2025-2030 (%)
Data Table on Germany - Year-over-year growth 2025-2030 (%)

12.5.2 UK - Market size and forecast 2025-2030

Chart on UK - Market size and forecast 2025-2030 ($ million)
Data Table on UK - Market size and forecast 2025-2030 ($ million)
Chart on UK - Year-over-year growth 2025-2030 (%)
Data Table on UK - Year-over-year growth 2025-2030 (%)

12.5.3 France - Market size and forecast 2025-2030

Chart on France - Market size and forecast 2025-2030 ($ million)
Data Table on France - Market size and forecast 2025-2030 ($ million)
Chart on France - Year-over-year growth 2025-2030 (%)
Data Table on France - Year-over-year growth 2025-2030 (%)

12.5.4 Italy - Market size and forecast 2025-2030

Chart on Italy - Market size and forecast 2025-2030 ($ million)
Data Table on Italy - Market size and forecast 2025-2030 ($ million)
Chart on Italy - Year-over-year growth 2025-2030 (%)
Data Table on Italy - Year-over-year growth 2025-2030 (%)

12.5.5 Spain - Market size and forecast 2025-2030

Chart on Spain - Market size and forecast 2025-2030 ($ million)
Data Table on Spain - Market size and forecast 2025-2030 ($ million)
Chart on Spain - Year-over-year growth 2025-2030 (%)
Data Table on Spain - Year-over-year growth 2025-2030 (%)

12.5.6 The Netherlands - Market size and forecast 2025-2030

Chart on The Netherlands - Market size and forecast 2025-2030 ($ million)
Data Table on The Netherlands - Market size and forecast 2025-2030 ($ million)
Chart on The Netherlands - Year-over-year growth 2025-2030 (%)
Data Table on The Netherlands - Year-over-year growth 2025-2030 (%)

12.6 Middle East and Africa - Market size and forecast 2025-2030

Chart on Middle East and Africa - Market size and forecast 2025-2030 ($ million)
Data Table on Middle East and Africa - Market size and forecast 2025-2030 ($ million)
Chart on Middle East and Africa - Year-over-year growth 2025-2030 (%)
Data Table on Middle East and Africa - Year-over-year growth 2025-2030 (%)
Chart on Regional Comparison - Middle East and Africa
Data Table on Regional Comparison - Middle East and Africa

12.6.1 UAE - Market size and forecast 2025-2030

Chart on UAE - Market size and forecast 2025-2030 ($ million)
Data Table on UAE - Market size and forecast 2025-2030 ($ million)
Chart on UAE - Year-over-year growth 2025-2030 (%)
Data Table on UAE - Year-over-year growth 2025-2030 (%)

12.6.2 Saudi Arabia - Market size and forecast 2025-2030

Chart on Saudi Arabia - Market size and forecast 2025-2030 ($ million)
Data Table on Saudi Arabia - Market size and forecast 2025-2030 ($ million)
Chart on Saudi Arabia - Year-over-year growth 2025-2030 (%)
Data Table on Saudi Arabia - Year-over-year growth 2025-2030 (%)

12.6.3 South Africa - Market size and forecast 2025-2030

Chart on South Africa - Market size and forecast 2025-2030 ($ million)
Data Table on South Africa - Market size and forecast 2025-2030 ($ million)
Chart on South Africa - Year-over-year growth 2025-2030 (%)
Data Table on South Africa - Year-over-year growth 2025-2030 (%)

12.6.4 Israel - Market size and forecast 2025-2030

Chart on Israel - Market size and forecast 2025-2030 ($ million)
Data Table on Israel - Market size and forecast 2025-2030 ($ million)
Chart on Israel - Year-over-year growth 2025-2030 (%)
Data Table on Israel - Year-over-year growth 2025-2030 (%)

12.6.5 Egypt - Market size and forecast 2025-2030

Chart on Egypt - Market size and forecast 2025-2030 ($ million)
Data Table on Egypt - Market size and forecast 2025-2030 ($ million)
Chart on Egypt - Year-over-year growth 2025-2030 (%)
Data Table on Egypt - Year-over-year growth 2025-2030 (%)

12.7 South America - Market size and forecast 2025-2030

Chart on South America - Market size and forecast 2025-2030 ($ million)
Data Table on South America - Market size and forecast 2025-2030 ($ million)
Chart on South America - Year-over-year growth 2025-2030 (%)
Data Table on South America - Year-over-year growth 2025-2030 (%)
Chart on Regional Comparison - South America
Data Table on Regional Comparison - South America

12.7.1 Brazil - Market size and forecast 2025-2030

Chart on Brazil - Market size and forecast 2025-2030 ($ million)
Data Table on Brazil - Market size and forecast 2025-2030 ($ million)
Chart on Brazil - Year-over-year growth 2025-2030 (%)
Data Table on Brazil - Year-over-year growth 2025-2030 (%)

12.7.2 Argentina - Market size and forecast 2025-2030

Chart on Argentina - Market size and forecast 2025-2030 ($ million)
Data Table on Argentina - Market size and forecast 2025-2030 ($ million)
Chart on Argentina - Year-over-year growth 2025-2030 (%)
Data Table on Argentina - Year-over-year growth 2025-2030 (%)

12.7.3 Chile - Market size and forecast 2025-2030

Chart on Chile - Market size and forecast 2025-2030 ($ million)
Data Table on Chile - Market size and forecast 2025-2030 ($ million)
Chart on Chile - Year-over-year growth 2025-2030 (%)
Data Table on Chile - Year-over-year growth 2025-2030 (%)

12.8 Market opportunity by geography

Market opportunity by geography ($ million)
Data Tables on Market opportunity by geography ($ million)

13. Drivers, Challenges, and Opportunity

13.1 Market drivers

Increasing labor shortages and rising workforce costs
Growing e-commerce sector and rising demand for omni-channel fulfillment
Rising adoption of industry 4.0 and growing integration of AI technologies

13.2 Market challenges

Safety and navigation in dynamic, unstructured environments
Interoperability and fleet management standardization
High initial implementation costs and ROI uncertainty

13.3 Impact of drivers and challenges

Impact of drivers and challenges in 2025 and 2030

13.4 Market opportunities

Integration of generative artificial intelligence and humanoid form factors
Interoperability and rise of software-defined automation
Expansion of robots as service and subscription business models

14. Competitive Landscape

14.1 Overview

14.2

Overview on criticality of inputs and factors of differentiation

14.3 Landscape disruption

Overview on factors of disruption

14.4 Industry risks

Impact of key risks on business

15. Competitive Analysis

15.1 Companies profiled

Companies covered

15.2 Company ranking index

15.3 Market positioning of companies

Matrix on companies position and classification

15.4 6 River Systems Inc.

6 River Systems Inc. - Overview
6 River Systems Inc. - Product / Service
6 River Systems Inc. - Key offerings
SWOT

15.5 ABB Ltd.

ABB Ltd. - Overview
ABB Ltd. - Business segments
ABB Ltd. - Key news
ABB Ltd. - Key offerings
ABB Ltd. - Segment focus
SWOT

15.6 Aethon Inc.

Aethon Inc. - Overview
Aethon Inc. - Product / Service
Aethon Inc. - Key offerings
SWOT

15.7 AGILOX Services GmbH

AGILOX Services GmbH - Overview
AGILOX Services GmbH - Product / Service
AGILOX Services GmbH - Key offerings
SWOT

15.8 Clearpath Robotics Inc.

Clearpath Robotics Inc. - Overview
Clearpath Robotics Inc. - Product / Service
Clearpath Robotics Inc. - Key news
Clearpath Robotics Inc. - Key offerings
SWOT

15.9 Fetch Robotics Inc.

Fetch Robotics Inc. - Overview
Fetch Robotics Inc. - Product / Service
Fetch Robotics Inc. - Key offerings
SWOT

15.10 Geekplus Technology Co. Ltd.

Geekplus Technology Co. Ltd. - Overview
Geekplus Technology Co. Ltd. - Product / Service
Geekplus Technology Co. Ltd. - Key offerings
SWOT

15.11 Grey Orange Pte. Ltd.

Grey Orange Pte. Ltd. - Overview
Grey Orange Pte. Ltd. - Product / Service
Grey Orange Pte. Ltd. - Key offerings
SWOT

15.12 inVia Robotics Inc.

inVia Robotics Inc. - Overview
inVia Robotics Inc. - Product / Service
inVia Robotics Inc. - Key offerings
SWOT

15.13 KUKA AG

KUKA AG - Overview
KUKA AG - Business segments
KUKA AG - Key offerings
KUKA AG - Segment focus
SWOT

15.14 Locus Robotics Corp.

Locus Robotics Corp. - Overview
Locus Robotics Corp. - Product / Service
Locus Robotics Corp. - Key offerings
SWOT

15.15 Magazino GmbH

Magazino GmbH - Overview
Magazino GmbH - Product / Service
Magazino GmbH - Key offerings
SWOT

15.16 Mobile Industrial Robots AS

Mobile Industrial Robots AS - Overview
Mobile Industrial Robots AS - Product / Service
Mobile Industrial Robots AS - Key offerings
SWOT

15.17 OMRON Corp.

OMRON Corp. - Overview
OMRON Corp. - Business segments
OMRON Corp. - Key news
OMRON Corp. - Key offerings
OMRON Corp. - Segment focus
SWOT

15.18 Seegrid Corp.

Seegrid Corp. - Overview
Seegrid Corp. - Product / Service
Seegrid Corp. - Key offerings
SWOT

16. Appendix

16.1 Scope of the report

Market definition
Objectives
Notes and caveats

16.2 Inclusions and exclusions checklist

Inclusions checklist
Exclusions checklist

16.3 Currency conversion rates for US$

16.4 Research methodology

16.5 Data procurement

Information sources

16.6 Data validation

16.7 Validation techniques employed for market sizing

16.8 Data synthesis

16.9 360 degree market analysis

16.10 List of abbreviations

Research Methodology

Technavio presents a detailed picture of the market by way of study, synthesis, and summation of data from multiple sources. The analysts have presented the various facets of the market with a particular focus on identifying the key industry influencers. The data thus presented is comprehensive, reliable, and the result of extensive research, both primary and secondary.

INFORMATION SOURCES

Primary sources

  • Manufacturers and suppliers
  • Channel partners
  • Industry experts
  • Strategic decision makers

Secondary sources

  • Industry journals and periodicals
  • Government data
  • Financial reports of key industry players
  • Historical data
  • Press releases

DATA ANALYSIS

Data Synthesis

  • Collation of data
  • Estimation of key figures
  • Analysis of derived insights

Data Validation

  • Triangulation with data models
  • Reference against proprietary databases
  • Corroboration with industry experts

REPORT WRITING

Qualitative

  • Market drivers
  • Market challenges
  • Market trends
  • Five forces analysis

Quantitative

  • Market size and forecast
  • Market segmentation
  • Geographical insights
  • Competitive landscape

Interested in this report?

Get your sample now to see our research methodology and insights!

Download Now

Frequently Asked Questions

Autonomous Mobile Robots market growth will increase by USD 19040.7 million during 2026-2030.

The Autonomous Mobile Robots market is expected to grow at a CAGR of 34.4% during 2026-2030.

Autonomous Mobile Robots market is segmented by End-user (Aerospace and defense, Oil and gas, Logistics transportation and manufacturing, Agriculture and mining, Others) Component (Hardware, Software, Services) Technology (Laser or LiDAR, Vision guidance, Others)

6 River Systems Inc., ABB Ltd., Aethon Inc., AGILOX Services GmbH, Clearpath Robotics Inc., Fetch Robotics Inc., Geekplus Technology Co. Ltd., Grey Orange Pte. Ltd., inVia Robotics Inc., KUKA AG, Locus Robotics Corp., Magazino GmbH, Mobile Industrial Robots AS, OMRON Corp., Seegrid Corp., Swisslog Holding AG, Symbotic Inc., Vecna Robotics Inc. are a few of the key vendors in the Autonomous Mobile Robots market.

North America will register the highest growth rate of 35.4% among the other regions. Therefore, the Autonomous Mobile Robots market in North America is expected to garner significant business opportunities for the vendors during the forecast period.

US, Canada, Mexico, China, Japan, South Korea, India, Australia, Indonesia, Germany, UK, France, Italy, Spain, The Netherlands, UAE, Saudi Arabia, South Africa, Israel, Egypt, Brazil, Argentina, Chile

  • Increasing labor shortages and rising workforce costs is the driving factor this market.

The Autonomous Mobile Robots market vendors should focus on grabbing business opportunities from the End-user segment as it accounted for the largest market share in the base year.