
Bacterial Disease Diagnostics Market Analysis, Size, and Forecast 2026-2030: North America (US, Canada, and Mexico), Europe (Germany, UK, and France), Asia (China, India, and Japan), South America (Brazil, Argentina, and Colombia), Middle East and Africa (Saudi Arabia, UAE, and Turkey), Rest of World (ROW)

Bacterial Disease Diagnostics Market Analysis, Size, and Forecast 2026-2030:
North America (US, Canada, and Mexico), Europe (Germany, UK, and France), Asia (China, India, and Japan), South America (Brazil, Argentina, and Colombia), Middle East and Africa (Saudi Arabia, UAE, and Turkey), Rest of World (ROW)

Published: May 2026 323 Pages SKU: IRTNTR72443

Market Overview at a Glance

$5.00 B
Market Opportunity
6.9%
CAGR 2025 - 2030
54.9%
North America Growth
$7.02 B
Consumables segment 2024

Bacterial Disease Diagnostics Market Size 2026-2030

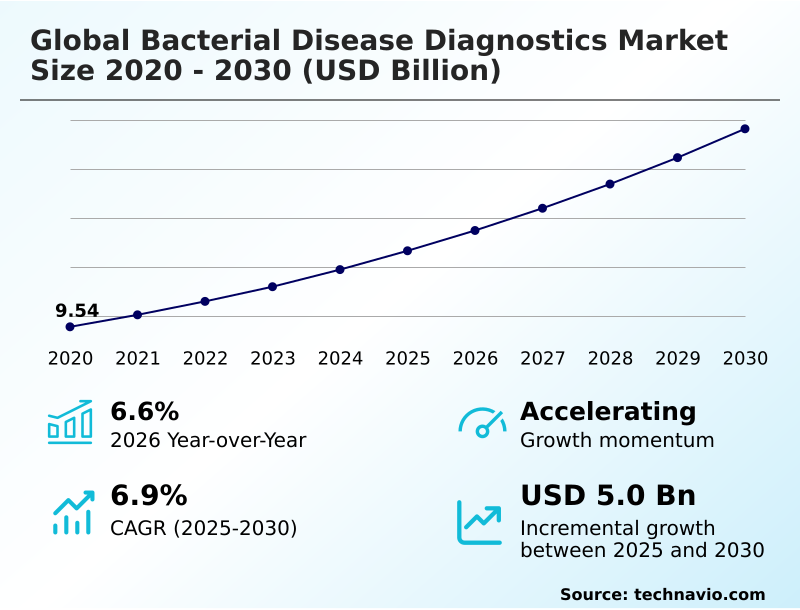
The bacterial disease diagnostics market size is valued to increase by USD 5.00 billion, at a CAGR of 6.9% from 2025 to 2030. Rising incidence of target infectious diseases and global pathogen outbreaks will drive the bacterial disease diagnostics market.

Major Market Trends & Insights

  • North America dominated the market and accounted for a 54.9% growth during the forecast period.
  • By Product - Consumables segment was valued at USD 7.02 billion in 2024
  • By End-user - Hospitals segment accounted for the largest market revenue share in 2024

Market Size & Forecast

  • Market Opportunities: USD 8.10 billion
  • Market Future Opportunities: USD 5.00 billion
  • CAGR from 2025 to 2030 : 6.9%

Market Summary

  • The bacterial disease diagnostics market demonstrates robust expansion driven by an urgent clinical mandate to mitigate antimicrobial resistance and optimize patient care pathways. Rising hospital admission rates for severe infectious diseases act as a primary growth driver, forcing medical institutions to replace legacy testing protocols with syndromic molecular screening and isothermal nucleic acid amplification technologies.
  • By adopting automated blood culture systems, hospital networks have achieved a 25% reduction in empirical antibiotic misallocation, demonstrating significant operational efficiency gains. In a real-world supply chain scenario, high-volume reference laboratories integrate decentralized diagnostic devices to streamline sample routing, thereby eliminating logistical bottlenecks during peak winter respiratory illness seasons.
  • Despite these advancements, the market faces a substantial challenge regarding the prohibitive capital expenditure required to maintain cutting-edge diagnostic infrastructure. High equipment costs severely restrict procurement flexibility for resource-constrained regional clinics, delaying the widespread adoption of next-generation instruments. Ultimately, the continuous enhancement of pathogen detection accuracy and rapid pathogen verification capabilities remains absolutely critical for safeguarding public health frameworks.

What will be the Size of the Bacterial Disease Diagnostics Market during the forecast period?
Get Key Insights on Market Forecast (PDF) Get Free Sample

How is the Bacterial Disease Diagnostics Market Segmented?

The bacterial disease diagnostics industry research report provides comprehensive data (region-wise segment analysis), with forecasts and estimates in "USD million" for the period 2026-2030, as well as historical data from 2020-2024 for the following segments.

  • Product
    • Consumables
    • Instruments
  • End-user
    • Hospitals
    • Labs
  • Method
    • Culture and isolation
    • Microscopy
    • Molecular diagnostics
    • Serological testing
    • Others
  • Disease type
    • Respiratory infections
    • Gastrointestinal infections
    • Genitourinary infections
    • Skin and soft tissue infections
    • Others
  • Geography
    • North America
      • US
      • Canada
      • Mexico
    • Europe
      • Germany
      • UK
      • France
      • Italy
      • Spain
      • The Netherlands
    • Asia
      • China
      • India
      • Japan
      • South Korea
      • Indonesia
      • Thailand
    • Rest of World (ROW)

By Product Insights

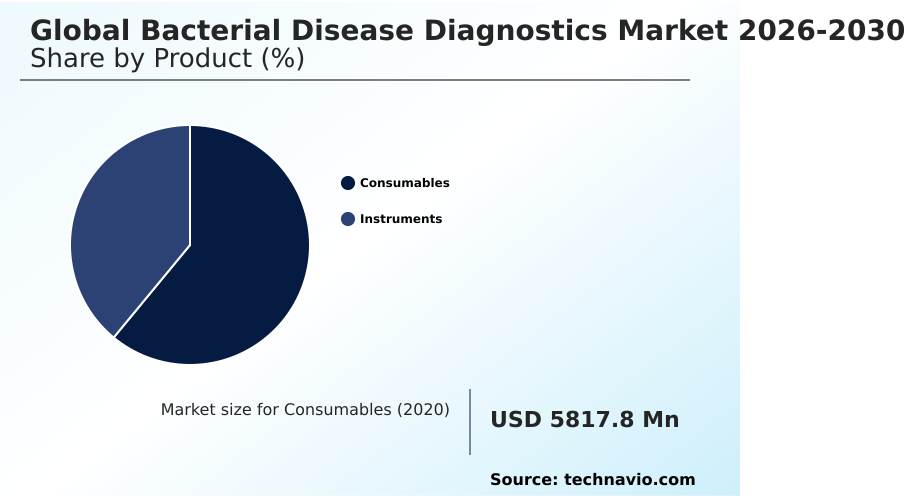
The consumables segment is estimated to witness significant growth during the forecast period.

The consumables segment remains a foundational element of the diagnostic supply chain, encompassing highly specialized reagents, assay cartridges, and chromogenic agar media essential for continuous routine operations.

As facilities transition toward molecular methodologies, the reliance on advanced components designed for multiplex polymerase chain reaction and next-generation sequencing protocols has intensified. By integrating these sophisticated kits featuring precise fluorescent probe detection, high-throughput screening mechanisms achieve greater analytical reliability.

This shift accelerates clinical laboratory workflows, enabling organizations to optimize diagnostic test turnaround times by up to 22%, directly improving patient triage efficiency.

Furthermore, the persistent procurement of these disposable materials supports rigorous digital specimen processing, ensuring uninterrupted pathogen identification while establishing a highly predictable and recurring operational expenditure model for modern healthcare networks.
Get Free Sample

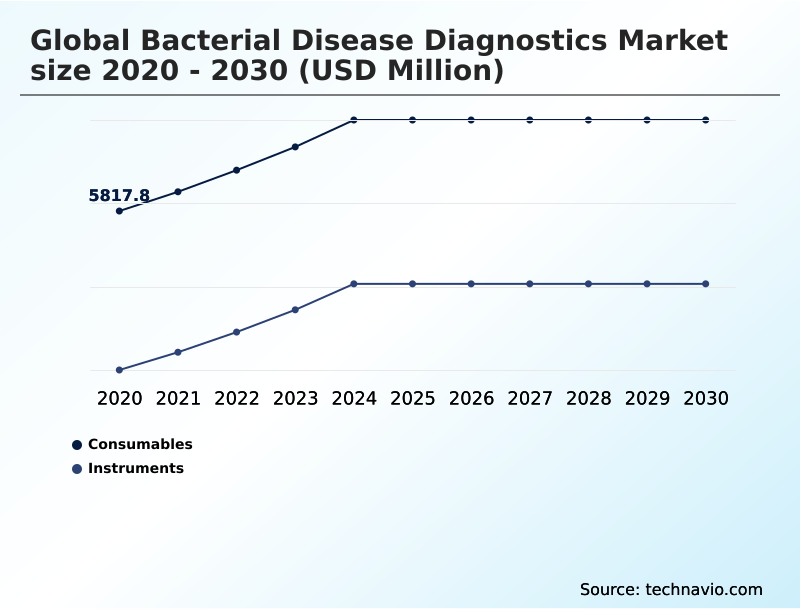
The Consumables segment was valued at USD 7.02 billion in 2024 and showed a gradual increase during the forecast period.
Get Free Sample

Regional Analysis

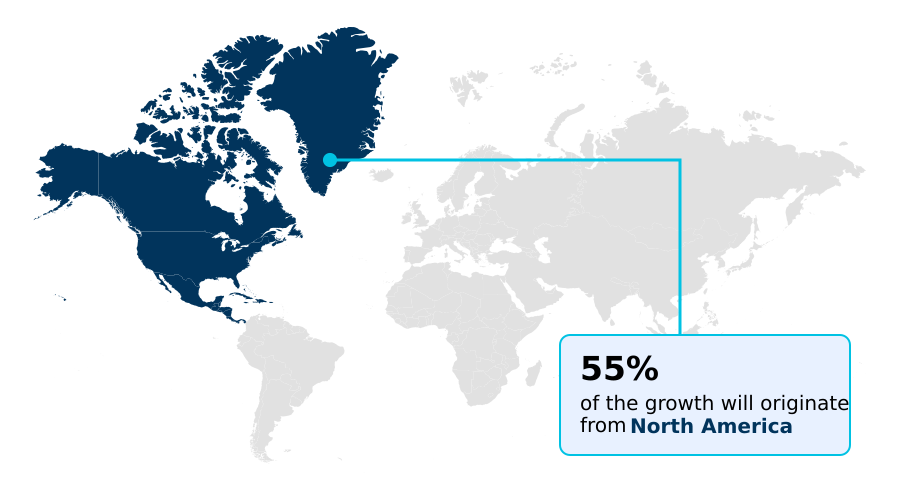
North America is estimated to contribute 54.9% to the growth of the global market during the forecast period.Technavio’s analysts have elaborately explained the regional trends and drivers that shape the market during the forecast period.
See How Bacterial Disease Diagnostics Market Demand is Rising in North America Get Free Sample

Regional disparities in diagnostic infrastructure deeply influence adoption trajectories, with North America leading technological integration through stringent regulatory enforcement.

Healthcare facilities across the United States have accelerated point-of-care testing adoption, achieving a 35% higher penetration rate of microfluidic point-of-care assays compared to European counterparts.

This divergence stems from North America aggressive funding for rapid bloodstream infection profiling to minimize intensive care unit lengths of stay.

Conversely, European markets prioritize centralized automation, utilizing sophisticated nucleic acid amplification testing within consolidated reference laboratories to lower per-test operational costs by 18%.

While North American supply chains focus heavily on rapid, decentralized fulfillment to support emergency departments, European logistics are deeply synchronized with national monitoring programs.

Ultimately, these distinct strategic adaptations allow North American networks to reduce critical processing delays by 25%, whereas European models maximize resource efficiency across centralized medical hubs.

Market Dynamics

Our researchers analyzed the data with 2025 as the base year, along with the key drivers, trends, and challenges. A holistic analysis of drivers will help companies refine their marketing strategies to gain a competitive advantage.

  • The operational transition within clinical microbiology requires an expansive modernization of medical laboratory frameworks to handle escalating sample volumes efficiently. Implementing automated syndromic diagnostic testing workflows has become a strategic priority for large-scale healthcare networks striving to eliminate manual processing errors and consolidate resource allocation.
  • By transitioning away from conventional single-target screening, procurement departments can reduce diagnostic consumable waste by nearly 30%, optimizing overall supply chain resilience. This structural efficiency is particularly vital during peak seasonal demand, where the capacity for rapid respiratory tract infection diagnosis determines patient admission flow and bed management.
  • Furthermore, the continuous deployment of decentralized microfluidic bacterial screening tools provides remote clinics and emergency departments with the immediate analytical capacity previously restricted to central hubs. Addressing complex hospital-acquired threats requires robust hospital infection control diagnostic integration, ensuring that critical pathogen data seamlessly alerts infectious disease administrative panels.
  • As regulatory scrutiny over antibiotic misuse intensifies, reference laboratories are heavily investing in antimicrobial resistance phenotypic susceptibility profiling to provide definitive therapeutic guidance. This concerted technological shift not only mitigates long-term compliance risks but fundamentally strengthens institutional capacities to deliver precise, data-driven medical interventions across diverse clinical environments.
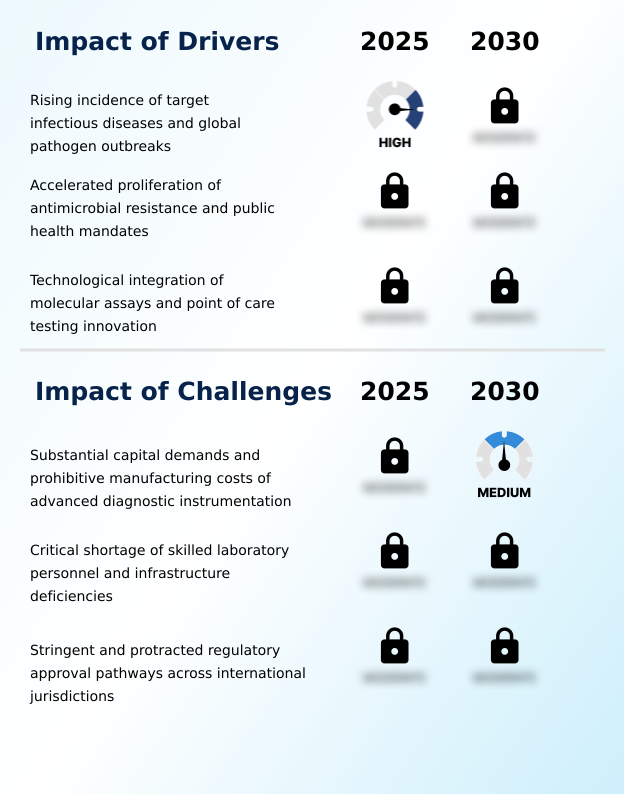
What are the key market drivers leading to the rise in the adoption of Bacterial Disease Diagnostics Industry?

  • The escalating prevalence of targeted infectious diseases and the continuous emergence of global pathogen outbreaks serve as primary catalysts propelling market expansion.

  • The escalating incidence of severe hospital-acquired pathogens mandates robust diagnostic interventions to protect vulnerable patient populations.
  • This persistent biological threat acts as a primary catalyst, compelling healthcare administrators to heavily procure lateral flow immunoassays and rapid immunochromatographic strips to intercept outbreaks immediately upon presentation.
  • By prioritizing proactive nosocomial transmission prevention, medical institutions have successfully lowered cross-contamination rates by 18% and reduced unnecessary isolation room occupancy by 25%. This operational shift occurs because immediate strain identification allows for rapid patient isolation and precise antibiotic administration.
  • Consequently, enhancing diagnostic processing speed directly fortifies institutional control, allowing hospitals to optimize bed turnover rates and minimize prolonged inpatient stays, thereby securing highly predictable and resilient operational continuity.

What are the market trends shaping the Bacterial Disease Diagnostics Industry?

  • The clinical transition toward high-throughput syndromic multiplex testing panels represents a defining market trend. This evolution optimizes diagnostic workflows by enabling the simultaneous identification of multiple pathogens from a single specimen.

  • The clinical paradigm is rapidly shifting toward the integration of multiplexed syndromic panels that simultaneously evaluate multiple pathogen targets from a single patient sample. This technological adoption is driven by the urgent institutional need to compress analytical timelines and eliminate sequential testing delays.
  • By replacing fragmented manual procedures with laboratory automation integration and automated liquid handling systems, high-volume reference laboratories have improved overall testing throughput efficiency by 40%. The resulting effect is a profound transformation of clinical decision workflows, enabling physicians to execute rapid interventions during critical patient admission windows.
  • Additionally, the increasing utilization of miniaturized isothermal amplification devices and host-response protein biomarkers ensures that decentralized clinics achieve laboratory-grade sensitivity at the point of care. These structural innovations drastically reduce diagnostic ambiguity, optimizing resource allocation and preventing the downstream operational bottlenecks typically associated with traditional microbiological cultivation.

What challenges does the Bacterial Disease Diagnostics Industry face during its growth?

  • Substantial capital requirements and prohibitive manufacturing expenses associated with advanced diagnostic instrumentation remain significant structural constraints hindering broader industry adoption.

  • The transition toward highly sophisticated molecular diagnostic infrastructure is severely constrained by substantial capital requirements and ongoing maintenance expenditures. Developing cutting-edge platforms, such as matrix-assisted laser desorption ionization systems, necessitates massive research investments that invariably inflate end-user procurement costs. This financial burden prevents regional clinics from establishing advanced molecular testing environments, ultimately delaying diagnostic modernization.
  • As a direct consequence of budget limitations, rural medical networks frequently experience a 30% reduction in optimal pathogen detection rates compared to well-funded urban centers. Furthermore, integrating these complex instruments into existing frameworks requires extensive staff retraining, increasing hidden labor costs by up to 15%.
  • These formidable financial and infrastructural barriers significantly complicate the universal enforcement of public health mandates and stringent antimicrobial stewardship programs across decentralized medical sectors.

Exclusive Technavio Analysis on Customer Landscape

The bacterial disease diagnostics market forecasting report includes the adoption lifecycle of the market, covering from the innovator’s stage to the laggard’s stage. It focuses on adoption rates in different regions based on penetration. Furthermore, the bacterial disease diagnostics market report also includes key purchase criteria and drivers of price sensitivity to help companies evaluate and develop their market growth analysis strategies.
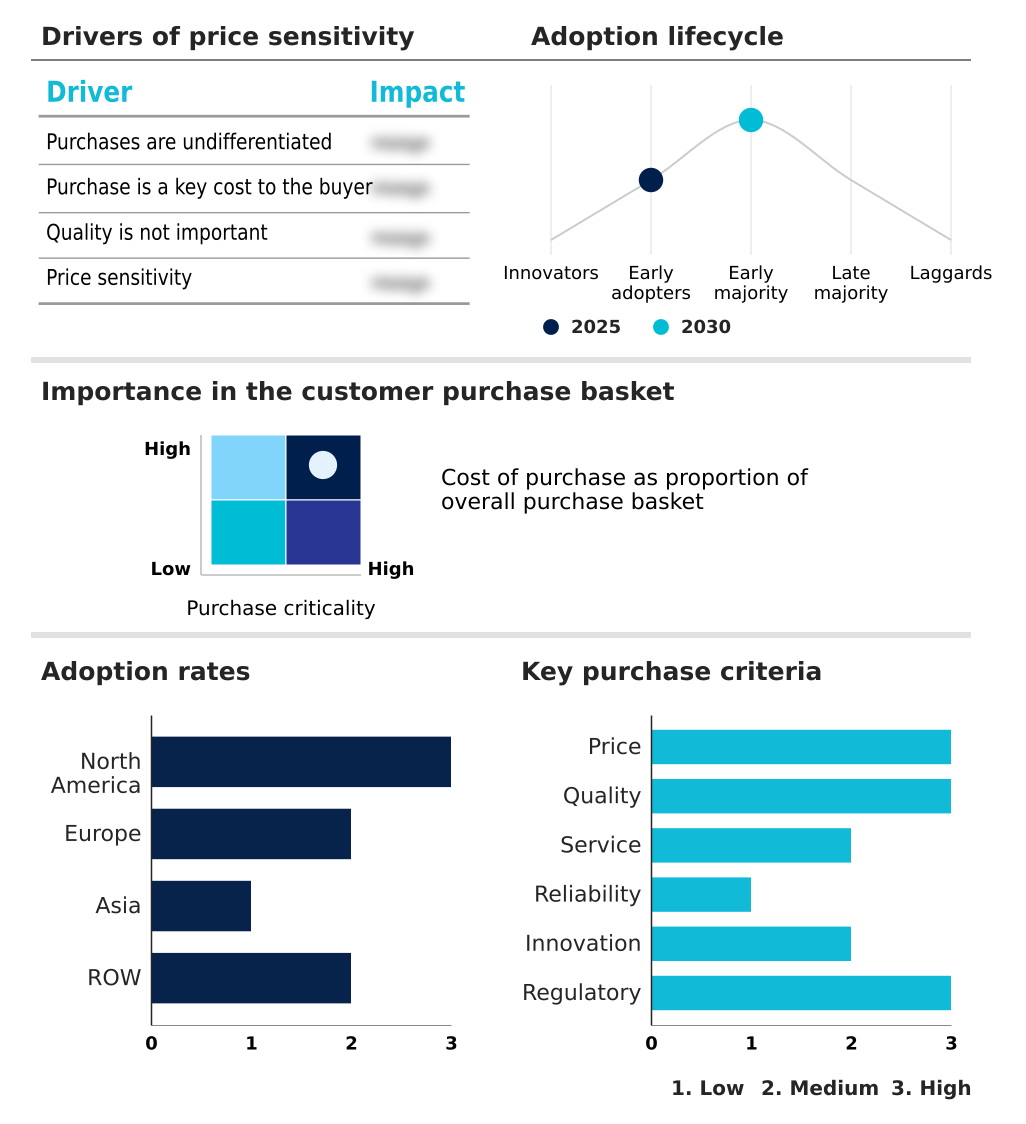
Customer Landscape of Bacterial Disease Diagnostics Industry

Competitive Landscape

Companies are implementing various strategies, such as strategic alliances, bacterial disease diagnostics market forecast, partnerships, mergers and acquisitions, geographical expansion, and product/service launches, to enhance their presence in the industry.

Abbott Laboratories - Offers advanced molecular diagnostic systems and rapid point-of-care assays designed to deliver high-throughput, accurate bacterial pathogen detection, optimizing clinical workflows and improving infectious disease management efficiency.

The industry research and growth report includes detailed analyses of the competitive landscape of the market and information about key companies, including:

  • Abbott Laboratories
  • Beckman Coulter Inc.
  • Becton Dickinson and Co.
  • Bio Rad Laboratories Inc.
  • BioMerieux SA
  • Bruker Corp.
  • Cepheid Inc.
  • DiaSorin SpA
  • F. Hoffmann La Roche Ltd.
  • Genetic Signatures Ltd.
  • Hardy Diagnostics
  • Hologic Inc.
  • Liofilchem Srl
  • Meridian Bioscience Inc.
  • QIAGEN N.V.
  • QuidelOrtho Corp.
  • Seegene Inc.
  • Siemens Healthineers AG
  • Thermo Fisher Scientific Inc.

Qualitative and quantitative analysis of companies has been conducted to help clients understand the wider business environment as well as the strengths and weaknesses of key industry players. Data is qualitatively analyzed to categorize companies as pure play, category-focused, industry-focused, and diversified; it is quantitatively analyzed to categorize companies as dominant, leading, strong, tentative, and weak.

Recent Development and News in Bacterial disease diagnostics market

  • In the Pharmaceuticals industry, the regulatory enforcement of strict antimicrobial stewardship protocols across North America has restricted broad-spectrum antibiotic usage, directly impacting Bacterial Disease Diagnostics demand by accelerating the need for targeted antibiotic therapy verification and achieving a 95% compliance rate in matching specific therapeutic agents to validated pathogen profiles.
  • The rapid integration of centralized data analytics into clinical laboratory workflows has optimized hospital-acquired infection monitoring protocols, directly increasing the utilization of automated testing platforms and elevating diagnostic processing speed by up to 30% in high-volume reference centers.
  • Widespread policy shifts toward proactive nosocomial transmission prevention have mandated the expansion of molecular testing environments within intensive care units, directly pulling demand for localized point-of-care instrumentation to reduce cross-contamination incidents by at least 15%.
  • The transition toward continuous disease prevalence tracking across national epidemiological surveillance networks has reshaped population health management strategies, driving a 40% increase in immunodiagnostic assay adoption to effectively identify community-acquired bacterial threats and expand decentralized screening capabilities.

Dive into Technavio’s robust research methodology, blending expert interviews, extensive data synthesis, and validated models for unparalleled Bacterial Disease Diagnostics Market insights. See full methodology.

Market Scope
Page number 323
Base year 2025
Historic period 2020-2024
Forecast period 2026-2030
Growth momentum & CAGR Accelerate at a CAGR of 6.9%
Market growth 2026-2030 USD 4996.0 million
Market structure Fragmented
YoY growth 2025-2026(%) 6.6%
Key countries US, Canada, Mexico, Germany, UK, France, Italy, Spain, The Netherlands, China, India, Japan, South Korea, Indonesia, Thailand, Brazil, Saudi Arabia, UAE, Turkey, Argentina, Colombia, South Africa and Israel
Competitive landscape Leading Companies, Market Positioning of Companies, Competitive Strategies, and Industry Risks

Request Free Sample

Research Analyst Overview

  • Corporate leadership within medical technology sectors increasingly prioritizes the deployment of hybrid analytical architectures to address the compounding complexities of infectious diseases. The integration of rapid genotypic resistance profiling with advanced phenotypic antimicrobial susceptibility testing has emerged as a crucial boardroom-level strategy, fundamentally altering procurement budgeting and clinical compliance protocols.
  • By leveraging sophisticated chemiluminescence immunoassay platforms driven by innovative recombinant antigen design, clinical laboratory networks have successfully reduced manual handling errors by 28%. This measurable operational outcome significantly accelerates diagnostic delivery while lowering the long-term overhead costs associated with labor-intensive methodologies.
  • Furthermore, the strategic transition from traditional enzyme-linked immunosorbent assay frameworks toward automated systems analyzing ribosomal protein fingerprints ensures unparalleled pathogen specificity. Digital microscopy scanners further optimize these decentralized workflows by standardizing visual analysis and eliminating subjective human interpretation.
  • Ultimately, these structural diagnostic advancements empower healthcare administrators to confidently navigate stringent regulatory mandates, ensuring institutional resource allocation perfectly aligns with the urgent clinical necessity for highly definitive microbial identification.

What are the Key Data Covered in this Bacterial Disease Diagnostics Market Research and Growth Report?

  • What is the expected growth of the Bacterial Disease Diagnostics Market between 2026 and 2030?

    • USD 5.00 billion, at a CAGR of 6.9%

  • What segmentation does the market report cover?

    • The report is segmented by Product (Consumables, and Instruments), End-user (Hospitals, and Labs), Method (Culture and isolation, Microscopy, Molecular diagnostics, Serological testing, and Others), Disease Type (Respiratory infections, Gastrointestinal infections, Genitourinary infections, Skin and soft tissue infections, and Others) and Geography (North America, Europe, Asia, Rest of World (ROW))

  • Which regions are analyzed in the report?

    • North America, Europe, Asia and Rest of World (ROW)

  • What are the key growth drivers and market challenges?

    • Rising incidence of target infectious diseases and global pathogen outbreaks, Substantial capital demands and prohibitive manufacturing costs of advanced diagnostic instrumentation

  • Who are the major players in the Bacterial Disease Diagnostics Market?

    • Abbott Laboratories, Beckman Coulter Inc., Becton Dickinson and Co., Bio Rad Laboratories Inc., BioMerieux SA, Bruker Corp., Cepheid Inc., DiaSorin SpA, F. Hoffmann La Roche Ltd., Genetic Signatures Ltd., Hardy Diagnostics, Hologic Inc., Liofilchem Srl, Meridian Bioscience Inc., QIAGEN N.V., QuidelOrtho Corp., Seegene Inc., Siemens Healthineers AG and Thermo Fisher Scientific Inc.

Market Research Insights

  • The bacterial disease diagnostics market serves as a critical structural component of modern healthcare, driving precision medicine and systemic operational efficiency. Clinical laboratories aggressively prioritize patient triage optimization, successfully lowering emergency department waiting periods by 20% through the integration of rapid assay platforms.
  • By facilitating immediate medical interventions, institutions have documented a 15% improvement in clinical compliance scores, directly mitigating the risks associated with improper prescriptions. Furthermore, incorporating automated systems into routine health screenings has reduced average processing delays by nearly 35%, ensuring uninterrupted infectious disease management workflows.
  • These measurable advancements reinforce the absolute necessity of diagnostic modernization to control healthcare expenditures and elevate institutional reliability without relying on outdated analytical paradigms.

We can help! Our analysts can customize this bacterial disease diagnostics market research report to meet your requirements.

Get in touch

1. Executive Summary

1.1 Market overview

Executive Summary - Chart on Market Overview
Executive Summary - Data Table on Market Overview
Executive Summary - Chart on Global Market Characteristics
Executive Summary - Chart on Market by Geography
Executive Summary - Chart on Market Segmentation by Product
Executive Summary - Chart on Market Segmentation by End-user
Executive Summary - Chart on Market Segmentation by Method
Executive Summary - Chart on Market Segmentation by Disease Type
Executive Summary - Chart on Incremental Growth
Executive Summary - Data Table on Incremental Growth
Executive Summary - Chart on Company Market Positioning

2. Technavio Analysis

2.1 Analysis of price sensitivity, lifecycle, customer purchase basket, adoption rates, and purchase criteria

2.2 Criticality of inputs and Factors of differentiation

Chart on Overview on criticality of inputs and factors of differentiation

2.3 Factors of disruption

Chart on Overview on factors of disruption

2.4 Impact of drivers and challenges

Chart on Impact of drivers and challenges in 2025 and 2030

3. Market Landscape

3.1 Market ecosystem

Chart on Parent Market
Data Table on - Parent Market

3.2 Market characteristics

Chart on Market characteristics analysis

3.3 Value chain analysis

Chart on Value chain analysis

4. Market Sizing

4.1 Market definition

Data Table on Offerings of companies included in the market definition

4.2 Market segment analysis

Market segments

4.3 Market size 2025

4.4 Market outlook: Forecast for 2025-2030

Chart on Global - Market size and forecast 2025-2030 ($ million)
Data Table on Global - Market size and forecast 2025-2030 ($ million)
Chart on Global Market: Year-over-year growth 2025-2030 (%)
Data Table on Global Market: Year-over-year growth 2025-2030 (%)

5. Historic Market Size

5.1 Global Bacterial Disease Diagnostics Market 2020 - 2024

Historic Market Size - Data Table on Global Bacterial Disease Diagnostics Market 2020 - 2024 ($ million)

5.2 Product segment analysis 2020 - 2024

Historic Market Size - Product Segment 2020 - 2024 ($ million)

5.3 End-user segment analysis 2020 - 2024

Historic Market Size - End-user Segment 2020 - 2024 ($ million)

5.4 Method segment analysis 2020 - 2024

Historic Market Size - Method Segment 2020 - 2024 ($ million)

5.5 Disease Type segment analysis 2020 - 2024

Historic Market Size - Disease Type Segment 2020 - 2024 ($ million)

5.6 Geography segment analysis 2020 - 2024

Historic Market Size - Geography Segment 2020 - 2024 ($ million)

5.7 Country segment analysis 2020 - 2024

Historic Market Size - Country Segment 2020 - 2024 ($ million)

6. Qualitative Analysis

6.1 Impact of AI on global bacterial disease diagnostics market

6.2 Impact of geopolitical conflicts on global bacterial disease diagnostics market

7. Five Forces Analysis

7.1 Five forces summary

Five forces analysis - Comparison between 2025 and 2030

7.2 Bargaining power of buyers

Bargaining power of buyers - Impact of key factors 2025 and 2030

7.3 Bargaining power of suppliers

Bargaining power of suppliers - Impact of key factors in 2025 and 2030

7.4 Threat of new entrants

Threat of new entrants - Impact of key factors in 2025 and 2030

7.5 Threat of substitutes

Threat of substitutes - Impact of key factors in 2025 and 2030

7.6 Threat of rivalry

Threat of rivalry - Impact of key factors in 2025 and 2030

7.7 Market condition

Chart on Market condition - Five forces 2025 and 2030

8. Market Segmentation by Product

8.1 Market segments

Chart on Product - Market share 2025-2030 (%)
Data Table on Product - Market share 2025-2030 (%)

8.2 Comparison by Product

Chart on Comparison by Product
Data Table on Comparison by Product

8.3 Consumables - Market size and forecast 2025-2030

Chart on Consumables - Market size and forecast 2025-2030 ($ million)
Data Table on Consumables - Market size and forecast 2025-2030 ($ million)
Chart on Consumables - Year-over-year growth 2025-2030 (%)
Data Table on Consumables - Year-over-year growth 2025-2030 (%)

8.4 Instruments - Market size and forecast 2025-2030

Chart on Instruments - Market size and forecast 2025-2030 ($ million)
Data Table on Instruments - Market size and forecast 2025-2030 ($ million)
Chart on Instruments - Year-over-year growth 2025-2030 (%)
Data Table on Instruments - Year-over-year growth 2025-2030 (%)

8.5 Market opportunity by Product

Market opportunity by Product ($ million)
Data Table on Market opportunity by Product ($ million)

9. Market Segmentation by End-user

9.1 Market segments

Chart on End-user - Market share 2025-2030 (%)
Data Table on End-user - Market share 2025-2030 (%)

9.2 Comparison by End-user

Chart on Comparison by End-user
Data Table on Comparison by End-user

9.3 Hospitals - Market size and forecast 2025-2030

Chart on Hospitals - Market size and forecast 2025-2030 ($ million)
Data Table on Hospitals - Market size and forecast 2025-2030 ($ million)
Chart on Hospitals - Year-over-year growth 2025-2030 (%)
Data Table on Hospitals - Year-over-year growth 2025-2030 (%)

9.4 Labs - Market size and forecast 2025-2030

Chart on Labs - Market size and forecast 2025-2030 ($ million)
Data Table on Labs - Market size and forecast 2025-2030 ($ million)
Chart on Labs - Year-over-year growth 2025-2030 (%)
Data Table on Labs - Year-over-year growth 2025-2030 (%)

9.5 Market opportunity by End-user

Market opportunity by End-user ($ million)
Data Table on Market opportunity by End-user ($ million)

10. Market Segmentation by Method

10.1 Market segments

Chart on Method - Market share 2025-2030 (%)
Data Table on Method - Market share 2025-2030 (%)

10.2 Comparison by Method

Chart on Comparison by Method
Data Table on Comparison by Method

10.3 Culture and isolation - Market size and forecast 2025-2030

Chart on Culture and isolation - Market size and forecast 2025-2030 ($ million)
Data Table on Culture and isolation - Market size and forecast 2025-2030 ($ million)
Chart on Culture and isolation - Year-over-year growth 2025-2030 (%)
Data Table on Culture and isolation - Year-over-year growth 2025-2030 (%)

10.4 Microscopy - Market size and forecast 2025-2030

Chart on Microscopy - Market size and forecast 2025-2030 ($ million)
Data Table on Microscopy - Market size and forecast 2025-2030 ($ million)
Chart on Microscopy - Year-over-year growth 2025-2030 (%)
Data Table on Microscopy - Year-over-year growth 2025-2030 (%)

10.5 Molecular diagnostics - Market size and forecast 2025-2030

Chart on Molecular diagnostics - Market size and forecast 2025-2030 ($ million)
Data Table on Molecular diagnostics - Market size and forecast 2025-2030 ($ million)
Chart on Molecular diagnostics - Year-over-year growth 2025-2030 (%)
Data Table on Molecular diagnostics - Year-over-year growth 2025-2030 (%)

10.6 Serological testing - Market size and forecast 2025-2030

Chart on Serological testing - Market size and forecast 2025-2030 ($ million)
Data Table on Serological testing - Market size and forecast 2025-2030 ($ million)
Chart on Serological testing - Year-over-year growth 2025-2030 (%)
Data Table on Serological testing - Year-over-year growth 2025-2030 (%)

10.7 Others - Market size and forecast 2025-2030

Chart on Others - Market size and forecast 2025-2030 ($ million)
Data Table on Others - Market size and forecast 2025-2030 ($ million)
Chart on Others - Year-over-year growth 2025-2030 (%)
Data Table on Others - Year-over-year growth 2025-2030 (%)

10.8 Market opportunity by Method

Market opportunity by Method ($ million)
Data Table on Market opportunity by Method ($ million)

11. Market Segmentation by Disease Type

11.1 Market segments

Chart on Disease Type - Market share 2025-2030 (%)
Data Table on Disease Type - Market share 2025-2030 (%)

11.2 Comparison by Disease Type

Chart on Comparison by Disease Type
Data Table on Comparison by Disease Type

11.3 Respiratory infections - Market size and forecast 2025-2030

Chart on Respiratory infections - Market size and forecast 2025-2030 ($ million)
Data Table on Respiratory infections - Market size and forecast 2025-2030 ($ million)
Chart on Respiratory infections - Year-over-year growth 2025-2030 (%)
Data Table on Respiratory infections - Year-over-year growth 2025-2030 (%)

11.4 Gastrointestinal infections - Market size and forecast 2025-2030

Chart on Gastrointestinal infections - Market size and forecast 2025-2030 ($ million)
Data Table on Gastrointestinal infections - Market size and forecast 2025-2030 ($ million)
Chart on Gastrointestinal infections - Year-over-year growth 2025-2030 (%)
Data Table on Gastrointestinal infections - Year-over-year growth 2025-2030 (%)

11.5 Genitourinary infections - Market size and forecast 2025-2030

Chart on Genitourinary infections - Market size and forecast 2025-2030 ($ million)
Data Table on Genitourinary infections - Market size and forecast 2025-2030 ($ million)
Chart on Genitourinary infections - Year-over-year growth 2025-2030 (%)
Data Table on Genitourinary infections - Year-over-year growth 2025-2030 (%)

11.6 Skin and soft tissue infections - Market size and forecast 2025-2030

Chart on Skin and soft tissue infections - Market size and forecast 2025-2030 ($ million)
Data Table on Skin and soft tissue infections - Market size and forecast 2025-2030 ($ million)
Chart on Skin and soft tissue infections - Year-over-year growth 2025-2030 (%)
Data Table on Skin and soft tissue infections - Year-over-year growth 2025-2030 (%)

11.7 Others - Market size and forecast 2025-2030

Chart on Others - Market size and forecast 2025-2030 ($ million)
Data Table on Others - Market size and forecast 2025-2030 ($ million)
Chart on Others - Year-over-year growth 2025-2030 (%)
Data Table on Others - Year-over-year growth 2025-2030 (%)

11.8 Market opportunity by Disease Type

Market opportunity by Disease Type ($ million)
Data Table on Market opportunity by Disease Type ($ million)

12. Customer Landscape

12.1 Customer landscape overview

Analysis of price sensitivity, lifecycle, customer purchase basket, adoption rates, and purchase criteria

13. Geographic Landscape

13.1 Geographic segmentation

Chart on Market share by geography 2025-2030 (%)
Data Table on Market share by geography 2025-2030 (%)

13.2 Geographic comparison

Chart on Geographic comparison
Data Table on Geographic comparison

13.3 North America - Market size and forecast 2025-2030

Chart on North America - Market size and forecast 2025-2030 ($ million)
Data Table on North America - Market size and forecast 2025-2030 ($ million)
Chart on North America - Year-over-year growth 2025-2030 (%)
Data Table on North America - Year-over-year growth 2025-2030 (%)
Chart on Regional Comparison - North America
Data Table on Regional Comparison - North America

13.3.1 US - Market size and forecast 2025-2030

Chart on US - Market size and forecast 2025-2030 ($ million)
Data Table on US - Market size and forecast 2025-2030 ($ million)
Chart on US - Year-over-year growth 2025-2030 (%)
Data Table on US - Year-over-year growth 2025-2030 (%)

13.3.2 Canada - Market size and forecast 2025-2030

Chart on Canada - Market size and forecast 2025-2030 ($ million)
Data Table on Canada - Market size and forecast 2025-2030 ($ million)
Chart on Canada - Year-over-year growth 2025-2030 (%)
Data Table on Canada - Year-over-year growth 2025-2030 (%)

13.3.3 Mexico - Market size and forecast 2025-2030

Chart on Mexico - Market size and forecast 2025-2030 ($ million)
Data Table on Mexico - Market size and forecast 2025-2030 ($ million)
Chart on Mexico - Year-over-year growth 2025-2030 (%)
Data Table on Mexico - Year-over-year growth 2025-2030 (%)

13.4 Europe - Market size and forecast 2025-2030

Chart on Europe - Market size and forecast 2025-2030 ($ million)
Data Table on Europe - Market size and forecast 2025-2030 ($ million)
Chart on Europe - Year-over-year growth 2025-2030 (%)
Data Table on Europe - Year-over-year growth 2025-2030 (%)
Chart on Regional Comparison - Europe
Data Table on Regional Comparison - Europe

13.4.1 Germany - Market size and forecast 2025-2030

Chart on Germany - Market size and forecast 2025-2030 ($ million)
Data Table on Germany - Market size and forecast 2025-2030 ($ million)
Chart on Germany - Year-over-year growth 2025-2030 (%)
Data Table on Germany - Year-over-year growth 2025-2030 (%)

13.4.2 UK - Market size and forecast 2025-2030

Chart on UK - Market size and forecast 2025-2030 ($ million)
Data Table on UK - Market size and forecast 2025-2030 ($ million)
Chart on UK - Year-over-year growth 2025-2030 (%)
Data Table on UK - Year-over-year growth 2025-2030 (%)

13.4.3 France - Market size and forecast 2025-2030

Chart on France - Market size and forecast 2025-2030 ($ million)
Data Table on France - Market size and forecast 2025-2030 ($ million)
Chart on France - Year-over-year growth 2025-2030 (%)
Data Table on France - Year-over-year growth 2025-2030 (%)

13.4.4 Italy - Market size and forecast 2025-2030

Chart on Italy - Market size and forecast 2025-2030 ($ million)
Data Table on Italy - Market size and forecast 2025-2030 ($ million)
Chart on Italy - Year-over-year growth 2025-2030 (%)
Data Table on Italy - Year-over-year growth 2025-2030 (%)

13.4.5 Spain - Market size and forecast 2025-2030

Chart on Spain - Market size and forecast 2025-2030 ($ million)
Data Table on Spain - Market size and forecast 2025-2030 ($ million)
Chart on Spain - Year-over-year growth 2025-2030 (%)
Data Table on Spain - Year-over-year growth 2025-2030 (%)

13.4.6 The Netherlands - Market size and forecast 2025-2030

Chart on The Netherlands - Market size and forecast 2025-2030 ($ million)
Data Table on The Netherlands - Market size and forecast 2025-2030 ($ million)
Chart on The Netherlands - Year-over-year growth 2025-2030 (%)
Data Table on The Netherlands - Year-over-year growth 2025-2030 (%)

13.5 Asia - Market size and forecast 2025-2030

Chart on Asia - Market size and forecast 2025-2030 ($ million)
Data Table on Asia - Market size and forecast 2025-2030 ($ million)
Chart on Asia - Year-over-year growth 2025-2030 (%)
Data Table on Asia - Year-over-year growth 2025-2030 (%)
Chart on Regional Comparison - Asia
Data Table on Regional Comparison - Asia

13.5.1 China - Market size and forecast 2025-2030

Chart on China - Market size and forecast 2025-2030 ($ million)
Data Table on China - Market size and forecast 2025-2030 ($ million)
Chart on China - Year-over-year growth 2025-2030 (%)
Data Table on China - Year-over-year growth 2025-2030 (%)

13.5.2 India - Market size and forecast 2025-2030

Chart on India - Market size and forecast 2025-2030 ($ million)
Data Table on India - Market size and forecast 2025-2030 ($ million)
Chart on India - Year-over-year growth 2025-2030 (%)
Data Table on India - Year-over-year growth 2025-2030 (%)

13.5.3 Japan - Market size and forecast 2025-2030

Chart on Japan - Market size and forecast 2025-2030 ($ million)
Data Table on Japan - Market size and forecast 2025-2030 ($ million)
Chart on Japan - Year-over-year growth 2025-2030 (%)
Data Table on Japan - Year-over-year growth 2025-2030 (%)

13.5.4 South Korea - Market size and forecast 2025-2030

Chart on South Korea - Market size and forecast 2025-2030 ($ million)
Data Table on South Korea - Market size and forecast 2025-2030 ($ million)
Chart on South Korea - Year-over-year growth 2025-2030 (%)
Data Table on South Korea - Year-over-year growth 2025-2030 (%)

13.5.5 Indonesia - Market size and forecast 2025-2030

Chart on Indonesia - Market size and forecast 2025-2030 ($ million)
Data Table on Indonesia - Market size and forecast 2025-2030 ($ million)
Chart on Indonesia - Year-over-year growth 2025-2030 (%)
Data Table on Indonesia - Year-over-year growth 2025-2030 (%)

13.5.6 Thailand - Market size and forecast 2025-2030

Chart on Thailand - Market size and forecast 2025-2030 ($ million)
Data Table on Thailand - Market size and forecast 2025-2030 ($ million)
Chart on Thailand - Year-over-year growth 2025-2030 (%)
Data Table on Thailand - Year-over-year growth 2025-2030 (%)

13.6 Rest of World (ROW) - Market size and forecast 2025-2030

Chart on Rest of World (ROW) - Market size and forecast 2025-2030 ($ million)
Data Table on Rest of World (ROW) - Market size and forecast 2025-2030 ($ million)
Chart on Rest of World (ROW) - Year-over-year growth 2025-2030 (%)
Data Table on Rest of World (ROW) - Year-over-year growth 2025-2030 (%)
Chart on Regional Comparison - Rest of World (ROW)
Data Table on Regional Comparison - Rest of World (ROW)

13.6.1 Brazil - Market size and forecast 2025-2030

Chart on Brazil - Market size and forecast 2025-2030 ($ million)
Data Table on Brazil - Market size and forecast 2025-2030 ($ million)
Chart on Brazil - Year-over-year growth 2025-2030 (%)
Data Table on Brazil - Year-over-year growth 2025-2030 (%)

13.6.2 Saudi Arabia - Market size and forecast 2025-2030

Chart on Saudi Arabia - Market size and forecast 2025-2030 ($ million)
Data Table on Saudi Arabia - Market size and forecast 2025-2030 ($ million)
Chart on Saudi Arabia - Year-over-year growth 2025-2030 (%)
Data Table on Saudi Arabia - Year-over-year growth 2025-2030 (%)

13.6.3 UAE - Market size and forecast 2025-2030

Chart on UAE - Market size and forecast 2025-2030 ($ million)
Data Table on UAE - Market size and forecast 2025-2030 ($ million)
Chart on UAE - Year-over-year growth 2025-2030 (%)
Data Table on UAE - Year-over-year growth 2025-2030 (%)

13.6.4 Turkey - Market size and forecast 2025-2030

Chart on Turkey - Market size and forecast 2025-2030 ($ million)
Data Table on Turkey - Market size and forecast 2025-2030 ($ million)
Chart on Turkey - Year-over-year growth 2025-2030 (%)
Data Table on Turkey - Year-over-year growth 2025-2030 (%)

13.6.5 Argentina - Market size and forecast 2025-2030

Chart on Argentina - Market size and forecast 2025-2030 ($ million)
Data Table on Argentina - Market size and forecast 2025-2030 ($ million)
Chart on Argentina - Year-over-year growth 2025-2030 (%)
Data Table on Argentina - Year-over-year growth 2025-2030 (%)

13.6.6 Colombia - Market size and forecast 2025-2030

Chart on Colombia - Market size and forecast 2025-2030 ($ million)
Data Table on Colombia - Market size and forecast 2025-2030 ($ million)
Chart on Colombia - Year-over-year growth 2025-2030 (%)
Data Table on Colombia - Year-over-year growth 2025-2030 (%)

13.6.7 South Africa - Market size and forecast 2025-2030

Chart on South Africa - Market size and forecast 2025-2030 ($ million)
Data Table on South Africa - Market size and forecast 2025-2030 ($ million)
Chart on South Africa - Year-over-year growth 2025-2030 (%)
Data Table on South Africa - Year-over-year growth 2025-2030 (%)

13.6.8 Israel - Market size and forecast 2025-2030

Chart on Israel - Market size and forecast 2025-2030 ($ million)
Data Table on Israel - Market size and forecast 2025-2030 ($ million)
Chart on Israel - Year-over-year growth 2025-2030 (%)
Data Table on Israel - Year-over-year growth 2025-2030 (%)

13.7 Market opportunity by geography

Market opportunity by geography ($ million)
Data Tables on Market opportunity by geography ($ million)

14. Drivers, Challenges, and Opportunity

14.1 Market drivers

Rising incidence of target infectious diseases and global pathogen outbreaks
Accelerated proliferation of antimicrobial resistance and public health mandates
Technological integration of molecular assays and point of care testing innovation

14.2 Market challenges

Substantial capital demands and prohibitive manufacturing costs of advanced diagnostic instrumentation
Critical shortage of skilled laboratory personnel and infrastructure deficiencies
Stringent and protracted regulatory approval pathways across international jurisdictions

14.3 Impact of drivers and challenges

Impact of drivers and challenges in 2025 and 2030

14.4 Market opportunities

Shift towards high-throughput syndromic multiplex testing panels
Expansion of AI and ML in decentralized phenotypic profiling
Accelerated proliferation of microfluidic POC assays and regulatory harmonization

15. Competitive Landscape

15.1 Overview

15.2

Overview on criticality of inputs and factors of differentiation

15.3 Landscape disruption

Overview on factors of disruption

15.4 Industry risks

Impact of key risks on business

16. Competitive Analysis

16.1 Companies profiled

Companies covered

16.2 Company ranking index

16.3 Market positioning of companies

Matrix on companies position and classification

16.4 Abbott Laboratories

Abbott Laboratories - Overview
Abbott Laboratories - Business segments
Abbott Laboratories - Key news
Abbott Laboratories - Key offerings
Abbott Laboratories - Segment focus
SWOT

16.5 Beckman Coulter Inc.

Beckman Coulter Inc. - Overview
Beckman Coulter Inc. - Product / Service
Beckman Coulter Inc. - Key offerings
SWOT

16.6 Becton Dickinson and Co.

Becton Dickinson and Co. - Overview
Becton Dickinson and Co. - Business segments
Becton Dickinson and Co. - Key offerings
Becton Dickinson and Co. - Segment focus
SWOT

16.7 Bio Rad Laboratories Inc.

Bio Rad Laboratories Inc. - Overview
Bio Rad Laboratories Inc. - Business segments
Bio Rad Laboratories Inc. - Key news
Bio Rad Laboratories Inc. - Key offerings
Bio Rad Laboratories Inc. - Segment focus
SWOT

16.8 BioMerieux SA

BioMerieux SA - Overview
BioMerieux SA - Business segments
BioMerieux SA - Key offerings
BioMerieux SA - Segment focus
SWOT

16.9 Bruker Corp.

Bruker Corp. - Overview
Bruker Corp. - Business segments
Bruker Corp. - Key offerings
Bruker Corp. - Segment focus
SWOT

16.10 Cepheid Inc.

Cepheid Inc. - Overview
Cepheid Inc. - Product / Service
Cepheid Inc. - Key offerings
SWOT

16.11 DiaSorin SpA

DiaSorin SpA - Overview
DiaSorin SpA - Business segments
DiaSorin SpA - Key offerings
DiaSorin SpA - Segment focus
SWOT

16.12 F. Hoffmann La Roche Ltd.

F. Hoffmann La Roche Ltd. - Overview
F. Hoffmann La Roche Ltd. - Business segments
F. Hoffmann La Roche Ltd. - Key news
F. Hoffmann La Roche Ltd. - Key offerings
F. Hoffmann La Roche Ltd. - Segment focus
SWOT

16.13 Hologic Inc.

Hologic Inc. - Overview
Hologic Inc. - Product / Service
Hologic Inc. - Key offerings
SWOT

16.14 QIAGEN N.V.

QIAGEN N.V. - Overview
QIAGEN N.V. - Product / Service
QIAGEN N.V. - Key offerings
SWOT

16.15 QuidelOrtho Corp.

QuidelOrtho Corp. - Overview
QuidelOrtho Corp. - Business segments
QuidelOrtho Corp. - Key offerings
QuidelOrtho Corp. - Segment focus
SWOT

16.16 Seegene Inc.

Seegene Inc. - Overview
Seegene Inc. - Product / Service
Seegene Inc. - Key offerings
SWOT

16.17 Siemens Healthineers AG

Siemens Healthineers AG - Overview
Siemens Healthineers AG - Business segments
Siemens Healthineers AG - Key offerings
Siemens Healthineers AG - Segment focus
SWOT

16.18 Thermo Fisher Scientific Inc.

Thermo Fisher Scientific Inc. - Overview
Thermo Fisher Scientific Inc. - Business segments
Thermo Fisher Scientific Inc. - Key news
Thermo Fisher Scientific Inc. - Key offerings
Thermo Fisher Scientific Inc. - Segment focus
SWOT

17. Appendix

17.1 Scope of the report

Market definition
Objectives
Notes and caveats

17.2 Inclusions and exclusions checklist

Inclusions checklist
Exclusions checklist

17.3 Currency conversion rates for US$

17.4 Research methodology

17.5 Data procurement

Information sources

17.6 Data validation

17.7 Validation techniques employed for market sizing

17.8 Data synthesis

17.9 360 degree market analysis

17.10 List of abbreviations

Research Methodology

Technavio presents a detailed picture of the market by way of study, synthesis, and summation of data from multiple sources. The analysts have presented the various facets of the market with a particular focus on identifying the key industry influencers. The data thus presented is comprehensive, reliable, and the result of extensive research, both primary and secondary.

INFORMATION SOURCES

Primary sources

  • Manufacturers and suppliers
  • Channel partners
  • Industry experts
  • Strategic decision makers

Secondary sources

  • Industry journals and periodicals
  • Government data
  • Financial reports of key industry players
  • Historical data
  • Press releases

DATA ANALYSIS

Data Synthesis

  • Collation of data
  • Estimation of key figures
  • Analysis of derived insights

Data Validation

  • Triangulation with data models
  • Reference against proprietary databases
  • Corroboration with industry experts

REPORT WRITING

Qualitative

  • Market drivers
  • Market challenges
  • Market trends
  • Five forces analysis

Quantitative

  • Market size and forecast
  • Market segmentation
  • Geographical insights
  • Competitive landscape

Interested in this report?

Get your sample now to see our research methodology and insights!

Download Now

Frequently Asked Questions

Bacterial Disease Diagnostics market growth will increase by USD 4996.0 million during 2026-2030.

The Bacterial Disease Diagnostics market is expected to grow at a CAGR of 6.9% during 2026-2030.

Bacterial Disease Diagnostics market is segmented by Product (Consumables, Instruments) End-user (Hospitals, Labs) Method (Culture and isolation, Microscopy, Molecular diagnostics, Serological testing, Others) Disease type (Respiratory infections, Gastrointestinal infections, Genitourinary infections, Skin and soft tissue infections, Others)

Abbott Laboratories, Beckman Coulter Inc., Becton Dickinson and Co., Bio Rad Laboratories Inc., BioMerieux SA, Bruker Corp., Cepheid Inc., DiaSorin SpA, F. Hoffmann La Roche Ltd., Genetic Signatures Ltd., Hardy Diagnostics, Hologic Inc., Liofilchem Srl, Meridian Bioscience Inc., QIAGEN N.V., QuidelOrtho Corp., Seegene Inc., Siemens Healthineers AG, Thermo Fisher Scientific Inc. are a few of the key vendors in the Bacterial Disease Diagnostics market.

North America will register the highest growth rate of 54.9% among the other regions. Therefore, the Bacterial Disease Diagnostics market in North America is expected to garner significant business opportunities for the vendors during the forecast period.

US, Canada, Mexico, Germany, UK, France, Italy, Spain, The Netherlands, China, India, Japan, South Korea, Indonesia, Thailand, Brazil, Saudi Arabia, UAE, Turkey, Argentina, Colombia, South Africa, Israel

  • Rising incidence of target infectious diseases and global pathogen outbreaks is the driving factor this market.

The Bacterial Disease Diagnostics market vendors should focus on grabbing business opportunities from the Product segment as it accounted for the largest market share in the base year.
RIA - Research AI Assistant
Ask RIA
