Bamboo Plate Market Size 2025-2029
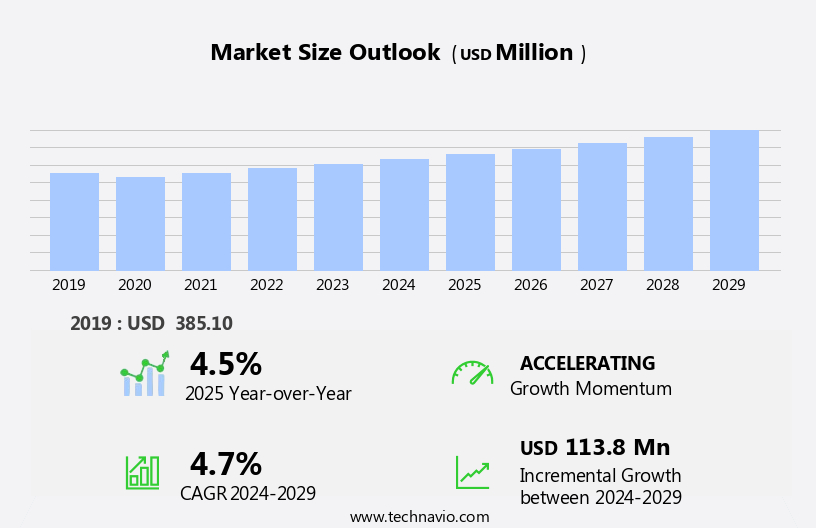
The bamboo plate market size is forecast to increase by USD 113.8 million, at a CAGR of 4.7% between 2024 and 2029.
- The market is experiencing significant growth, driven by the increasing adoption of bamboo plates for online food catering. This trend is fueled by the growing prominence of online shopping and the desire for eco-friendly and sustainable alternatives to traditional plastic or disposable plates. In the food industry, edible bamboo shoots are a rich source of amino acids, proteins, vitamins, and minerals. However, this market faces challenges related to distribution. The unique nature of bamboo plates, which are natural and biodegradable, presents logistical difficulties in transportation and storage. Companies must navigate these challenges to effectively capitalize on the market's potential and meet the rising demand for sustainable dining solutions.
- To succeed, businesses must focus on implementing robust supply chain strategies and collaborating with logistics partners to ensure the timely and efficient delivery of bamboo plates to consumers. By addressing these challenges, market participants can capitalize on the opportunities presented by the increasing trend towards online food catering and the growing consumer preference for eco-friendly alternatives. The market continues to evolve, driven by the increasing demand for natural and sustainable alternatives in the food packaging industry.
What will be the Size of the Bamboo Plate Market during the forecast period?
Explore in-depth regional segment analysis with market size data - historical 2019-2023 and forecasts 2025-2029 - in the full report.
Request Free Sample
- In the market, packaging efficiency and fiber technology are key trends driving innovation. Brands are prioritizing fair trade practices and ethical production to enhance their image and appeal to socially responsible consumers. Supply chain sustainability is a critical concern, with circular economy solutions gaining traction to minimize waste and reduce carbon footprints. Influencer marketing and digital marketing strategies are increasingly used to reach consumers, while social media platforms provide opportunities for social responsibility marketing and carbon offsetting initiatives. Renewable polymers and plant-based plastics are emerging as viable alternatives to traditional materials, aligning with the circular economy and reducing reliance on fossil fuels.
- Material engineering advances have led to the development of green certifications, such as compostability standards, ensuring sustainable sourcing and product lifecycle management. Sustainable forestry practices and responsible production methods are essential for maintaining consumer perception and trust. Brands are embracing sustainable packaging design, incorporating life cycle assessment and food waste reduction strategies to minimize environmental impact. Polylactic acid and other biodegradable materials are gaining popularity due to their eco-friendliness and compatibility with the circular economy. Content marketing and search engine optimization are essential tools for brands to engage consumers and promote their sustainable initiatives, while material engineering advancements continue to shape the future of the market.
How is this Bamboo Plate Industry segmented?
The bamboo plate industry research report provides comprehensive data (region-wise segment analysis), with forecasts and estimates in "USD million" for the period 2025-2029, as well as historical data from 2019-2023 for the following segments.
- Product
- Disposable
- Reusable
- End-user
- Households
- Restaurants and cafes
- Catering services
- Institutional buyers
- Distribution Channel
- Offline
- Online
- Geography
- North America
- US
- Europe
- Germany
- APAC
- China
- India
- Indonesia
- Japan
- South Korea
- Vietnam
- South America
- Argentina
- Brazil
- Rest of World (ROW)
- North America
By Product Insights
The disposable segment is estimated to witness significant growth during the forecast period. The disposable segment in the market is experiencing notable growth in revenue compared to the reusable segment, driven by increasing consumer consciousness towards sustainability. Bamboo disposable plates, derived from bamboo pulp and fiber, are more durable, recyclable, and eco-friendly alternatives to traditional disposable plates made from non-renewable resources. These plates are gaining popularity in various sectors, including residential and commercial, for their convenience in saving time on cleaning and drying utensils. Bamboo plates are heat resistant and microwave safe, making them suitable for diverse food applications. They are also free from chemicals such as BPA and toxins, ensuring food safety and health consciousness.
The supply chain for bamboo plates involves a manufacturing process that prioritizes sustainability initiatives, contributing to the circular economy. The food industry's shift towards bio-based materials and alternative packaging solutions offers a competitive advantage for bamboo plate manufacturers. Consumers are increasingly seeking eco-friendly options, leading to a growing demand for disposable bamboo plates in various food trends and dining experiences. Retail channels and food service providers are recognizing the value proposition of bamboo plates, which aligns with their corporate social responsibility goals and customer loyalty programs. The distribution network for bamboo plates is expanding, ensuring their availability in various retail outlets and online platforms.
Bamboo plates' environmental impact is significantly lower than traditional disposable plates, as bamboo is a renewable resource with a smaller carbon footprint. The manufacturing process for bamboo plates also prioritizes waste reduction and material science innovations. Price sensitivity and production costs are key considerations for manufacturers in the market. However, the long-term benefits of using bamboo plates, such as their eco-friendliness and consumer appeal, outweigh the initial investment.
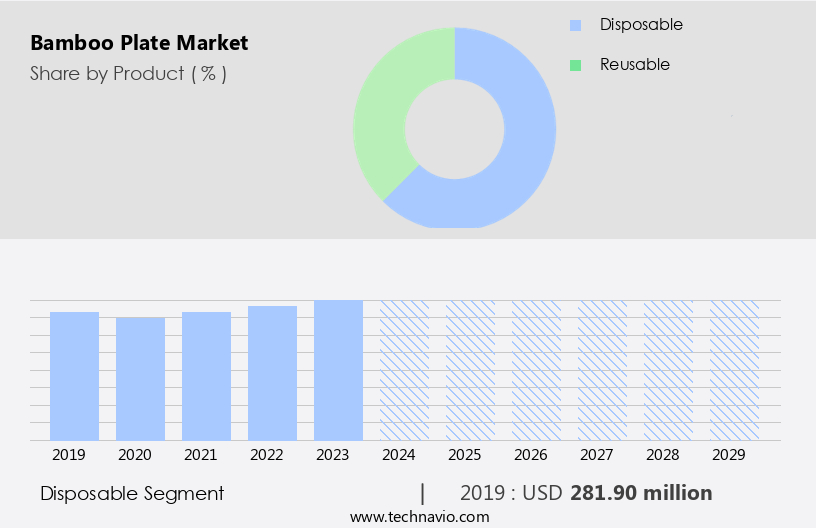
The Disposable segment was valued at USD 281.90 million in 2019 and showed a gradual increase during the forecast period.
Regional Analysis
APAC is estimated to contribute 71% to the growth of the global market during the forecast period. Technavio's analysts have elaborately explained the regional trends and drivers that shape the market during the forecast period.
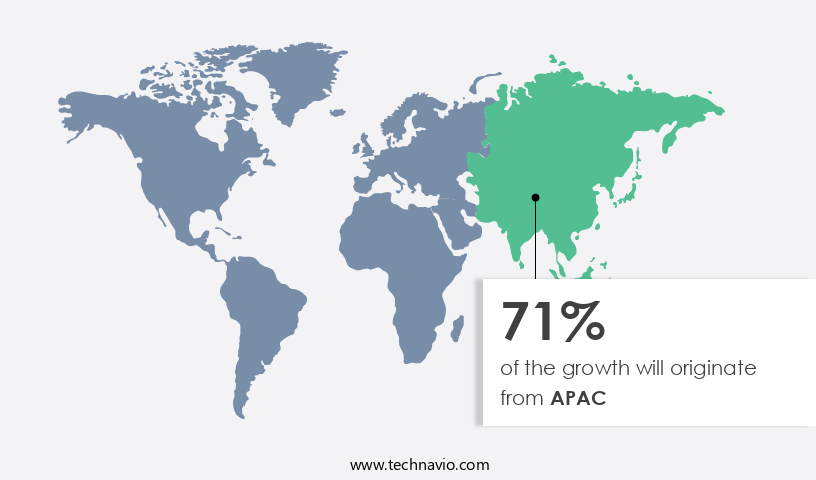
The market is experiencing significant growth due to the increasing preference for natural and eco-friendly packaging solutions. Bamboo pulp and fiber, derived from renewable resources, are key components of this market. The use of bamboo plates offers several advantages, including being heat resistant, microwave safe, chemical free, and BPA free. These plates have gained popularity among consumers who prioritize health consciousness and are increasingly conscious of their carbon footprint. The Asia Pacific region, particularly China, India, and Japan, dominates the market. This trend is driven by the growing demand for sustainable and eco-friendly alternatives to traditional plastic plates. Indian companies, such as Red Buttler and Mann Bamboo Fiber Ware Co., Ltd., are major contributors to this market.
Bamboo plates are not only popular in residential sectors but are also extensively used in commercial places like hotels, food centers, airports, and restaurants. Many restaurants in India have adopted the use of bamboo plates as part of their sustainability initiatives, aligning with evolving food trends and consumer behavior. The manufacturing process of bamboo plates involves minimal use of chemicals and has a smaller carbon footprint compared to traditional plastic plate manufacturing. This, coupled with the circular economy principles of reusing and recycling bamboo plates, makes them an attractive alternative for businesses seeking to reduce waste and enhance their corporate social responsibility. Bamboo plates offer a competitive advantage for businesses looking to differentiate their product offerings and cater to the growing demand for eco-friendly packaging solutions. Despite the slightly higher production cost compared to plastic plates, the value proposition for businesses lies in the long-term benefits of sustainability and customer loyalty.
Market Dynamics
Our researchers analyzed the data with 2024 as the base year, along with the key drivers, trends, and challenges. A holistic analysis of drivers will help companies refine their marketing strategies to gain a competitive advantage.
What are the Bamboo Plate market drivers leading to the rise in the adoption of Industry?
- The significant rise in the utilization of bamboo plates for online food catering services is the primary market driver. Bamboo plates have gained popularity in the packaging industry due to their usage in meal delivery services. These plates are made from natural materials, such as bamboo pulp and fiber, making them eco-friendly and renewable resources. The use of bamboo plates provides several benefits, including a reduced carbon footprint and premium delivery services. They are more durable than paper plates and have heat-resistant bases, which absorb excess moisture and prevent spills. Many food delivery services and agencies have adopted the use of bamboo plates to differentiate their product offerings and provide a more sustainable packaging solution. The bio-based materials of bamboo plates align with consumer preferences for eco-friendly and sustainable products.
- The Food and Drug Administration (FDA) has approved the use of bamboo fiber in food contact applications, further increasing the acceptance of bamboo plates in the market. The shift towards sustainable packaging solutions is a growing trend in the food industry, and the use of bamboo plates is a step towards reducing the environmental impact of meal delivery services. The durability and heat resistance of bamboo plates make them a cost-effective and practical solution for food delivery services, while also providing a premium delivery experience for consumers.
What are the Bamboo Plate market trends shaping the Industry?
- The increasing prevalence of online shopping represents a significant market trend. This shift towards e-commerce is mandatory for businesses seeking to remain competitive in today's digital economy. The market has experienced significant growth in recent years, driven by increasing consumer preference for eco-friendly and sustainable alternatives to traditional plastic or ceramic tableware. Bamboo plates are microwave safe, chemical free, and align with current food trends favoring BPA-free and natural packaging. The market's growth can be attributed to the expanding online distribution channel, enabling consumers to access a wide range of bamboo plate options from various global brands. E-commerce platforms, such as Amazon and eBay, are major retailers of bamboo plates, offering convenience and competitive pricing.
- Manufacturers are focusing on sustainability initiatives in their supply chain and manufacturing processes to meet the growing demand for eco-friendly products. As consumers continue to prioritize health and environmental concerns in their purchasing decisions, the market is poised for continued growth.
How does Bamboo Plate market face challenges during its growth?
- The growth of the industry faces significant challenges due to distribution complexities specific to bamboo plates. Bamboo plates have gained popularity among health-conscious consumers due to their eco-friendly and food-grade properties. However, for manufacturers supplying bamboo plates to retail channels, there are challenges that need to be addressed. Retail stores, including supermarkets, hypermarkets, and large chains of discount or convenience stores, are significant distribution modes. Yet, manufacturers face pressure to maintain competitive prices and margins, as retailers operate on lower profit margins. Retailers also demand frequent and smaller product deliveries to minimize warehousing costs. In the event of a supply shortage from a particular manufacturer, retailers may seek alternatives, emphasizing the importance of customer loyalty and consistent supply.
- Furthermore, corporate social responsibility and waste reduction are essential considerations for conscious consumers. Bamboo plates, being oven-safe and reusable, align with these values, making them an attractive value proposition for retailers and consumers alike.
Exclusive Customer Landscape
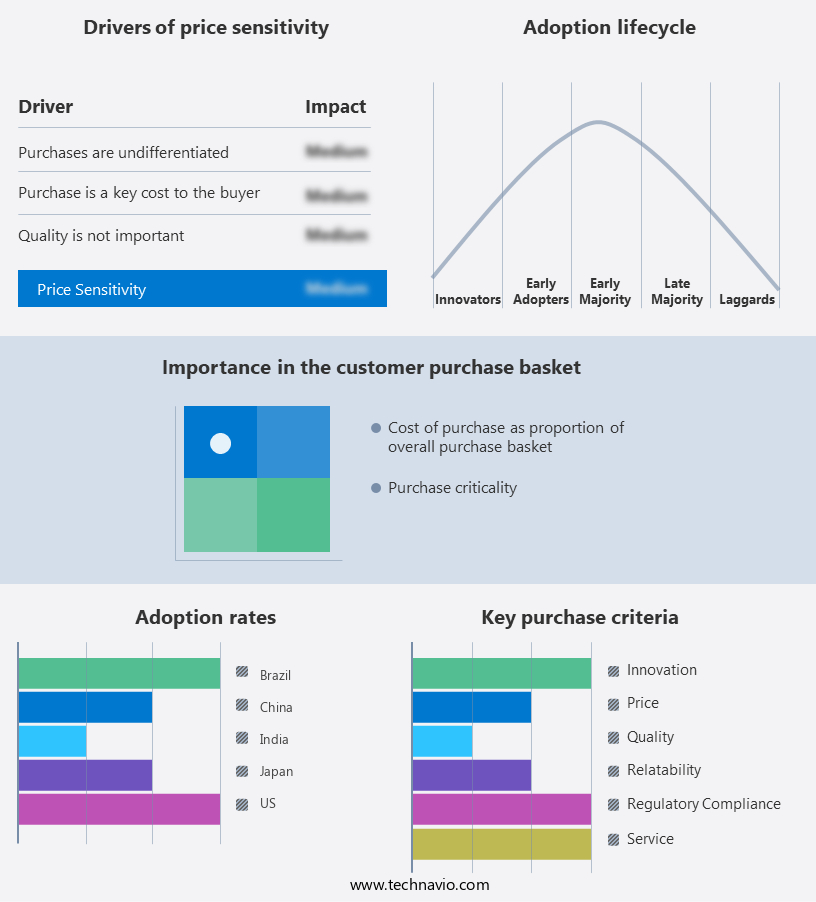
The bamboo plate market forecasting report includes the adoption lifecycle of the market, covering from the innovator's stage to the laggard's stage. It focuses on adoption rates in different regions based on penetration. Furthermore, the bamboo plate market report also includes key purchase criteria and drivers of price sensitivity to help companies evaluate and develop their market growth analysis strategies.
Customer Landscape
Key Companies & Market Insights
Companies are implementing various strategies, such as strategic alliances, bamboo plate market forecast, partnerships, mergers and acquisitions, geographical expansion, and product/service launches, to enhance their presence in the industry.
Anhui Bochen Eco Co. - This company specializes in sustainable tableware solutions, featuring eco-friendly bamboo fiber divided plates infused with rice husk.
The industry research and growth report includes detailed analyses of the competitive landscape of the market and information about key companies, including:
- Anhui Bochen Eco Co.
- Audenza Ltd.
- Bamboo Bamboo
- bambu LLC
- Brand Stock Box Ltd
- Earths Dreams SRL
- Eatwell UK
- Eco-Products Inc.
- Get Fresh
- Guadua Bamboo
- Lekoch
- Little Cherry
- Mann Bamboo Fiber Ware Co. Ltd
- Morgiana
- PacknWood
- Pefso Co. Ltd
- Red Butler
- The Mane Lion
- Tulipop
- Xiamen Ebei Import and Export Co. Ltd
Qualitative and quantitative analysis of companies has been conducted to help clients understand the wider business environment as well as the strengths and weaknesses of key industry players. Data is qualitatively analyzed to categorize companies as pure play, category-focused, industry-focused, and diversified; it is quantitatively analyzed to categorize companies as dominant, leading, strong, tentative, and weak.
Recent Development and News in Bamboo Plate Market
- In February 2023, Sustana Group, a leading producer of bamboo fiber and pulp, announced the launch of its new line of disposable bamboo plates, marking a significant entry into the market (Sustana Group Press Release, 2023). This development underscores the growing demand for eco-friendly alternatives to traditional plastic plates.
- In April 2024, Danish furniture giant IKEA partnered with Swedish biotech company Innventia to develop and commercialize innovative bamboo fiber composites for use in various applications, including plates and cutlery (IKEA Press Release, 2024). This collaboration represents a strategic move to expand IKEA's product offerings in the sustainable tableware segment.
- In October 2024, Verge Products, a California-based manufacturer of eco-friendly disposables, secured a USD 10 million Series A funding round led by S2G Ventures to scale its production of bamboo plates and other sustainable tableware (Verge Products Press Release, 2024). This investment highlights the growing investor interest in the market and the potential for significant growth.
- In March 2025, the European Union's Single Use Plastics Directive came into effect, banning single-use plastic plates and cutlery from being sold within the EU market (European Commission, 2021). This regulatory development is expected to drive demand for sustainable alternatives, such as bamboo plates, in Europe.
Research Analyst Overview
Bamboo, a renewable resource, offers a viable solution with its unique properties, such as being microwave safe, chemical free, and BPA free. The continuous unfolding of market dynamics is influenced by various factors, including consumer behavior and food trends. Bamboo pulp and fiber are gaining popularity as bio-based materials in the production of plates, which are heat resistant and oven safe. The FDA's approval of bamboo-derived products as food grade further strengthens their position in the market.
The manufacturing process of bamboo plates involves the use of sustainable initiatives, ensuring a reduced carbon footprint and alignment with the circular economy. The competitive advantage of bamboo plates lies in their ability to cater to the health consciousness of consumers, who are increasingly seeking toxin-free and eco-friendly alternatives. The value proposition of bamboo plates is further enhanced by their price sensitivity and production cost, making them an attractive option for retail channels and food service providers. The distribution network for bamboo plates is expanding, with companies focusing on waste reduction and corporate social responsibility as key differentiators.
The packaging design of bamboo plates is also evolving, with innovative material science and product innovation driving new applications and uses. In the food service industry, the use of bamboo plates is becoming a norm, as they offer a more sustainable and eco-friendly alternative to traditional plastic or Styrofoam plates. The retail sector is also embracing bamboo plates, as they align with the growing trend towards conscious consumerism and environmental impact reduction. The ongoing evolution of the market is shaped by the interplay of various factors, including consumer behavior, food trends, manufacturing processes, and supply chain dynamics.
The market's continuous unfolding is a testament to the adaptability and resilience of the industry, as it responds to the changing needs and preferences of consumers and businesses alike.
Dive into Technavio's strong research methodology, blending expert interviews, extensive data synthesis, and validated models for unparalleled Bamboo Plate Market insights. See full methodology.
|
Market Scope |
|
|
Report Coverage |
Details |
|
Page number |
202 |
|
Base year |
2024 |
|
Historic period |
2019-2023 |
|
Forecast period |
2025-2029 |
|
Growth momentum & CAGR |
Accelerate at a CAGR of 4.7% |
|
Market growth 2025-2029 |
USD 113.8 million |
|
Market structure |
Fragmented |
|
YoY growth 2024-2025(%) |
4.5 |
|
Key countries |
China, India, Indonesia, Japan, US, Vietnam, South Korea, Germany, Argentina, and Brazil |
|
Competitive landscape |
Leading Companies, Market Positioning of Companies, Competitive Strategies, and Industry Risks |
What are the Key Data Covered in this Bamboo Plate Market Research and Growth Report?
- CAGR of the Bamboo Plate industry during the forecast period
- Detailed information on factors that will drive the growth and forecasting between 2025 and 2029
- Precise estimation of the size of the market and its contribution of the industry in focus to the parent market
- Accurate predictions about upcoming growth and trends and changes in consumer behaviour
- Growth of the market across APAC, South America, North America, Europe, and Middle East and Africa
- Thorough analysis of the market's competitive landscape and detailed information about companies
- Comprehensive analysis of factors that will challenge the bamboo plate market growth of industry companies
We can help! Our analysts can customize this bamboo plate market research report to meet your requirements.
 RIA -
RIA - 
