Baobab Powder Market Analysis, Size, and Forecast 2025-2029: North America (US, Canada, and Mexico), Europe (Germany, UK, and France), APAC (China, India, and Japan), South America (Brazil and Argentina), Middle East and Africa (Saudi Arabia, UAE, and South Africa), and Rest of World (ROW)

Baobab Powder Market Analysis, Size, and Forecast 2025-2029:
North America (US, Canada, and Mexico), Europe (Germany, UK, and France), APAC (China, India, and Japan), South America (Brazil and Argentina), Middle East and Africa (Saudi Arabia, UAE, and South Africa), and Rest of World (ROW)

Published: Dec 2025 290 Pages SKU: IRTNTR73622

Market Overview at a Glance

$9.55 Mn
Market Opportunity
6.4%
CAGR 2024 - 2029
37.8%
North America Growth
$11.33 Mn
Food segment 2023

Baobab Powder Market Size 2025-2029

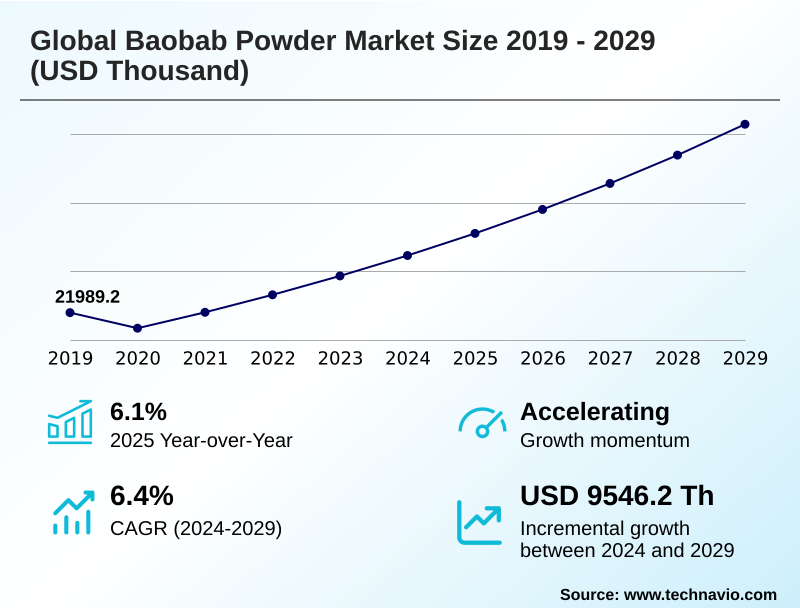
The baobab powder market size is valued to increase by USD 9.55 million, at a CAGR of 6.4% from 2024 to 2029. High health benefits of baobab powder will drive the baobab powder market.

Major Market Trends & Insights

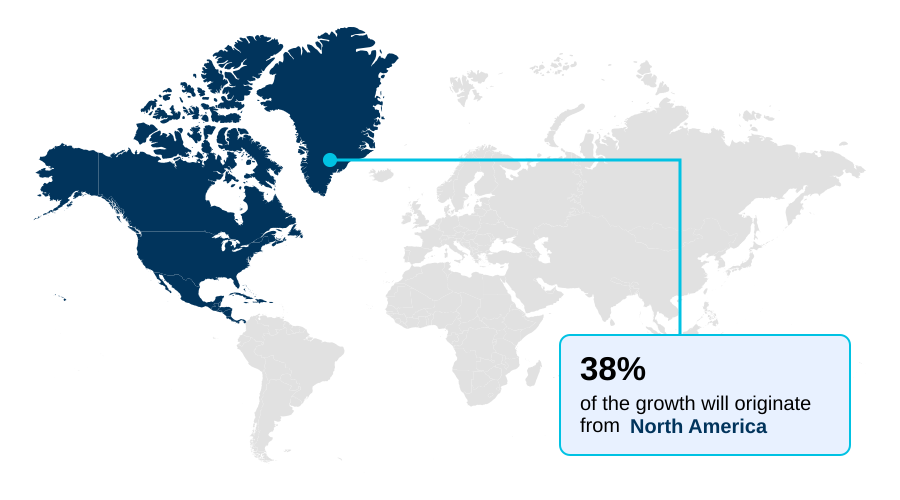
  • North America dominated the market and accounted for a 37.8% growth during the forecast period.
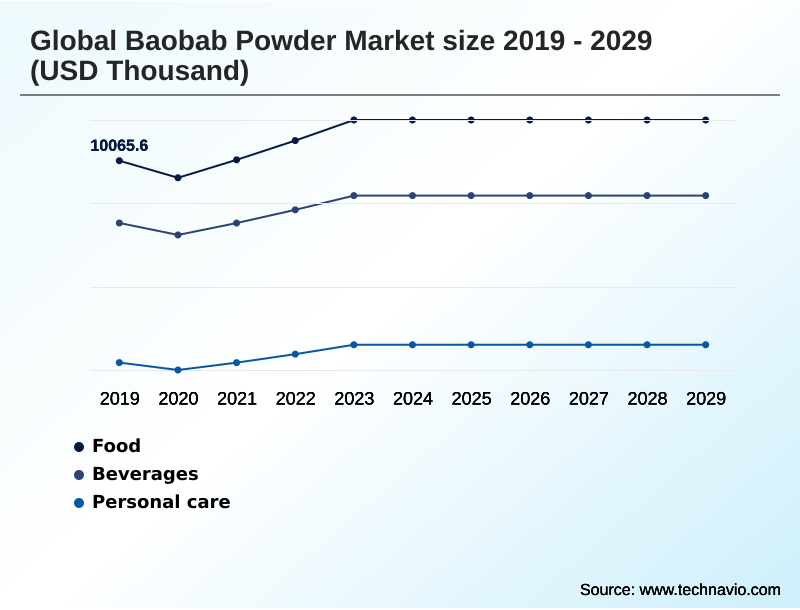
  • By Application - Food segment was valued at USD 11.33 million in 2023
  • By Product Type - Conventional baobab powder segment accounted for the largest market revenue share in 2023

Market Size & Forecast

  • Market Opportunities:
  • Market Future Opportunities: USD 9.55 million
  • CAGR from 2024 to 2029 : 6.4%

Market Summary

  • The Baobab Powder Market is defined by its core offering of a nutrient-rich ingredient prized for its high vitamin C content, antioxidant properties, and prebiotic dietary fiber. Growth is primarily driven by rising consumer awareness of superfoods and a demand for clean-label, plant-based nutrition.
  • Key trends include the expansion of e-commerce platforms, which enhances product accessibility, and the growing popularity of baobab in dietary supplement formulations. However, the market faces challenges from a reliance on concentrated harvesting regions, making the post-harvest supply chain vulnerable to disruption.
  • For instance, a business seeking to ensure product consistency must invest in track-and-trace solutions and diverse sourcing strategies to mitigate risks associated with a single-origin ingredient.
  • The market's trajectory is also shaped by the need for regulatory compliance and the constant innovation in food and beverage applications, from smoothie mixes to functional beverages, to maintain consumer interest against a backdrop of numerous available superfood alternatives.

What will be the Size of the Baobab Powder Market during the forecast period?

Get Key Insights on Market Forecast (PDF) Request Free Sample

How is the Baobab Powder Market Segmented?

The baobab powder industry research report provides comprehensive data (region-wise segment analysis), with forecasts and estimates in "USD thousand" for the period 2025-2029, as well as historical data from 2019-2023 for the following segments.

  • Application
    • Food
    • Beverages
    • Personal care
  • Product type
    • Conventional baobab powder
    • Organic baobab powder
  • Distribution channel
    • Supermarkets
    • Health food stores
    • Speciality stores
    • Online retail
  • Geography
    • North America
      • US
      • Canada
      • Mexico
    • Europe
      • Germany
      • UK
      • France
    • APAC
      • China
      • India
      • Japan
    • South America
      • Brazil
      • Argentina
    • Middle East and Africa
      • Saudi Arabia
      • UAE
      • South Africa
    • Rest of World (ROW)

By Application Insights

The food segment is estimated to witness significant growth during the forecast period.

The baobab powder market is segmented by its use in food and beverage applications, where it serves as a functional food ingredient and a nutrient-rich ingredient in products ranging from energy and cereal bars to smoothie mixes.

Both conventional baobab powder and its organic counterpart are leveraged for their culinary ingredient versatility and exotic citrus flavor. Its adoption in clean-label formulation is driven by its properties as a raw food ingredient and natural food preservative.

The composition, featuring 50% gluten-free dietary fiber, makes it a valuable plant-based protein source in gourmet food applications and for creating minimally processed food ingredients that meet consumer demand for healthier options.

Request Free Sample

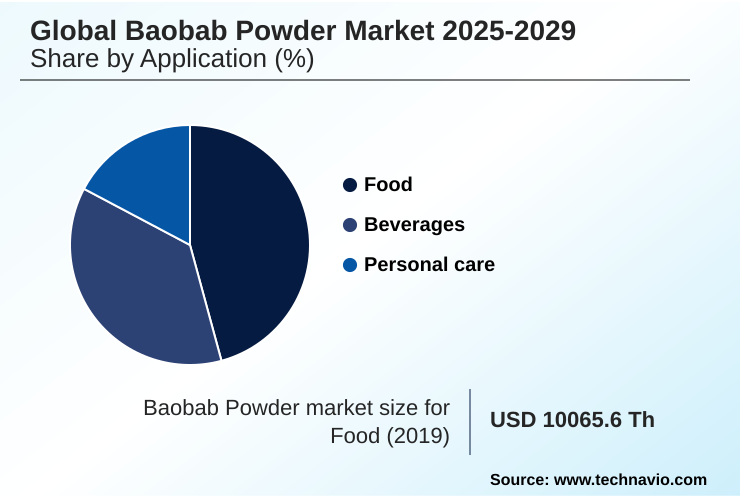
The Food segment was valued at USD 11.33 million in 2023 and showed a gradual increase during the forecast period.

Request Free Sample

Regional Analysis

North America is estimated to contribute 37.8% to the growth of the global market during the forecast period.Technavio’s analysts have elaborately explained the regional trends and drivers that shape the market during the forecast period.

See How Baobab Powder Market Demand is Rising in North America Request Free Sample

The geographic landscape of the baobab powder market is characterized by distinct regional dynamics.

North America is a major growth contributor, expected to account for 37% of market expansion, driven by high consumer awareness and a robust health and wellness sector.

The region's demand for functional beverage formulation, bodybuilding supplements, and meal replacement products is significant. Europe remains a mature market, where products with USDA organic certification and FairWild certification command a premium.

Compliance with EU food supplement legislation and Novel Food Regulation 2015/2283 is non-negotiable for market access.

Meanwhile, APAC is the fastest-growing region, with a projected expansion rate of 7.2%, fueled by rising incomes and a growing interest in novel food ingredient status items.

Gaining Generally Recognized as Safe (GRAS) status and non-GMO project verified credentials are key for penetrating these diverse markets.

Market Dynamics

Our researchers analyzed the data with 2024 as the base year, along with the key drivers, trends, and challenges. A holistic analysis of drivers will help companies refine their marketing strategies to gain a competitive advantage.

  • Strategic positioning in the market increasingly focuses on specific use cases, from promoting baobab powder for digestive health to highlighting baobab powder vitamin c benefits. Consumers are actively searching for information on using baobab powder in baking and as a prebiotic, indicating a shift from general wellness to targeted functional applications.
  • As a result, brands are emphasizing clean label baobab powder sourcing and its role in functional beverages. The narrative around ethical sourcing of baobab powder is a key differentiator, particularly when making a baobab powder versus other superfoods comparison. Marketing efforts are highlighting its utility for skin radiance, in vegan recipes, and for its non-gmo baobab supplement benefits.
  • Educational content focuses on how it delivers baobab powder for immune system support and as a source of baobab powder for natural energy. In the sports nutrition sector, the focus is on its role in baobab powder in sports nutrition and baobab powder and collagen synthesis.
  • For consumers managing health, its use in managing cholesterol and in meal replacement shakes is growing. Supply chains focusing on FairWild certified baobab powder suppliers are reporting up to 20% greater success in securing premium retail placements, underscoring the value of verifiable, sustainable harvesting of baobab fruit and the demand for gluten-free baobab powder uses.

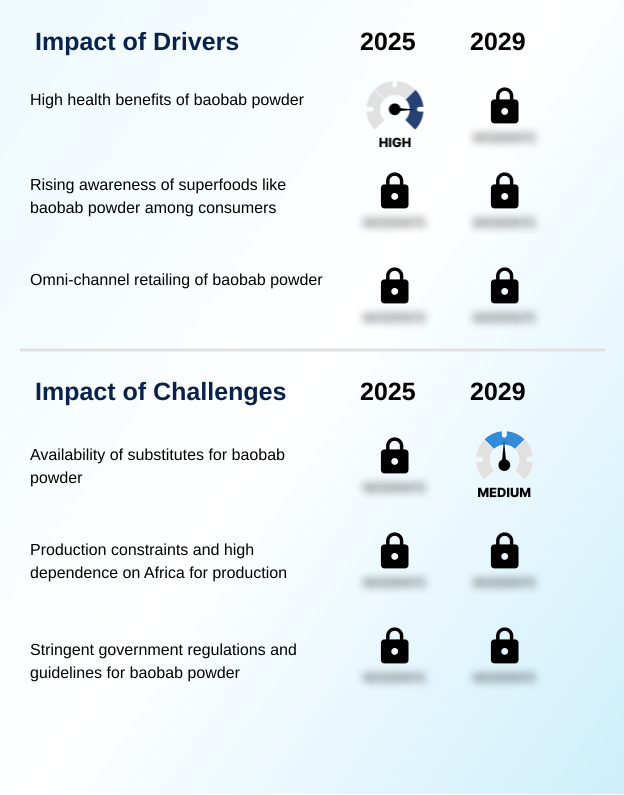
What are the key market drivers leading to the rise in the adoption of Baobab Powder Industry?

  • The significant health benefits associated with baobab powder, particularly its high nutritional content and antioxidant properties, are a key driver for market growth.

  • Market growth is fundamentally driven by the potent health credentials of baobab superfruit powder, which is rich in vitamin C content and high antioxidant content.
  • Its recognition as a source of prebiotic dietary fiber is a significant factor, with products highlighting gut health properties experiencing a 25% higher rate of repeat purchases.
  • This aligns with the broader consumer shift towards plant-based nutrition and ingredients that offer tangible digestive wellness support. As an immune system booster, its immune support benefits are a primary purchasing motivator.
  • The powder's ability to support collagen formation and its natural energy-release attributes make this nutrient-dense powder a versatile component in formulations designed for holistic health.
  • Its electrolyte replenishment capabilities further enhance its appeal in the functional foods sector, where consumer education on benefits translates directly into adoption.

What are the market trends shaping the Baobab Powder Industry?

  • The increasing popularity of baobab supplements is a primary market trend, reflecting a significant rise in consumer interest for natural wellness products and functional ingredients.

  • Key market trends are centered on the rising demand for clean-label and ethically sourced ingredients, which directly benefits baobab powder. The growth of online retail has been a significant enabler, with direct-to-consumer brands that emphasize an ethical supply chain narrative seeing customer acquisition costs that are up to 15% lower than those using traditional retail.
  • This channel allows for detailed storytelling around community-driven sourcing and a brand's ethical sourcing models. Concurrently, the expansion into personal care applications, including anti-aging skincare and other forms of topical cosmetic use, is accelerating.
  • Formulations leveraging organic baobab powder in dietary supplement formulation are gaining traction, with product lines that transparently communicate supply chain transparency reporting 20% higher consumer trust ratings. This convergence of digital commerce and conscious consumerism is redefining market engagement strategies.

What challenges does the Baobab Powder Industry face during its growth?

  • A key challenge affecting industry growth is the widespread availability of superfood substitutes that compete with baobab powder for consumer attention and market share.

  • The market faces considerable challenges from production constraints and the availability of substitutes. The industry's high dependence on wild-harvested baobab from the African savanna ecosystem, with over 85% of global production concentrated in the region, creates significant supply chain vulnerabilities. Any disruption in this post-harvest supply chain can impact a majority of the market.
  • Furthermore, establishing sustainable sourcing practices and primary processing techniques that meet international standards requires significant investment. Firms must navigate complex country-of-origin labeling (COOL) rules and implement robust track-and-trace solutions to ensure quality.
  • The presence of numerous other wild-harvested superfood options and single-origin ingredients presents a constant competitive threat, forcing companies to heavily invest in marketing to differentiate their offerings and educate consumers on the unique benefits of baobab.

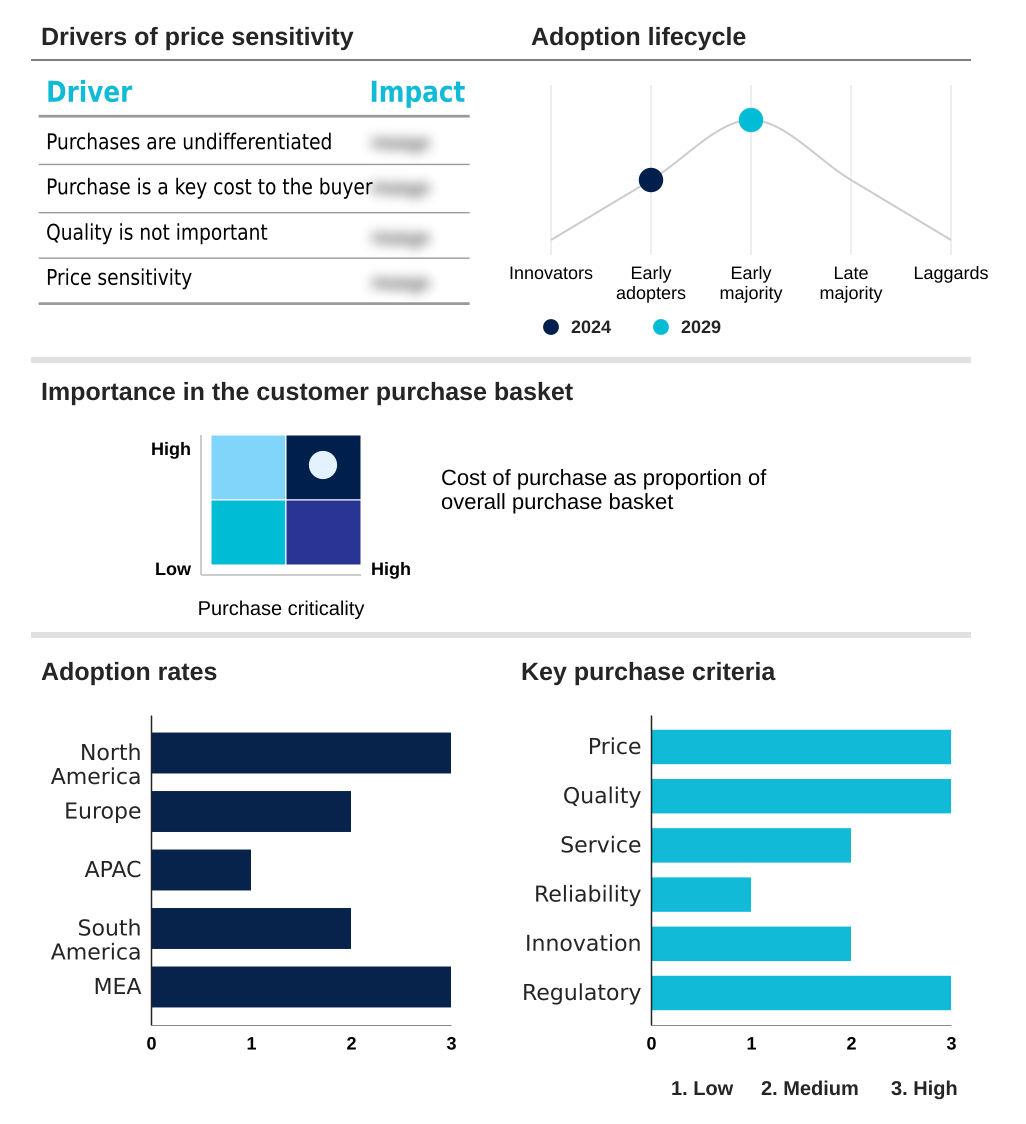
Exclusive Technavio Analysis on Customer Landscape

The baobab powder market forecasting report includes the adoption lifecycle of the market, covering from the innovator’s stage to the laggard’s stage. It focuses on adoption rates in different regions based on penetration. Furthermore, the baobab powder market report also includes key purchase criteria and drivers of price sensitivity to help companies evaluate and develop their market growth analysis strategies.

Customer Landscape of Baobab Powder Industry

Competitive Landscape

Companies are implementing various strategies, such as strategic alliances, baobab powder market forecast, partnerships, mergers and acquisitions, geographical expansion, and product/service launches, to enhance their presence in the industry.

Aduna Ltd. - Offers nutrient-dense baobab superfruit powder, recognized for its high vitamin C and fiber content, supporting wellness and diverse nutritional applications.

The industry research and growth report includes detailed analyses of the competitive landscape of the market and information about key companies, including:

  • Aduna Ltd.
  • Atacora LLC
  • B Ayoba Pvt Ltd
  • Baobab Foods LLC
  • EcoProducts
  • Ecuadorian Rainforest LLC
  • Farafena
  • Halka B. Organics
  • Holland and Barrett Ltd.
  • Indigo Herbs Ltd.
  • KIKI Ltd.
  • Organic Burst World SA
  • Organic Herb Trading Ltd.
  • Stern Ingredients Inc.
  • TheHealthyTree Co. LTD
  • Woodland Foods Ltd.
  • Z Natural Foods LLC

Qualitative and quantitative analysis of companies has been conducted to help clients understand the wider business environment as well as the strengths and weaknesses of key industry players. Data is qualitatively analyzed to categorize companies as pure play, category-focused, industry-focused, and diversified; it is quantitatively analyzed to categorize companies as dominant, leading, strong, tentative, and weak.

Recent Development and News in Baobab powder market

  • In September 2024, Kaibae and TheBU partnered to launch their Baobab The Queen of Superfruits kombucha, available exclusively at Erewhon, a high-end organic retailer in Southern California.
  • In November 2024, Dohler, a global producer of natural ingredients, launched its new Multi-Sense Flavours portfolio, prominently featuring baobab as a key flavor for modern beverage applications.
  • In January 2025, B'Ayoba, one of Africa's largest producers of organic baobab, secured a new round of financing to expand its socially and environmentally responsible production operations in Zimbabwe.
  • In April 2025, Kaibae, a company specializing in wild-harvested ingredients, was featured on the television program Shark Tank, leading to a significant surge in online sales and consumer interest.

Dive into Technavio’s robust research methodology, blending expert interviews, extensive data synthesis, and validated models for unparalleled Baobab Powder Market insights. See full methodology.

Market Scope
Page number 290
Base year 2024
Historic period 2019-2023
Forecast period 2025-2029
Growth momentum & CAGR Accelerate at a CAGR of 6.4%
Market growth 2025-2029 USD 9546.2 thousand
Market structure Fragmented
YoY growth 2024-2025(%) 6.1%
Key countries US, Canada, Mexico, Germany, UK, France, Italy, Spain, The Netherlands, China, India, Japan, South Korea, Thailand, Indonesia, Brazil, Argentina, Chile, Saudi Arabia, UAE, South Africa, Egypt and Nigeria
Competitive landscape Leading Companies, Market Positioning of Companies, Competitive Strategies, and Industry Risks

Request Free Sample

Research Analyst Overview

  • The baobab powder market is evolving from a niche category into a mainstream functional ingredient, characterized by a dual focus on ethical sourcing models and advanced primary processing techniques. The industry leverages both organic baobab powder and conventional baobab powder, which are derived from dried fruit pulp.
  • Its application as a minimally processed food ingredient is expanding, driven by demand for plant-based protein source options in food and beverage applications. As a nutrient-rich ingredient, its vitamin c content and high antioxidant content are central to its value proposition. Firms are using it for dietary supplement formulation, particularly in bodybuilding supplements, meal replacement products, and smoothie mixes.
  • The supply chain is under pressure to adopt sustainable sourcing practices and supply chain transparency, often using track-and-trace solutions. This is critical as the wild-harvested baobab is refined using advanced milling techniques to preserve its gut health properties and immune support benefits.
  • Boardroom decisions are increasingly shaped by the need for FairWild certification and USDA organic certification, which can improve market access by 30%. The ingredient's utility in personal care applications, functional beverage formulation, and its energy-boosting attributes continue to open new commercial avenues, from energy and cereal bars to nutricosmetics applications and as a cold-pressed juice ingredient.

What are the Key Data Covered in this Baobab Powder Market Research and Growth Report?

  • What is the expected growth of the Baobab Powder Market between 2025 and 2029?

    • USD 9.55 million, at a CAGR of 6.4%

  • What segmentation does the market report cover?

    • The report is segmented by Application (Food, Beverages, Personal care), Product Type (Conventional baobab powder, Organic baobab powder), Distribution Channel (Supermarkets, Health food stores, Speciality stores, Online retail) and Geography (North America, Europe, APAC, South America, Middle East and Africa)

  • Which regions are analyzed in the report?

    • North America, Europe, APAC, South America and Middle East and Africa

  • What are the key growth drivers and market challenges?

    • High health benefits of baobab powder, Availability of substitutes for baobab powder

  • Who are the major players in the Baobab Powder Market?

    • Aduna Ltd., Atacora LLC, B Ayoba Pvt Ltd, Baobab Foods LLC, EcoProducts, Ecuadorian Rainforest LLC, Farafena, Halka B. Organics, Holland and Barrett Ltd., Indigo Herbs Ltd., KIKI Ltd., Organic Burst World SA, Organic Herb Trading Ltd., Stern Ingredients Inc., TheHealthyTree Co. LTD, Woodland Foods Ltd. and Z Natural Foods LLC

Market Research Insights

  • The market's momentum is tied to its novel food ingredient status and its Generally Recognized as Safe (GRAS) classification, which has facilitated its adoption. The ethical supply chain narrative, emphasizing community-driven sourcing and women-led harvesting from the African savanna ecosystem, resonates with consumers, with brands demonstrating this seeing up to a 10% increase in loyalty.
  • Compliance with EU food supplement legislation and the Novel Food Regulation 2015/2283 is critical for European entry. As a wild-harvested superfood, its exotic citrus flavor and nutrient-dense powder composition make it ideal for plant-based nutrition and clean-label formulation. Applications in anti-aging skincare and as a topical cosmetic use are expanding, leveraging its natural astringent effect.
  • The digestive wellness support and immune system booster attributes drive its use as a functional beverage additive and organic smoothie booster, where non-GMO project verified status can increase uptake by 15%.

We can help! Our analysts can customize this baobab powder market research report to meet your requirements.

Get in touch

1. Executive Summary

1.1 Market overview

Executive Summary - Chart on Market Overview
Executive Summary - Data Table on Market Overview
Executive Summary - Chart on Global Market Characteristics
Executive Summary - Chart on Market by Geography
Executive Summary - Chart on Market Segmentation by Application
Executive Summary - Chart on Market Segmentation by Product Type
Executive Summary - Chart on Market Segmentation by Distribution Channel
Executive Summary - Chart on Incremental Growth
Executive Summary - Data Table on Incremental Growth
Executive Summary - Chart on Company Market Positioning

2. Technavio Analysis

2.1 Analysis of price sensitivity, lifecycle, customer purchase basket, adoption rates, and purchase criteria

2.2 Criticality of inputs and Factors of differentiation

Chart on Overview on criticality of inputs and factors of differentiation

2.3 Factors of disruption

Chart on Overview on factors of disruption

2.4 Impact of drivers and challenges

Chart on Impact of drivers and challenges in 2024 and 2029

3. Market Landscape

3.1 Market ecosystem

Chart on Parent Market
Data Table on - Parent Market

3.2 Market characteristics

Chart on Market characteristics analysis

3.3 Value chain analysis

Chart on Value chain analysis

4. Market Sizing

4.1 Market definition

Data Table on Offerings of companies included in the market definition

4.2 Market segment analysis

Market segments

4.3 Market size 2024

4.4 Market outlook: Forecast for 2024-2029

Chart on Global - Market size and forecast 2024-2029 ($ thousand)
Data Table on Global - Market size and forecast 2024-2029 ($ thousand)
Chart on Global Market: Year-over-year growth 2024-2029 (%)
Data Table on Global Market: Year-over-year growth 2024-2029 (%)

5. Historic Market Size

5.1 Global Baobab Powder Market 2019 - 2023

Historic Market Size - Data Table on Global Baobab Powder Market 2019 - 2023 ($ thousand)

5.2 Application segment analysis 2019 - 2023

Historic Market Size - Application Segment 2019 - 2023 ($ thousand)

5.3 Product Type segment analysis 2019 - 2023

Historic Market Size - Product Type Segment 2019 - 2023 ($ thousand)

5.4 Distribution Channel segment analysis 2019 - 2023

Historic Market Size - Distribution Channel Segment 2019 - 2023 ($ thousand)

5.5 Geography segment analysis 2019 - 2023

Historic Market Size - Geography Segment 2019 - 2023 ($ thousand)

5.6 Country segment analysis 2019 - 2023

Historic Market Size - Country Segment 2019 - 2023 ($ thousand)

6. Qualitative Analysis

6.1 Impact of AI in the global baobab powder market

7. Five Forces Analysis

7.1 Five forces summary

Five forces analysis - Comparison between 2024 and 2029

7.2 Bargaining power of buyers

Bargaining power of buyers - Impact of key factors 2024 and 2029

7.3 Bargaining power of suppliers

Bargaining power of suppliers - Impact of key factors in 2024 and 2029

7.4 Threat of new entrants

Threat of new entrants - Impact of key factors in 2024 and 2029

7.5 Threat of substitutes

Threat of substitutes - Impact of key factors in 2024 and 2029

7.6 Threat of rivalry

Threat of rivalry - Impact of key factors in 2024 and 2029

7.7 Market condition

Chart on Market condition - Five forces 2024 and 2029

8. Market Segmentation by Application

8.1 Market segments

Chart on Application - Market share 2024-2029 (%)
Data Table on Application - Market share 2024-2029 (%)

8.2 Comparison by Application

Chart on Comparison by Application
Data Table on Comparison by Application

8.3 Food - Market size and forecast 2024-2029

Chart on Food - Market size and forecast 2024-2029 ($ thousand)
Data Table on Food - Market size and forecast 2024-2029 ($ thousand)
Chart on Food - Year-over-year growth 2024-2029 (%)
Data Table on Food - Year-over-year growth 2024-2029 (%)

8.4 Beverages - Market size and forecast 2024-2029

Chart on Beverages - Market size and forecast 2024-2029 ($ thousand)
Data Table on Beverages - Market size and forecast 2024-2029 ($ thousand)
Chart on Beverages - Year-over-year growth 2024-2029 (%)
Data Table on Beverages - Year-over-year growth 2024-2029 (%)

8.5 Personal care - Market size and forecast 2024-2029

Chart on Personal care - Market size and forecast 2024-2029 ($ thousand)
Data Table on Personal care - Market size and forecast 2024-2029 ($ thousand)
Chart on Personal care - Year-over-year growth 2024-2029 (%)
Data Table on Personal care - Year-over-year growth 2024-2029 (%)

8.6 Market opportunity by Application

Market opportunity by Application ($ thousand)
Data Table on Market opportunity by Application ($ thousand)

9. Market Segmentation by Product Type

9.1 Market segments

Chart on Product Type - Market share 2024-2029 (%)
Data Table on Product Type - Market share 2024-2029 (%)

9.2 Comparison by Product Type

Chart on Comparison by Product Type
Data Table on Comparison by Product Type

9.3 Conventional baobab powder - Market size and forecast 2024-2029

Chart on Conventional baobab powder - Market size and forecast 2024-2029 ($ thousand)
Data Table on Conventional baobab powder - Market size and forecast 2024-2029 ($ thousand)
Chart on Conventional baobab powder - Year-over-year growth 2024-2029 (%)
Data Table on Conventional baobab powder - Year-over-year growth 2024-2029 (%)

9.4 Organic baobab powder - Market size and forecast 2024-2029

Chart on Organic baobab powder - Market size and forecast 2024-2029 ($ thousand)
Data Table on Organic baobab powder - Market size and forecast 2024-2029 ($ thousand)
Chart on Organic baobab powder - Year-over-year growth 2024-2029 (%)
Data Table on Organic baobab powder - Year-over-year growth 2024-2029 (%)

9.5 Market opportunity by Product Type

Market opportunity by Product Type ($ thousand)
Data Table on Market opportunity by Product Type ($ thousand)

10. Market Segmentation by Distribution Channel

10.1 Market segments

Chart on Distribution Channel - Market share 2024-2029 (%)
Data Table on Distribution Channel - Market share 2024-2029 (%)

10.2 Comparison by Distribution Channel

Chart on Comparison by Distribution Channel
Data Table on Comparison by Distribution Channel

10.3 Supermarkets - Market size and forecast 2024-2029

Chart on Supermarkets - Market size and forecast 2024-2029 ($ thousand)
Data Table on Supermarkets - Market size and forecast 2024-2029 ($ thousand)
Chart on Supermarkets - Year-over-year growth 2024-2029 (%)
Data Table on Supermarkets - Year-over-year growth 2024-2029 (%)

10.4 Health food stores - Market size and forecast 2024-2029

Chart on Health food stores - Market size and forecast 2024-2029 ($ thousand)
Data Table on Health food stores - Market size and forecast 2024-2029 ($ thousand)
Chart on Health food stores - Year-over-year growth 2024-2029 (%)
Data Table on Health food stores - Year-over-year growth 2024-2029 (%)

10.5 Speciality stores - Market size and forecast 2024-2029

Chart on Speciality stores - Market size and forecast 2024-2029 ($ thousand)
Data Table on Speciality stores - Market size and forecast 2024-2029 ($ thousand)
Chart on Speciality stores - Year-over-year growth 2024-2029 (%)
Data Table on Speciality stores - Year-over-year growth 2024-2029 (%)

10.6 Online retail - Market size and forecast 2024-2029

Chart on Online retail - Market size and forecast 2024-2029 ($ thousand)
Data Table on Online retail - Market size and forecast 2024-2029 ($ thousand)
Chart on Online retail - Year-over-year growth 2024-2029 (%)
Data Table on Online retail - Year-over-year growth 2024-2029 (%)

10.7 Market opportunity by Distribution Channel

Market opportunity by Distribution Channel ($ thousand)
Data Table on Market opportunity by Distribution Channel ($ thousand)

11. Customer Landscape

11.1 Customer landscape overview

Analysis of price sensitivity, lifecycle, customer purchase basket, adoption rates, and purchase criteria

12. Geographic Landscape

12.1 Geographic segmentation

Chart on Market share by geography 2024-2029 (%)
Data Table on Market share by geography 2024-2029 (%)

12.2 Geographic comparison

Chart on Geographic comparison
Data Table on Geographic comparison

12.3 North America - Market size and forecast 2024-2029

Chart on North America - Market size and forecast 2024-2029 ($ thousand)
Data Table on North America - Market size and forecast 2024-2029 ($ thousand)
Chart on North America - Year-over-year growth 2024-2029 (%)
Data Table on North America - Year-over-year growth 2024-2029 (%)
Chart on Regional Comparison - North America
Data Table on Regional Comparison - North America

12.3.1 US - Market size and forecast 2024-2029

Chart on US - Market size and forecast 2024-2029 ($ thousand)
Data Table on US - Market size and forecast 2024-2029 ($ thousand)
Chart on US - Year-over-year growth 2024-2029 (%)
Data Table on US - Year-over-year growth 2024-2029 (%)

12.3.2 Canada - Market size and forecast 2024-2029

Chart on Canada - Market size and forecast 2024-2029 ($ thousand)
Data Table on Canada - Market size and forecast 2024-2029 ($ thousand)
Chart on Canada - Year-over-year growth 2024-2029 (%)
Data Table on Canada - Year-over-year growth 2024-2029 (%)

12.3.3 Mexico - Market size and forecast 2024-2029

Chart on Mexico - Market size and forecast 2024-2029 ($ thousand)
Data Table on Mexico - Market size and forecast 2024-2029 ($ thousand)
Chart on Mexico - Year-over-year growth 2024-2029 (%)
Data Table on Mexico - Year-over-year growth 2024-2029 (%)

12.4 Europe - Market size and forecast 2024-2029

Chart on Europe - Market size and forecast 2024-2029 ($ thousand)
Data Table on Europe - Market size and forecast 2024-2029 ($ thousand)
Chart on Europe - Year-over-year growth 2024-2029 (%)
Data Table on Europe - Year-over-year growth 2024-2029 (%)
Chart on Regional Comparison - Europe
Data Table on Regional Comparison - Europe

12.4.1 Germany - Market size and forecast 2024-2029

Chart on Germany - Market size and forecast 2024-2029 ($ thousand)
Data Table on Germany - Market size and forecast 2024-2029 ($ thousand)
Chart on Germany - Year-over-year growth 2024-2029 (%)
Data Table on Germany - Year-over-year growth 2024-2029 (%)

12.4.2 UK - Market size and forecast 2024-2029

Chart on UK - Market size and forecast 2024-2029 ($ thousand)
Data Table on UK - Market size and forecast 2024-2029 ($ thousand)
Chart on UK - Year-over-year growth 2024-2029 (%)
Data Table on UK - Year-over-year growth 2024-2029 (%)

12.4.3 France - Market size and forecast 2024-2029

Chart on France - Market size and forecast 2024-2029 ($ thousand)
Data Table on France - Market size and forecast 2024-2029 ($ thousand)
Chart on France - Year-over-year growth 2024-2029 (%)
Data Table on France - Year-over-year growth 2024-2029 (%)

12.4.4 Italy - Market size and forecast 2024-2029

Chart on Italy - Market size and forecast 2024-2029 ($ thousand)
Data Table on Italy - Market size and forecast 2024-2029 ($ thousand)
Chart on Italy - Year-over-year growth 2024-2029 (%)
Data Table on Italy - Year-over-year growth 2024-2029 (%)

12.4.5 Spain - Market size and forecast 2024-2029

Chart on Spain - Market size and forecast 2024-2029 ($ thousand)
Data Table on Spain - Market size and forecast 2024-2029 ($ thousand)
Chart on Spain - Year-over-year growth 2024-2029 (%)
Data Table on Spain - Year-over-year growth 2024-2029 (%)

12.4.6 The Netherlands - Market size and forecast 2024-2029

Chart on The Netherlands - Market size and forecast 2024-2029 ($ thousand)
Data Table on The Netherlands - Market size and forecast 2024-2029 ($ thousand)
Chart on The Netherlands - Year-over-year growth 2024-2029 (%)
Data Table on The Netherlands - Year-over-year growth 2024-2029 (%)

12.5 APAC - Market size and forecast 2024-2029

Chart on APAC - Market size and forecast 2024-2029 ($ thousand)
Data Table on APAC - Market size and forecast 2024-2029 ($ thousand)
Chart on APAC - Year-over-year growth 2024-2029 (%)
Data Table on APAC - Year-over-year growth 2024-2029 (%)
Chart on Regional Comparison - APAC
Data Table on Regional Comparison - APAC

12.5.1 China - Market size and forecast 2024-2029

Chart on China - Market size and forecast 2024-2029 ($ thousand)
Data Table on China - Market size and forecast 2024-2029 ($ thousand)
Chart on China - Year-over-year growth 2024-2029 (%)
Data Table on China - Year-over-year growth 2024-2029 (%)

12.5.2 India - Market size and forecast 2024-2029

Chart on India - Market size and forecast 2024-2029 ($ thousand)
Data Table on India - Market size and forecast 2024-2029 ($ thousand)
Chart on India - Year-over-year growth 2024-2029 (%)
Data Table on India - Year-over-year growth 2024-2029 (%)

12.5.3 Japan - Market size and forecast 2024-2029

Chart on Japan - Market size and forecast 2024-2029 ($ thousand)
Data Table on Japan - Market size and forecast 2024-2029 ($ thousand)
Chart on Japan - Year-over-year growth 2024-2029 (%)
Data Table on Japan - Year-over-year growth 2024-2029 (%)

12.5.4 South Korea - Market size and forecast 2024-2029

Chart on South Korea - Market size and forecast 2024-2029 ($ thousand)
Data Table on South Korea - Market size and forecast 2024-2029 ($ thousand)
Chart on South Korea - Year-over-year growth 2024-2029 (%)
Data Table on South Korea - Year-over-year growth 2024-2029 (%)

12.5.5 Thailand - Market size and forecast 2024-2029

Chart on Thailand - Market size and forecast 2024-2029 ($ thousand)
Data Table on Thailand - Market size and forecast 2024-2029 ($ thousand)
Chart on Thailand - Year-over-year growth 2024-2029 (%)
Data Table on Thailand - Year-over-year growth 2024-2029 (%)

12.5.6 Indonesia - Market size and forecast 2024-2029

Chart on Indonesia - Market size and forecast 2024-2029 ($ thousand)
Data Table on Indonesia - Market size and forecast 2024-2029 ($ thousand)
Chart on Indonesia - Year-over-year growth 2024-2029 (%)
Data Table on Indonesia - Year-over-year growth 2024-2029 (%)

12.6 South America - Market size and forecast 2024-2029

Chart on South America - Market size and forecast 2024-2029 ($ thousand)
Data Table on South America - Market size and forecast 2024-2029 ($ thousand)
Chart on South America - Year-over-year growth 2024-2029 (%)
Data Table on South America - Year-over-year growth 2024-2029 (%)
Chart on Regional Comparison - South America
Data Table on Regional Comparison - South America

12.6.1 Brazil - Market size and forecast 2024-2029

Chart on Brazil - Market size and forecast 2024-2029 ($ thousand)
Data Table on Brazil - Market size and forecast 2024-2029 ($ thousand)
Chart on Brazil - Year-over-year growth 2024-2029 (%)
Data Table on Brazil - Year-over-year growth 2024-2029 (%)

12.6.2 Argentina - Market size and forecast 2024-2029

Chart on Argentina - Market size and forecast 2024-2029 ($ thousand)
Data Table on Argentina - Market size and forecast 2024-2029 ($ thousand)
Chart on Argentina - Year-over-year growth 2024-2029 (%)
Data Table on Argentina - Year-over-year growth 2024-2029 (%)

12.6.3 Chile - Market size and forecast 2024-2029

Chart on Chile - Market size and forecast 2024-2029 ($ thousand)
Data Table on Chile - Market size and forecast 2024-2029 ($ thousand)
Chart on Chile - Year-over-year growth 2024-2029 (%)
Data Table on Chile - Year-over-year growth 2024-2029 (%)

12.7 Middle East and Africa - Market size and forecast 2024-2029

Chart on Middle East and Africa - Market size and forecast 2024-2029 ($ thousand)
Data Table on Middle East and Africa - Market size and forecast 2024-2029 ($ thousand)
Chart on Middle East and Africa - Year-over-year growth 2024-2029 (%)
Data Table on Middle East and Africa - Year-over-year growth 2024-2029 (%)
Chart on Regional Comparison - Middle East and Africa
Data Table on Regional Comparison - Middle East and Africa

12.7.1 Saudi Arabia - Market size and forecast 2024-2029

Chart on Saudi Arabia - Market size and forecast 2024-2029 ($ thousand)
Data Table on Saudi Arabia - Market size and forecast 2024-2029 ($ thousand)
Chart on Saudi Arabia - Year-over-year growth 2024-2029 (%)
Data Table on Saudi Arabia - Year-over-year growth 2024-2029 (%)

12.7.2 UAE - Market size and forecast 2024-2029

Chart on UAE - Market size and forecast 2024-2029 ($ thousand)
Data Table on UAE - Market size and forecast 2024-2029 ($ thousand)
Chart on UAE - Year-over-year growth 2024-2029 (%)
Data Table on UAE - Year-over-year growth 2024-2029 (%)

12.7.3 South Africa - Market size and forecast 2024-2029

Chart on South Africa - Market size and forecast 2024-2029 ($ thousand)
Data Table on South Africa - Market size and forecast 2024-2029 ($ thousand)
Chart on South Africa - Year-over-year growth 2024-2029 (%)
Data Table on South Africa - Year-over-year growth 2024-2029 (%)

12.7.4 Egypt - Market size and forecast 2024-2029

Chart on Egypt - Market size and forecast 2024-2029 ($ thousand)
Data Table on Egypt - Market size and forecast 2024-2029 ($ thousand)
Chart on Egypt - Year-over-year growth 2024-2029 (%)
Data Table on Egypt - Year-over-year growth 2024-2029 (%)

12.7.5 Nigeria - Market size and forecast 2024-2029

Chart on Nigeria - Market size and forecast 2024-2029 ($ thousand)
Data Table on Nigeria - Market size and forecast 2024-2029 ($ thousand)
Chart on Nigeria - Year-over-year growth 2024-2029 (%)
Data Table on Nigeria - Year-over-year growth 2024-2029 (%)

12.8 Market opportunity by geography

Market opportunity by geography ($ thousand)
Data Tables on Market opportunity by geography ($ thousand)

13. Drivers, Challenges, and Opportunity

13.1 Market drivers

High health benefits of baobab powder
Rising awareness of superfoods like baobab powder among consumers
Omni-channel retailing of baobab powder

13.2 Market challenges

Availability of substitutes for baobab powder
Production constraints and high dependence on Africa for production
Stringent government regulations and guidelines for baobab powder

13.3 Impact of drivers and challenges

Impact of drivers and challenges in 2024 and 2029

13.4 Market opportunities

Growing popularity of baobab supplements
Increasing online purchasing trends
Rising popularity of clean labeling

14. Competitive Landscape

14.1 Overview

14.2

Overview on criticality of inputs and factors of differentiation

14.3 Landscape disruption

Overview on factors of disruption

14.4 Industry risks

Impact of key risks on business

15. Competitive Analysis

15.1 Companies profiled

Companies covered

15.2 Company ranking index

15.3 Market positioning of companies

Matrix on companies position and classification

15.4 Aduna Ltd.

Aduna Ltd. - Overview
Aduna Ltd. - Product / Service
Aduna Ltd. - Key offerings
SWOT

15.5 Atacora LLC

Atacora LLC - Overview
Atacora LLC - Product / Service
Atacora LLC - Key offerings
SWOT

15.6 B Ayoba Pvt Ltd

B Ayoba Pvt Ltd - Overview
B Ayoba Pvt Ltd - Product / Service
B Ayoba Pvt Ltd - Key offerings
SWOT

15.7 Baobab Foods LLC

Baobab Foods LLC - Overview
Baobab Foods LLC - Product / Service
Baobab Foods LLC - Key offerings
SWOT

15.8 EcoProducts

EcoProducts - Overview
EcoProducts - Product / Service
EcoProducts - Key offerings
SWOT

15.9 Ecuadorian Rainforest LLC

Ecuadorian Rainforest LLC - Overview
Ecuadorian Rainforest LLC - Product / Service
Ecuadorian Rainforest LLC - Key offerings
SWOT

15.10 Farafena

Farafena - Overview
Farafena - Product / Service
Farafena - Key offerings
SWOT

15.11 Halka B. Organics

Halka B. Organics - Overview
Halka B. Organics - Product / Service
Halka B. Organics - Key offerings
SWOT

15.12 Holland and Barrett Ltd.

Holland and Barrett Ltd. - Overview
Holland and Barrett Ltd. - Product / Service
Holland and Barrett Ltd. - Key offerings
SWOT

15.13 Indigo Herbs Ltd.

Indigo Herbs Ltd. - Overview
Indigo Herbs Ltd. - Product / Service
Indigo Herbs Ltd. - Key offerings
SWOT

15.14 Organic Burst World SA

Organic Burst World SA - Overview
Organic Burst World SA - Product / Service
Organic Burst World SA - Key offerings
SWOT

15.15 Stern Ingredients Inc.

Stern Ingredients Inc. - Overview
Stern Ingredients Inc. - Product / Service
Stern Ingredients Inc. - Key offerings
SWOT

15.16 TheHealthyTree Co. LTD

TheHealthyTree Co. LTD - Overview
TheHealthyTree Co. LTD - Product / Service
TheHealthyTree Co. LTD - Key offerings
SWOT

15.17 Woodland Foods Ltd.

Woodland Foods Ltd. - Overview
Woodland Foods Ltd. - Product / Service
Woodland Foods Ltd. - Key offerings
SWOT

15.18 Z Natural Foods LLC

Z Natural Foods LLC - Overview
Z Natural Foods LLC - Product / Service
Z Natural Foods LLC - Key offerings
SWOT

16. Appendix

16.1 Scope of the report

Market definition
Objectives
Notes and caveats

16.2 Inclusions and exclusions checklist

Inclusions checklist
Exclusions checklist

16.3 Currency conversion rates for US$

16.4 Research methodology

16.5 Data procurement

Information sources

16.6 Data validation

16.7 Validation techniques employed for market sizing

16.8 Data synthesis

16.9 360 degree market analysis

16.10 List of abbreviations

Research Methodology

Technavio presents a detailed picture of the market by way of study, synthesis, and summation of data from multiple sources. The analysts have presented the various facets of the market with a particular focus on identifying the key industry influencers. The data thus presented is comprehensive, reliable, and the result of extensive research, both primary and secondary.

INFORMATION SOURCES

Primary sources

  • Manufacturers and suppliers
  • Channel partners
  • Industry experts
  • Strategic decision makers

Secondary sources

  • Industry journals and periodicals
  • Government data
  • Financial reports of key industry players
  • Historical data
  • Press releases

DATA ANALYSIS

Data Synthesis

  • Collation of data
  • Estimation of key figures
  • Analysis of derived insights

Data Validation

  • Triangulation with data models
  • Reference against proprietary databases
  • Corroboration with industry experts

REPORT WRITING

Qualitative

  • Market drivers
  • Market challenges
  • Market trends
  • Five forces analysis

Quantitative

  • Market size and forecast
  • Market segmentation
  • Geographical insights
  • Competitive landscape

Interested in this report?

Get your sample now to see our research methodology and insights!

Download Now

Frequently Asked Questions

Baobab Powder market growth will increase by USD 9546.2 thousand thousand during 2025-2029.

The Baobab Powder market is expected to grow at a CAGR of 6.4% during 2025-2029.

Baobab Powder market is segmented by Application (Food, Beverages, Personal care) Product type (Conventional baobab powder, Organic baobab powder) Distribution channel (Supermarkets, Health food stores, Speciality stores, Online retail)

Aduna Ltd., Atacora LLC, B Ayoba Pvt Ltd, Baobab Foods LLC, EcoProducts, Ecuadorian Rainforest LLC, Farafena, Halka B. Organics, Holland and Barrett Ltd., Indigo Herbs Ltd., KIKI Ltd., Organic Burst World SA, Organic Herb Trading Ltd., Stern Ingredients Inc., TheHealthyTree Co. LTD, Woodland Foods Ltd., Z Natural Foods LLC are a few of the key vendors in the Baobab Powder market.

North America will register the highest growth rate of 37.8% among the other regions. Therefore, the Baobab Powder market in North America is expected to garner significant business opportunities for the vendors during the forecast period.

US, Canada, Mexico, Germany, UK, France, Italy, Spain, The Netherlands, China, India, Japan, South Korea, Thailand, Indonesia, Brazil, Argentina, Chile, Saudi Arabia, UAE, South Africa, Egypt, Nigeria

  • High health benefits of baobab powder is the driving factor this market.

The Baobab Powder market vendors should focus on grabbing business opportunities from the Application segment as it accounted for the largest market share in the base year.