BBQ Smokers Market Size 2024-2028
The BBQ smokers market size is forecast to increase by USD 279.5 million at a CAGR of 4.87% between 2023 and 2028. The market is witnessing significant growth due to the increasing popularity of charcoal and electric grills for household applications as well as commercial uses. Trends such as glamping, camping, trekking, cookouts, and street food have fueled the demand for these smokers. Technological advancements have led to improvements in the design and functionality of modern BBQ smokers, making them more efficient and convenient for users. Technological innovations, such as Wi-Fi connectivity, temperature control systems, and digital displays, have made BBQ smoking more convenient and accessible to consumers. However, limited awareness regarding the benefits of BBQ smokers remains a challenge for market growth. Charcoal barbeque grills continue to dominate the market due to their traditional appeal and unique flavor imparted to the food. Electric BBQ grills, on the other hand, offer the convenience of easy operation and consistent cooking results. The market is expected to continue its growth trajectory, driven by these trends and advancements.
What will be the Size of the Market During the Forecast Period?
The market is witnessing significant growth due to the increasing popularity of outdoor cooking and the desire for smoky flavors in various dishes. Smokers are essential appliances for barbecue aficionados who seek to enhance the taste and texture of their food through indirect heat cooking. Smokers come in various types, including offset smokers, vertical water smokers, pellet smokers, and electric smokers. Each type caters to specific cooking preferences and requirements. Offset smokers provide versatility through direct and indirect heat options, while vertical water smokers offer consistent temperature control and moisture retention.
Furthermore, pellet smokers provide convenience through automated temperature control, and electric smokers offer ease of use and energy efficiency. Wood chips are a crucial component in smoking food, imparting a smoky flavor that is highly sought after by barbecue enthusiasts. The use of wood chips in smokers has led to the creation of innovative dishes, such as smoked barbecue chicken, seafood, vegetables, and even beetroot. barbecue grills, although different from smokers, are also popular in the US market. Grills offer direct heat cooking, making them suitable for quick cooking and searing. charcoal grills, gas grills, and electric grills are the most common types of grills.
Furthermore, charcoal grills provide a traditional barbecue flavor, while gas grills offer convenience and temperature control. Electric grills provide energy efficiency and ease of use. Lump charcoal and charcoal briquettes are the two primary fuel options for charcoal grills and smokers. Lump charcoal offers a more natural flavor, while charcoal briquettes provide a more consistent burn and longer cooking time. Propane and natural gas are the primary fuel options for gas grills and smokers. Cooking accuracy is a critical factor in the market, with consumers seeking appliances that can maintain consistent temperatures to ensure even cooking and prevent overcooking or undercooking.
Market Segmentation
The market research report provides comprehensive data (region-wise segment analysis), with forecasts and estimates in "USD million" for the period 2024-2028, as well as historical data from 2018-2022 for the following segments.
- Distribution Channel
- Offline
- Online
- Application
- Commercial
- Household
- Geography
- North America
- Canada
- US
- Europe
- Germany
- UK
- APAC
- China
- South America
- Middle East and Africa
- North America
By Distribution Channel Insights
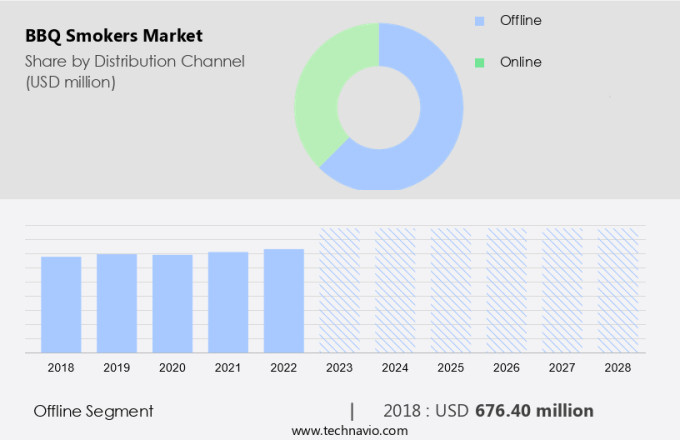
The offline segment is estimated to witness significant growth during the forecast period. The offline market for BBQ smokers in the United States is witnessing significant growth as an increasing number of barbecue enthusiasts prefer purchasing these appliances from brick-and-mortar stores. This segment caters to consumers who value the tactile experience of assessing the product firsthand before making a purchase. Retail outlets offer expert advice from knowledgeable staff, ensuring customers make informed decisions based on their specific requirements. The offline segment encompasses various retail formats, including specialty stores, department stores, supermarkets, and home improvement centers. BBQ smokers come in various types, with pellet smokers and electric smokers being popular choices. Pellet smokers utilize automated pellet feeding and digital temperature control systems, ensuring cooking accuracy and convenience.
Furthermore, enhanced insulation in these smokers retains heat effectively, while stainless steel construction guarantees durability. Electric smokers, on the other hand, offer ease of use and energy efficiency. Smart smokers with Wi-Fi connectivity enable users to monitor and control cooking temperatures remotely. Consumers can physically examine the product, receive expert advice, and make informed decisions. Pellet smokers and electric smokers, with their advanced features, cater to the diverse needs of barbecue aficionados.
Get a glance at the market share of various segments Request Free Sample
The offline segment accounted for USD 676.40 million in 2018 and showed a gradual increase during the forecast period.
Regional Insights
North America is estimated to contribute 44% to the growth of the global market during the forecast period. Technavio's analysts have elaborately explained the regional trends and drivers that shape the market during the forecast period.
For more insights on the market share of various regions Request Free Sample
The market in North America is experiencing notable expansion over the forecast period. The region's market growth is driven by the rising popularity of electric and gas-powered smokers, which provide precise temperature control and ease of use. The increasing trend of food festivals and culinary events has led to a rise in demand for smoked meats, contributing to the market's growth. Additionally, North American consumers' higher living standards, preference for advanced and convenient cooking appliances, and increased disposable income are fueling the adoption of BBQ smokers. The unique smoky flavors imparted to meats, chicken, seafood, vegetables, and even beetroot through smoking processes have made BBQ smokers a must-have in both residential and commercial settings.
Our researchers analyzed the data with 2023 as the base year, along with the key drivers, trends, and challenges. A holistic analysis of drivers will help companies refine their marketing strategies to gain a competitive advantage.
Market Driver
The evolving landscape of culinary diversity is the key driver of the market. The market is experiencing significant growth due to the increasing trend of barbecue culture and the diversity of culinary cooking. This cultural shift, driven by ethnic preferences and lifestyle changes, is leading to an increased demand for BBQ smokers. The hospitality sector, including quick-service restaurants and hotels, is a major consumer of BBQ grill equipment.
Further, the incorporation of live cooking stations and buffet spreads in these establishments is a key trend. Gas barbeque grills are particularly popular due to their convenience and ease of use. The culinary world is a melting pot of traditional and modern techniques, with chefs from various backgrounds blending elements from different cuisines to create innovative dishes. The BBQ grill market is expected to continue growing as the popularity of barbecue culture persists.
Market Trends
Technological advancements in modern BBQ smokers is the upcoming trend in the market. The market is experiencing significant growth due to the integration of advanced technologies in modern BBQ smokers. These innovations include Bluetooth and Wi-Fi connectivity, enabling users to monitor and regulate cooking parameters remotely via mobile devices. Such enhancements add to the convenience and functionality of BBQ smokers, making them more appealing to consumers.
Moreover, technological advancements in BBQ smokers extend to automated temperature control systems, ensuring precise temperature regulation for optimal smoking results. Another emerging category in BBQ smokers is pellet grills, which utilize hardwood pellets as fuel. Pellet grills incorporate an auger system that feeds pellets into a hopper, which in turn ignites them. These advancements contribute to the growing popularity of BBQ smokers in the market.
Market Challenge
Limited awareness regarding BBQ smokers is a key challenge affecting the market growth. The market in the US faces challenges due to limited awareness and understanding of this cooking equipment. BBQ smokers, which include charcoal and electric models, offer unique cooking experiences for various applications such as household use, commercial establishments, glamping, camping, trekking, cookouts, and street food. However, some consumers may perceive BBQ smokers as complex and difficult to operate, leading them to choose more familiar cooking methods like grilling or baking.
Furthermore, this misconception can result in the underutilization of BBQ smokers and lower sales volumes, negatively impacting the market's growth. To increase market penetration, industry players can focus on raising awareness through educational campaigns, product demonstrations, and partnerships with cooking schools and culinary institutions. By highlighting the benefits and versatility of BBQ smokers, potential consumers can be encouraged to explore this cooking method and contribute to the growth of the market.
Exclusive Customer Landscape
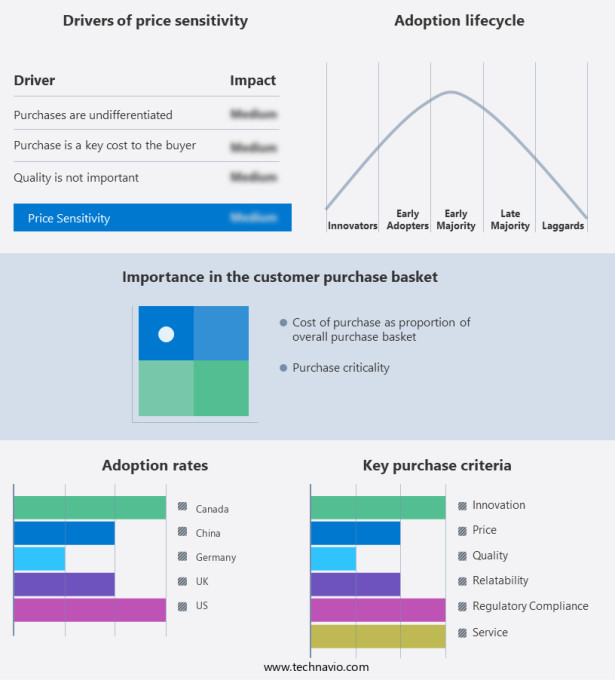
The market forecasting report includes the adoption lifecycle of the market, covering from the innovator's stage to the laggard's stage. It focuses on adoption rates in different regions based on penetration. Furthermore, the report also includes key purchase criteria and drivers of price sensitivity to help companies evaluate and develop their market growth analysis strategies.
Customer Landscape
Key Companies & Market Insights
Companies are implementing various strategies, such as strategic alliances, partnerships, mergers and acquisitions, geographical expansion, and product/service launches, to enhance their presence in the market.
Alto Shaam Inc. - The company offers BBQ smokers such as 500 TH III and 767 SK III, featuring Halo Heat technology for even, moisture-retaining smoking and slow cooking, ideal for commercial kitchens.
The market research and growth report includes detailed analyses of the competitive landscape of the market and information about key companies, including:
- Aldmar Ltd
- Alto Shaam Inc.
- American Barbecue Systems
- BraaiCraft
- Bradley Smoker Inc.
- Cookshack Inc
- LANDMANN Germany GmbH
- Masterbuilt Manufacturing LLC
- Myron Mixon Smokers
- Newell Brands Inc.
- Novo Industries
- Old Smokey Products Co.
- Smoke North
- Southern Pride
- Spectrum Brands Holdings Inc.
- The Middleby Corp.
- Traeger Inc.
- Vista Outdoor Inc.
- W.C. Bradley Co.
- Weber Stephen Products HK Ltd.
Qualitative and quantitative analysis of companies has been conducted to help clients understand the wider business environment as well as the strengths and weaknesses of key market players. Data is qualitatively analyzed to categorize companies as pure play, category-focused, industry-focused, and diversified; it is quantitatively analyzed to categorize companies as dominant, leading, strong, tentative, and weak.
Research Analyst Overview
Outdoor cooking enthusiasts continue to explore new ways to infuse smoky flavors into their dishes, fueling the growth of the smokers market. Smokers, also known as barbecue smokers, are appliances used for smoking food at low temperatures. They come in various types, including offset smokers, vertical water smokers, pellet smokers, and electric smokers. Barbecue aficionados value cooking accuracy, automated pellet feeding, digital temperature control, and enhanced insulation in their smokers. Stainless steel construction, smart smokers with Bluetooth and Wi-Fi connectivity, and flavor fusion are some of the latest trends in the smokers market. Sustainable production and the use of recyclable materials are essential considerations for modern smokers.
Furthermore, while barbecue grills, such as charcoal grills, gas grills, and electric grills, serve different purposes, they often complement smokers in outdoor cooking settings. Indirect heat and direct heat cooking methods, along with smokey flavors, are integral to the BBQ culture. Quick-service restaurants, the hospitality sector, hotel construction, and barbeque grill equipment suppliers are significant commercial markets for smokers. Portable charcoal grills and innovative dishes, such as barbecue chicken, seafood, vegetable, beetroot, and sweet potato, are expanding the application areas of smokers beyond traditional BBQ grill markets. Camping, glamping, cookouts, street food, and grilled dishes are other growing markets for smokers.
|
Market Scope |
|
|
Report Coverage |
Details |
|
Page number |
186 |
|
Base year |
2023 |
|
Historic period |
2018-2022 |
|
Forecast period |
2024-2028 |
|
Growth momentum & CAGR |
Accelerate at a CAGR of 4.87% |
|
Market growth 2024-2028 |
USD 279.5 million |
|
Market structure |
Fragmented |
|
YoY growth 2023-2024(%) |
3.7 |
|
Regional analysis |
North America, Europe, APAC, South America, and Middle East and Africa |
|
Performing market contribution |
North America at 44% |
|
Key countries |
US, Germany, Canada, UK, and China |
|
Competitive landscape |
Leading Companies, Market Positioning of Companies, Competitive Strategies, and Industry Risks |
|
Key companies profiled |
Aldmar Ltd, Alto Shaam Inc., American Barbecue Systems, BraaiCraft , Bradley Smoker Inc., Cookshack Inc, LANDMANN Germany GmbH, Masterbuilt Manufacturing LLC, Myron Mixon Smokers, Newell Brands Inc., Novo Industries , Old Smokey Products Co., Smoke North, Southern Pride, Spectrum Brands Holdings Inc., The Middleby Corp., Traeger Inc., Vista Outdoor Inc., W.C. Bradley Co., and Weber Stephen Products HK Ltd. |
|
Market dynamics |
Parent market analysis, market growth inducers and obstacles, market forecast, fast-growing and slow-growing segment analysis, COVID-19 impact and recovery analysis and future consumer dynamics, market condition analysis for the forecast period |
|
Customization purview |
If our market report has not included the data that you are looking for, you can reach out to our analysts and get segments customized. |
What are the Key Data Covered in this Market Research and Growth Report?
- CAGR of the market during the forecast period
- Detailed information on factors that will drive the market growth and forecasting between 2024 and 2028
- Precise estimation of the size of the market and its contribution of the market in focus to the parent market
- Accurate predictions about upcoming market growth and trends and changes in consumer behaviour
- Growth of the market across North America, Europe, APAC, South America, and Middle East and Africa
- Thorough analysis of the market's competitive landscape and detailed information about companies
- Comprehensive analysis of factors that will challenge the growth of market companies
We can help! Our analysts can customize this market research report to meet your requirements. Get in touch


