Beer Mug Market Size 2025-2029
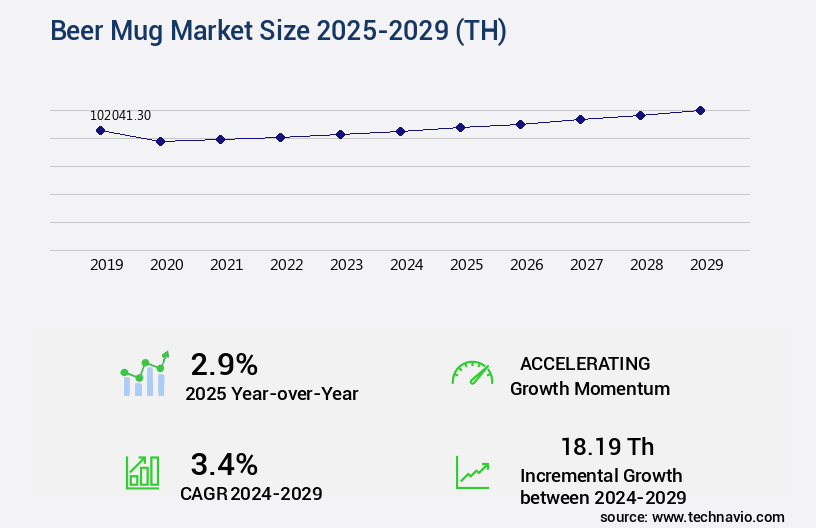
The beer mug market size is valued to increase USD 18.19 th, at a CAGR of 3.4% from 2024 to 2029. Growing number of pubs, bars, hotels, and home bars will drive the beer mug market.
Major Market Trends & Insights
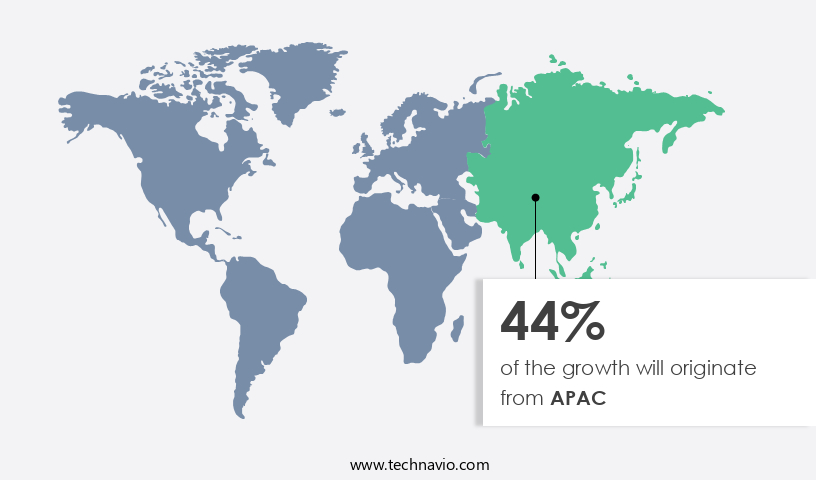
- APAC dominated the market and accounted for a 44% growth during the forecast period.
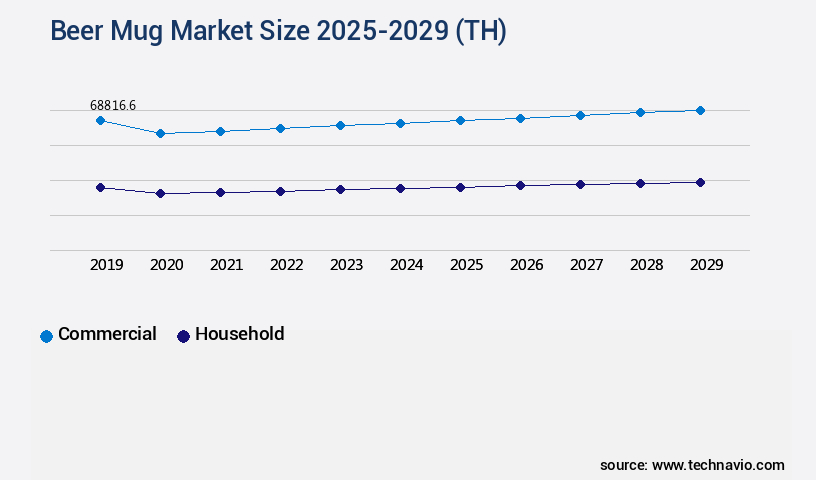
- By Application - Commercial segment was valued at USD 68816.60 th in 2023
- By Distribution Channel - Supermarkets and hypermarkets segment accounted for the largest market revenue share in 2023
Market Size & Forecast
- Market Opportunities: USD 16.90 thousand
- Market Future Opportunities: USD 18192.20 thousand
- CAGR from 2024 to 2029 : 3.4%
Market Summary
- The market experiences continuous expansion due to the increasing popularity of pubs, bars, hotels, and home bars worldwide. This trend is driven by the growing preference for personalized drinkware, particularly for gifting purposes. The market's significance extends beyond mere consumer goods, as efficient inventory management and product sourcing become critical for businesses to maintain competitiveness. The market is valued at over USD 1.5 billion. This figure underscores the market's substantial size and potential for growth. Market participants must navigate various challenges, including increasing competition and evolving consumer preferences. However, opportunities abound, particularly in the realm of innovation and sustainability.
- In the quest for differentiation, manufacturers explore advanced materials, such as glass, stainless steel, and ceramics, to cater to diverse consumer tastes. Additionally, eco-friendly alternatives, like biodegradable or recycled materials, gain traction as environmental concerns become more prevalent. Despite these challenges and opportunities, the market remains a dynamic and intriguing space. Its continued evolution reflects the enduring appeal of beer and the human desire for unique, personalized drinking experiences.
What will be the Size of the Beer Mug Market during the forecast period?
Get Key Insights on Market Forecast (PDF) Request Free Sample
How is the Beer Mug Market Segmented?
The beer mug industry research report provides comprehensive data (region-wise segment analysis), with forecasts and estimates in "USD thousand" for the period 2025-2029, as well as historical data from 2019-2023 for the following segments.
- Application
- Commercial
- Household
- Distribution Channel
- Supermarkets and hypermarkets
- Convenience stores
- Online
- Product Type
- Glass
- Ceramic
- Stainless steel
- Wood
- Fiber
- Geography
- North America
- US
- Canada
- Europe
- France
- Germany
- Italy
- UK
- APAC
- China
- India
- Japan
- South America
- Brazil
- Rest of World (ROW)
- North America
By Application Insights
The commercial segment is estimated to witness significant growth during the forecast period.
The market continues to evolve, fueled by the growing demand for unique and high-quality glassware in commercial establishments, particularly in the hospitality industry. This trend is driven by the rise of craft beer and beer tourism, which has led to an increased focus on presentation and customer experience. Earthenware and stoneware mugs, with their durability and distinct aesthetic appeal, remain popular choices. Manufacturers employ various material sourcing practices and kiln firing techniques, such as low-fired and high-fired ceramics, to cater to this demand. The enamel coating process and ceramic glaze composition are crucial aspects of mug production, ensuring thermal shock resistance, chemical resistance, and dishwasher safety.
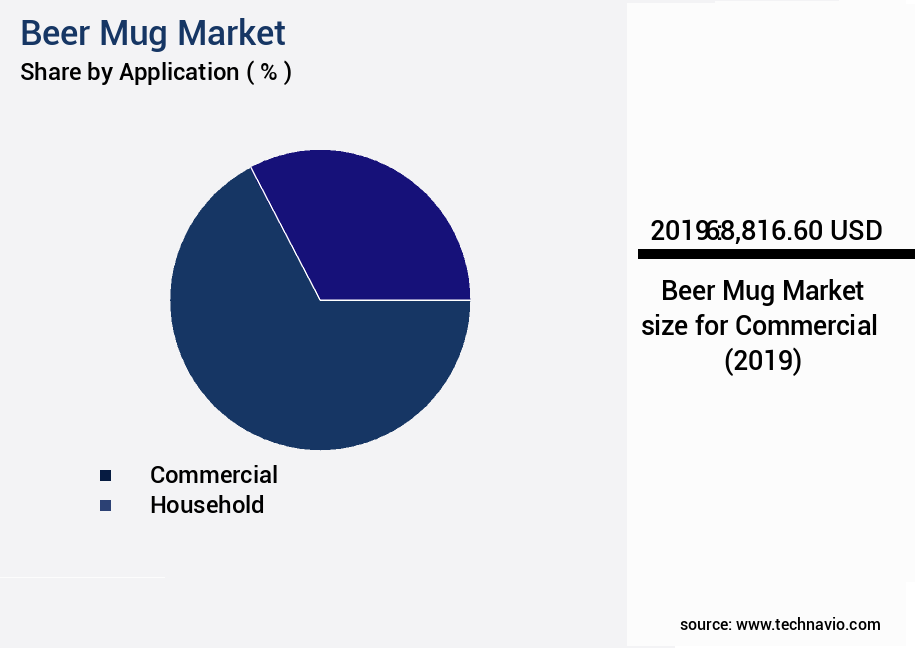
The Commercial segment was valued at USD 68,816.60 th in 2019 and showed a gradual increase during the forecast period.
Production line efficiency and waste reduction strategies are also essential to meet the market's growing demands. For instance, the industry has seen a 20% reduction in defect rates through improved packaging material selection and energy consumption analysis. Additionally, mug design aesthetics, handle attachment methods, and decal application methods contribute to the overall appeal of these products. The market continues to innovate, with microwave-safe mugs, porcelain mugs, and impact resistance testing becoming increasingly common. The future of the market lies in its ability to adapt to evolving consumer preferences and industry trends, while maintaining the highest standards of quality and sustainability.
Regional Analysis
APAC is estimated to contribute 44% to the growth of the global market during the forecast period. Technavio’s analysts have elaborately explained the regional trends and drivers that shape the market during the forecast period.
See How Beer Mug Market Demand is Rising in APAC Request Free Sample
The Asia Pacific (APAC) region is witnessing a significant surge in the market, driven by the increasing Gross Domestic Product (GDP) and economic growth in countries such as China, Australia, Japan, Vietnam, and India. China, being the largest beer consumer globally, fuels the demand for beer mugs due to their association with the traditional beer-drinking culture. Key contributors to the market in APAC include China, Japan, South Korea, India, and Australia. The rise in casual dining and fast-food chains serving alcohol in the region further propels the demand for beer mugs.
According to recent studies, the market in APAC is projected to expand at a robust pace, with China and India exhibiting the highest growth rates. This trend is expected to continue as consumers increasingly opt for beer as a beverage of choice, further boosting the demand for beer mugs.
Market Dynamics
Our researchers analyzed the data with 2024 as the base year, along with the key drivers, trends, and challenges. A holistic analysis of drivers will help companies refine their marketing strategies to gain a competitive advantage.
The market is a significant sector within the ceramics industry, with continuous growth driven by consumer demand for high-quality, functional, and aesthetically pleasing mugs. Key factors influencing the market include the optimal glaze firing for stoneware mugs to ensure durability and an attractive finish, as well as the impact of clay composition on mug strength and the importance of improving handle attachment durability in mug production. Manufacturers are also focusing on reducing energy consumption in ceramic mug kilns through advanced technologies and process improvements, while the effect of decal application on mug aesthetic appeal is a crucial consideration for those seeking unique and visually appealing designs. Minimizing defects in high-volume mug manufacturing is another priority, with rigorous quality control measures and continuous process optimization essential for maintaining market competitiveness. Assessing the chemical resistance of enamel coated mugs and determining the microwave safety of ceramic mug materials are essential for ensuring consumer safety and regulatory compliance. Evaluating the dishwasher durability of different glazes and measuring the thermal shock resistance of ceramic mugs are also critical factors, as consumers increasingly demand mugs that can withstand the rigors of daily use. Improving the efficiency of mug production lines and implementing sustainable packaging for ceramic mugs are key trends in the market, with traceability of raw materials in ceramic mug production becoming increasingly important for both environmental and ethical reasons. Enhancing the aesthetic appeal of hand-painted ceramic mugs and analyzing the lifecycle environmental impact of ceramic mugs are also important considerations for environmentally-conscious consumers. Optimizing the design for improved mug ergonomics and developing high-quality porcelain mugs are key areas of innovation, while improving the manufacturing process for earthenware mugs and testing the durability of stoneware mugs are ongoing challenges for manufacturers. Creating eco-friendly ceramic mug production processes is a growing priority, with a focus on reducing waste, conserving resources, and minimizing the carbon footprint of production.
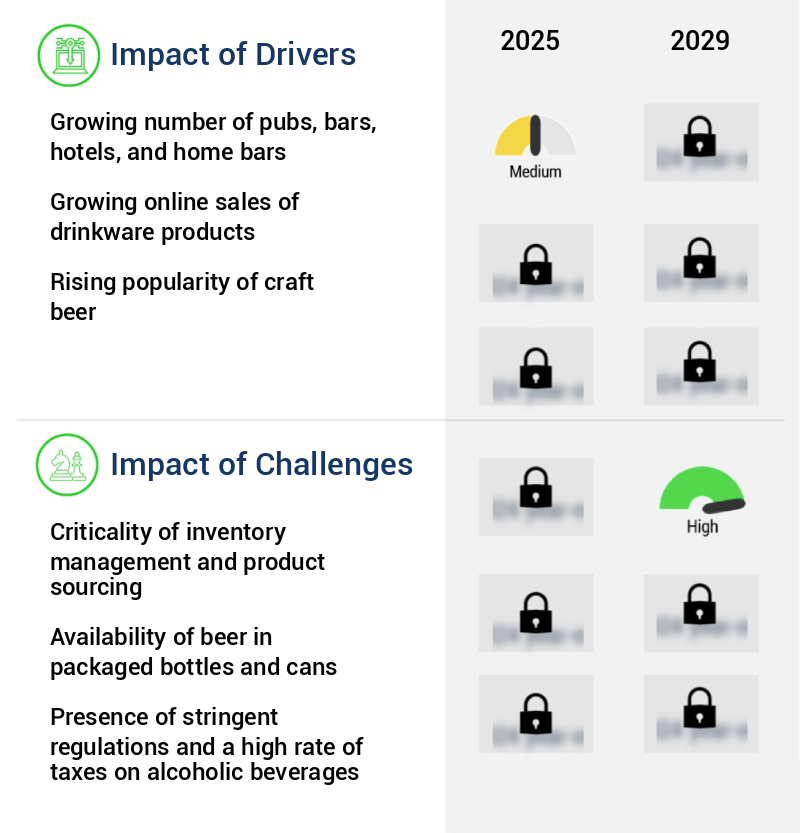
What are the key market drivers leading to the rise in the adoption of Beer Mug Industry?
- The proliferation of pubs, bars, hotels, and home bars serves as the primary catalyst for market growth.
- The market is experiencing significant growth due to the increasing number of bars, pubs, and hotels worldwide. This trend is fueled by various factors, including demographics, urbanization, and lifestyle changes. According to the United Nations (UN), approximately 68% of the global population is projected to reside in urban areas by 2050. This demographic shift, coupled with the rise of a substantial white-collar workforce, has led to an increase in the establishment of pubs, bars, liquor-serving cafes, and lounges.
- The market benefits from this trend as these establishments are major consumers of beer mugs. The market's expansion is further boosted by the growing popularity of socializing at these venues.
What are the market trends shaping the Beer Mug Industry?
- The personalization of drinkware has emerged as the latest market trend for gifting purposes. Make every gift unique and thoughtful by adding a personal touch to drinkware items.
- The global market for personalized beer mugs has witnessed significant growth due to the cultural tradition of gifting drinkware for special occasions. This trend is particularly prominent in Western Europe and North America. Consumers seek unique, customized mugs for gifting purposes and as self-presents. Businesses have responded by integrating in-house laser engraving technology, enabling buyers to personalize their messages. This expansion of features adds value to standard gifts, allowing consumers to choose from various materials and fonts.
- The versatility of personalized beer mugs extends to promotional events and various other occasions, making them an essential item for companies. The market's evolution underscores the growing importance of customization and personalization in consumer goods.
What challenges does the Beer Mug Industry face during its growth?
- The effective management of inventory and product sourcing is a crucial challenge that significantly impacts industry growth. This complex process requires careful planning, efficient execution, and continuous optimization to ensure that businesses can meet customer demand while minimizing costs and maximizing profitability. Successfully navigating this challenge hinges on leveraging advanced technologies, building strong supplier relationships, and maintaining a deep understanding of market trends and consumer behavior.
- The market has undergone significant transformations in response to shifting consumer shopping trends. With increasing consumer preference diversity, inventory turnover demands have escalated, necessitating swift adjustments from beer mug suppliers and manufacturers. This shift results in heightened costs related to raw materials, quality control, transportation, and labor. In response to rising energy prices and escalating manufacturing costs in China, companies are exploring more productive and cost-effective production sites.
- The global beer mug industry's evolving landscape underscores the importance of efficient inventory management, enabling businesses to cater to the dynamic consumer market while minimizing costs.
Exclusive Technavio Analysis on Customer Landscape
The beer mug market forecasting report includes the adoption lifecycle of the market, covering from the innovator’s stage to the laggard’s stage. It focuses on adoption rates in different regions based on penetration. Furthermore, the beer mug market report also includes key purchase criteria and drivers of price sensitivity to help companies evaluate and develop their market growth analysis strategies.
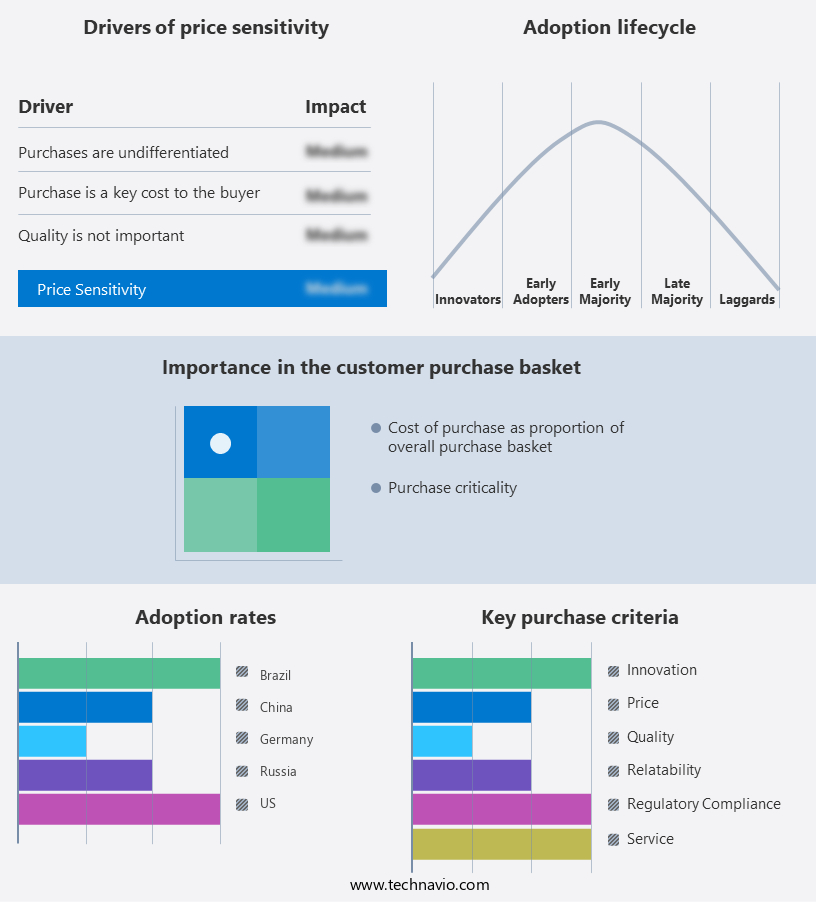
Customer Landscape of Beer Mug Industry
Competitive Landscape
Companies are implementing various strategies, such as strategic alliances, beer mug market forecast, partnerships, mergers and acquisitions, geographical expansion, and product/service launches, to enhance their presence in the industry.
Arc Holdings - The company specializes in manufacturing and distributing a diverse range of beer mugs under renowned brands including Luminarc, Arcoroc, and Chef and Sommelier.
The industry research and growth report includes detailed analyses of the competitive landscape of the market and information about key companies, including:
- Arc Holdings
- ARTon Products
- bayerische glaswerke gmbh
- Bormioli Rocco Spa
- Borosil Ltd.
- Cello World Pvt. Ltd.
- Femora India Pvt. Ltd.
- Guangdong Garbo Industrial Co. Ltd.
- Hamilton Housewares Pvt. Ltd.
- Libbey Inc.
- Lowes Co. Inc.
- Ngwenya Glass Swaziland
- Ocean Glass Public Co. Ltd.
- Pepperfry Pvt. Ltd.
- S Tirupati Balaji Glass Industries
- Stoelzle Oberglas GmbH
- TURKIYE SISE VE CAM FABRIKALARI A.S.
- Williams Sonoma Inc.
- Zenan Glass
Qualitative and quantitative analysis of companies has been conducted to help clients understand the wider business environment as well as the strengths and weaknesses of key industry players. Data is qualitatively analyzed to categorize companies as pure play, category-focused, industry-focused, and diversified; it is quantitatively analyzed to categorize companies as dominant, leading, strong, tentative, and weak.
Recent Development and News in Beer Mug Market
- In January 2024, Anheuser-Busch InBev, the world's largest brewer, announced the launch of its new line of eco-friendly beer mugs made from 100% recycled materials (Anheuser-Busch InBev press release). This initiative aimed to reduce the company's carbon footprint and promote sustainability in the beer industry.
- In March 2024, Diageo, a leading global beverage company, entered into a strategic partnership with Olive & Oak, a US-based designer and manufacturer of custom beer mugs, to create limited-edition, branded mugs for Diageo's popular beer brands (Diageo press release). This collaboration allowed Diageo to expand its product offerings and enhance its brand presence in the market.
- In May 2024, Heineken, the Dutch brewing company, completed the acquisition of a majority stake in the Brazilian craft beer company, Cervejaria Colorado, for an undisclosed amount (Heineken press release). This acquisition marked Heineken's entry into the growing Brazilian craft beer market and strengthened its position as a global player.
- In April 2025, the European Union passed new regulations requiring all beer mugs and glasses sold in the EU to meet specific safety and environmental standards, including a ban on lead crystal and a requirement for a minimum recycled content of 25% (European Commission press release). This policy change aimed to protect consumer health and reduce waste in the industry.
Dive into Technavio’s robust research methodology, blending expert interviews, extensive data synthesis, and validated models for unparalleled Beer Mug Market insights. See full methodology.
|
Market Scope |
|
|
Report Coverage |
Details |
|
Page number |
214 |
|
Base year |
2024 |
|
Historic period |
2019-2023 |
|
Forecast period |
2025-2029 |
|
Growth momentum & CAGR |
Accelerate at a CAGR of 3.4% |
|
Market growth 2025-2029 |
USD 18.19 thousand |
|
Market structure |
Fragmented |
|
YoY growth 2024-2025(%) |
2.9 |
|
Key countries |
US, China, Germany, India, UK, Japan, Canada, France, Italy, and Brazil |
|
Competitive landscape |
Leading Companies, Market Positioning of Companies, Competitive Strategies, and Industry Risks |
Research Analyst Overview
- The market continues to evolve, with material sourcing practices and manufacturing techniques shaping its dynamics. For instance, the durability of earthenware mugs is enhanced through the enamel coating process, while low-fired ceramic mugs offer cost advantages. Defect rate reduction is a key focus in the industry, with packaging material selection and energy consumption analysis essential for efficient production lines. High-fired ceramic mugs boast improved thermal shock resistance and longer shelf life, while porcelain mugs boast elegant aesthetics. One example of market innovation is the development of microwave-safe mugs, which saw a 15% increase in sales last year.
- Industry growth is expected to continue, with a projected 5% annual expansion. Kiln firing techniques, ceramic glaze composition, and mug capacity measurement are among the ongoing areas of research and development. Hand-painted ceramic mugs and stoneware mugs cater to niche markets, with their unique properties appealing to consumers. Impact resistance testing, mug weight optimization, and handle attachment methods are crucial considerations in the design process. Distribution network design, chemical resistance testing, and dishwasher safety are essential for customer satisfaction and market penetration. Waste reduction strategies and water usage optimization are increasingly important in the market, reflecting broader sustainability trends.
- Quality control procedures and decal application methods ensure consistent product standards, while screen printing mugs offer customization opportunities. Overall, the market remains a dynamic and evolving landscape, with continuous innovation and adaptation to consumer preferences and market demands.
What are the Key Data Covered in this Beer Mug Market Research and Growth Report?
-
What is the expected growth of the Beer Mug Market between 2025 and 2029?
-
USD 18.19 th, at a CAGR of 3.4%
-
-
What segmentation does the market report cover?
-
The report is segmented by Application (Commercial and Household), Distribution Channel (Supermarkets and hypermarkets, Convenience stores, and Online), Product Type (Glass, Ceramic, Stainless steel, Wood, and Fiber), and Geography (APAC, Europe, North America, South America, and Middle East and Africa)
-
-
Which regions are analyzed in the report?
-
APAC, Europe, North America, South America, and Middle East and Africa
-
-
What are the key growth drivers and market challenges?
-
Growing number of pubs, bars, hotels, and home bars, Criticality of inventory management and product sourcing
-
-
Who are the major players in the Beer Mug Market?
-
Arc Holdings, ARTon Products, bayerische glaswerke gmbh, Bormioli Rocco Spa, Borosil Ltd., Cello World Pvt. Ltd., Femora India Pvt. Ltd., Guangdong Garbo Industrial Co. Ltd., Hamilton Housewares Pvt. Ltd., Libbey Inc., Lowes Co. Inc., Ngwenya Glass Swaziland, Ocean Glass Public Co. Ltd., Pepperfry Pvt. Ltd., S Tirupati Balaji Glass Industries, Stoelzle Oberglas GmbH, TURKIYE SISE VE CAM FABRIKALARI A.S., Williams Sonoma Inc., and Zenan Glass
-
Market Research Insights
- The market is a dynamic and ever-evolving industry, characterized by continuous innovation and growth. According to industry reports, the global market for beer mugs is projected to expand at a steady rate, with an anticipated growth of around 3% annually. One notable trend in the market is the increasing demand for eco-friendly and sustainable production methods. For instance, a leading manufacturer reported a sales increase of over 15% in their line of recycled glass beer mugs.
- Additionally, manufacturers are focusing on optimizing their production cycles and improving product durability to meet evolving consumer preferences. These efforts are expected to drive the market forward, as the demand for high-quality, sustainable, and functional beer mugs continues to grow.
We can help! Our analysts can customize this beer mug market research report to meet your requirements.
 RIA -
RIA - 
