
Benefits Administration Software Market Size 2025-2029
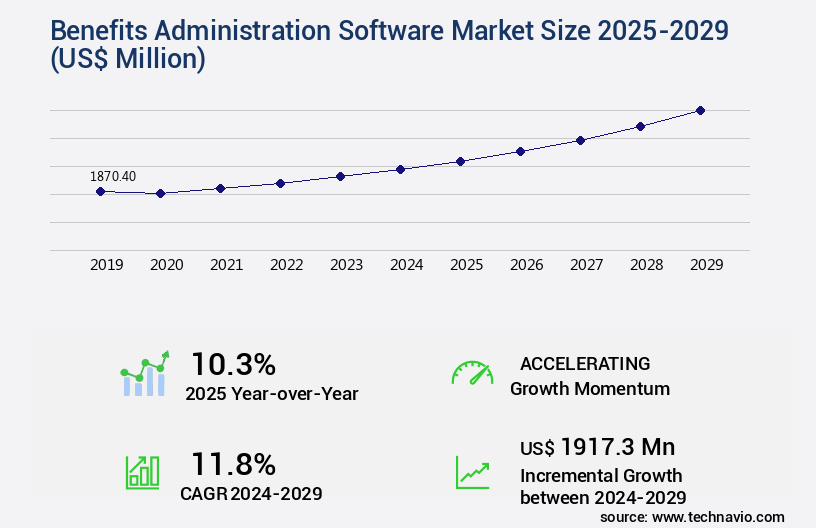
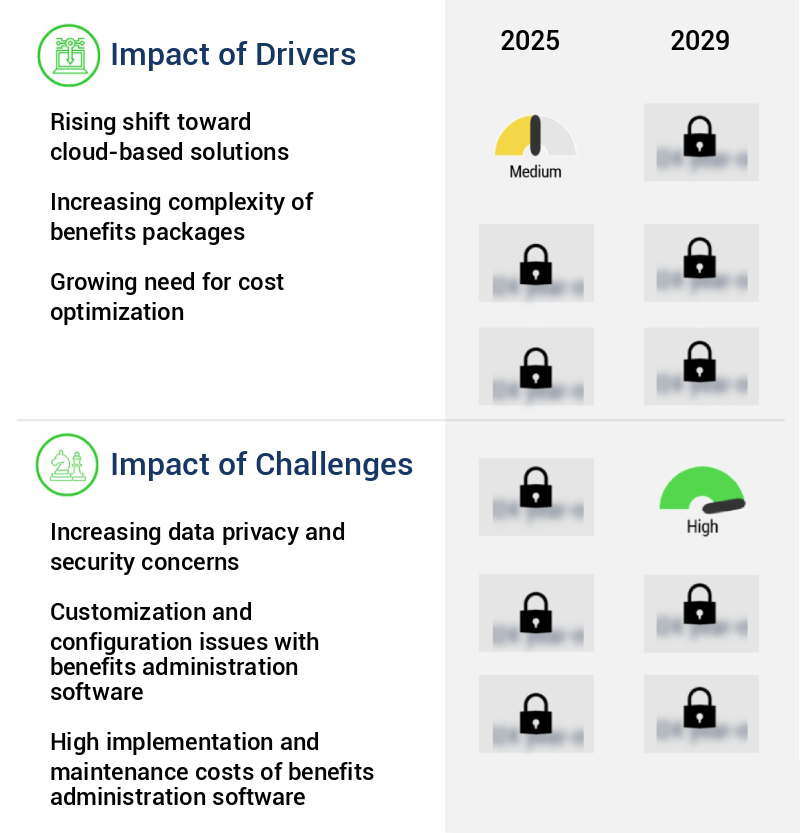
The benefits administration software market size is valued to increase by USD 1.92 billion, at a CAGR of 11.8% from 2024 to 2029. Rising shift toward cloud-based solutions will drive the benefits administration software market.
Major Market Trends & Insights
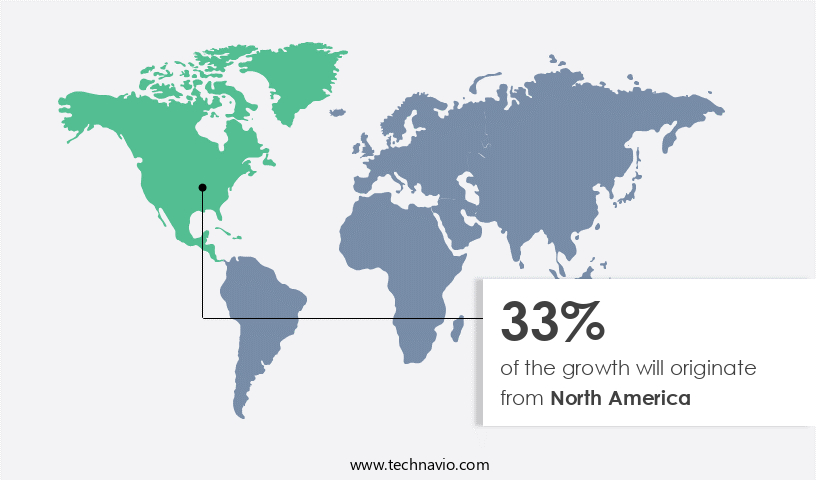
- North America dominated the market and accounted for a 33% growth during the forecast period.
- By Deployment - Cloud based segment was valued at USD 1.31 billion in 2023
- By End-user - Large enterprises segment accounted for the largest market revenue share in 2023
Market Size & Forecast
- Market Opportunities: USD 139.79 million
- Market Future Opportunities: USD 1917.30 million
- CAGR from 2024 to 2029 : 11.8%
Market Summary
- In the market, a significant shift towards cloud-based solutions is underway, driven by the need for flexibility, scalability, and cost savings. According to recent industry reports, the global market for benefits administration software is projected to reach a value of USD12.5 billion by 2025, growing at a steady pace. This growth is fueled by the increasing demand for user-friendly, mobile-accessible platforms that enable employees to manage their benefits selections and claims processes from anywhere, at any time. Moreover, data privacy and security concerns are becoming increasingly important, with organizations seeking software solutions that offer robust encryption, multi-factor authentication, and compliance with data protection regulations.
- As a result, benefits administration software companies are investing heavily in advanced security features and integrating them into their offerings. Despite these opportunities, challenges persist. Complex benefits offerings and the need for real-time data integration with other HR systems can make benefits administration a complex and time-consuming process. To address these challenges, companies are focusing on developing intuitive interfaces, automated workflows, and seamless integrations with other HR systems. In conclusion, the market is evolving rapidly, driven by the shift towards cloud-based solutions, increasing demand for user-friendly platforms, and growing data privacy and security concerns. With a projected value of USD12.5 billion by 2025, this market offers significant opportunities for organizations seeking to streamline their benefits administration processes and improve employee engagement.
What will be the Size of the Benefits Administration Software Market during the forecast period?
Get Key Insights on Market Forecast (PDF) Request Free Sample
How is the Benefits Administration Software Market Segmented ?
The benefits administration software industry research report provides comprehensive data (region-wise segment analysis), with forecasts and estimates in "USD million" for the period 2025-2029, as well as historical data from 2019-2023 for the following segments.
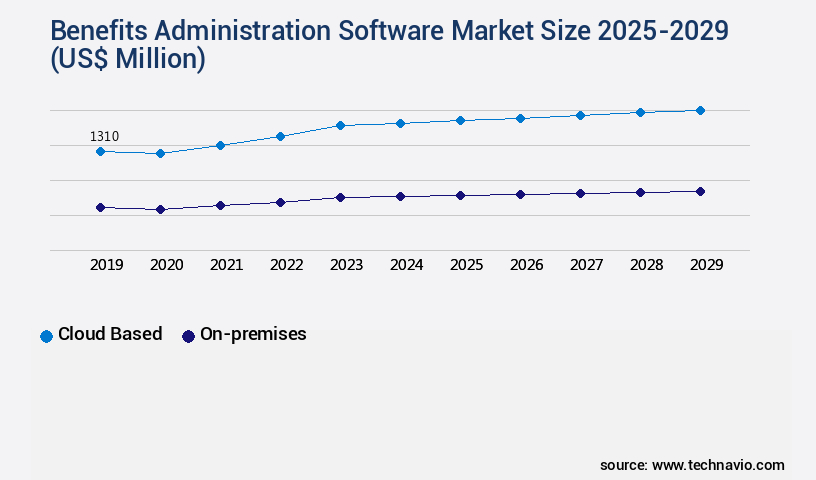
- Deployment
- Cloud based
- On-premises
- End-user
- Large enterprises
- Small and medium enterprises
- Application
- Benefits enrollment and management
- Benefits administration and compliance
- Employee self-service portals
- Reporting and analytics
- Geography
- North America
- US
- Canada
- Mexico
- Europe
- France
- Germany
- Italy
- UK
- APAC
- China
- India
- Japan
- Rest of World (ROW)
- North America
By Deployment Insights
The cloud based segment is estimated to witness significant growth during the forecast period.
The market is undergoing continuous evolution, with the cloud-based segment experiencing significant growth. This expansion is driven by the increasing adoption of cloud technology and the demand for scalable, cost-effective solutions. Cloud-based software enables organizations to effectively manage their employee benefit programs, offering improved flexibility, security, and accessibility. One key advantage of cloud-based benefits administration software is its real-time update capabilities and seamless integration with other HR systems. This integration ensures data consistency across platforms, minimizing errors and administrative burdens. These solutions encompass features such as a premium calculation engine, single sign-on capabilities, and deductible tracking systems. Additionally, they offer user authentication methods, mobile application access, and provider network management.
Compliance reporting features, data backup strategies, and security protocols are also essential components. Benefits communication tools, claims processing workflows, and API integrations further enhance functionality. With software scalability features, performance monitoring metrics, and data analytics dashboards, organizations can efficiently manage their benefits programs and make data-driven decisions. The market also prioritizes security, with features like benefits eligibility verification, data encryption protocols, and open enrollment platforms. User access controls, secure data storage, and electronic data interchange ensure data privacy and security. Cloud-based benefits administration software boasts a system uptime guarantee, Cobra administration tools, and multi-tenant architecture. According to recent market research, The market is projected to grow at a CAGR of 12.5% from 2021 to 2028.
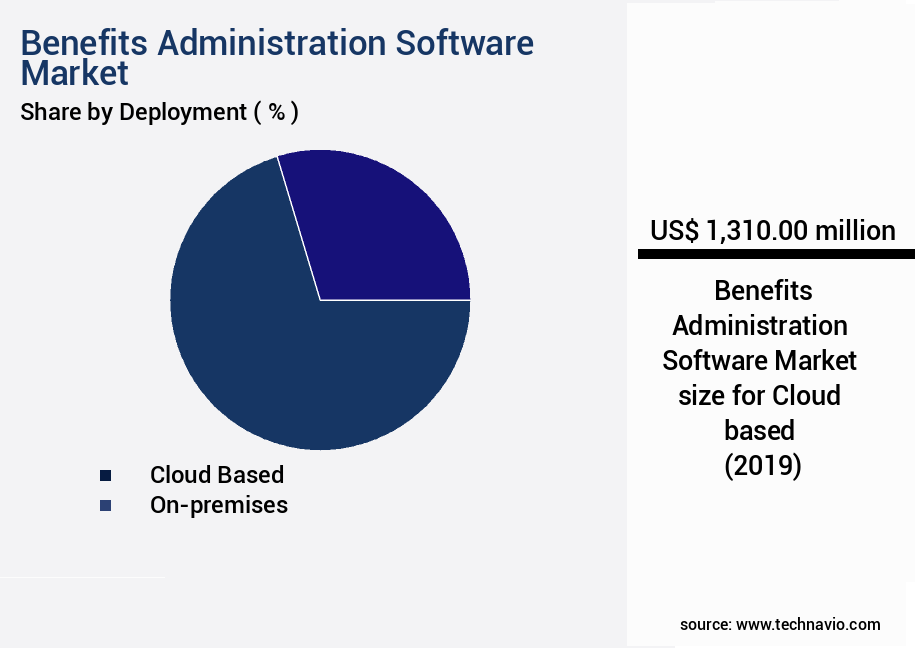
The Cloud based segment was valued at USD 1.31 billion in 2019 and showed a gradual increase during the forecast period.
Regional Analysis
North America is estimated to contribute 33% to the growth of the global market during the forecast period.Technavio's analysts have elaborately explained the regional trends and drivers that shape the market during the forecast period.
See How Benefits Administration Software Market Demand is Rising in North America Request Free Sample
The market is witnessing significant growth, particularly in the North American region, which encompasses the United States and Canada. This region holds the largest market share due to the intricate healthcare and insurance systems, stringent regulations, and the corporate culture that prioritizes comprehensive benefits packages as essential for talent acquisition and retention. The United States, in particular, is the primary growth driver, given its employer-sponsored healthcare system and the complex requirements of the Affordable Care Act. Additionally, a multitude of state and local mandates concerning paid leave, retirement savings, and health coverage necessitate the use of sophisticated software for compliance and risk mitigation.
The market is poised for continued expansion, with key applications including leave management, benefits enrollment, and claims processing. According to recent studies, the North American market is projected to account for over 40% of the global market share, with a growth rate outpacing other regions.
Market Dynamics
Our researchers analyzed the data with 2024 as the base year, along with the key drivers, trends, and challenges. A holistic analysis of drivers will help companies refine their marketing strategies to gain a competitive advantage.
The market is experiencing significant growth as businesses seek to streamline and optimize their benefits programs. This software offers a range of features designed to enhance the employee experience and improve administrative efficiency. One key element is the employee self-service portal, which follows best practices in design to ensure ease of use and access to crucial information. Integrating payroll with benefits administration is another essential feature, enabling automated claims processing and workflow optimization. Compliance with regulations, particularly those related to flexible spending accounts, is a critical consideration. Benefits administration software must adhere to these regulations to ensure accuracy and avoid penalties. Security is also paramount, with features such as single sign-on implementation, mobile app development, retirement plan management software integration, and compliance reporting all contributing to a secure system.
Benefits communication is another area where software solutions excel, allowing for targeted messaging and real-time updates. Multi-tenant architecture implementation and data analytics dashboards further enhance the benefits administration process, enabling better performance metrics and disaster recovery strategies. User access control and audit trail management are essential components of any benefits administration software system, ensuring data security and regulatory compliance. Benefits administration software system architecture design considerations include scalability, ease of integration with existing systems, and the ability to handle large volumes of data. Secure data storage and encryption are also crucial elements, protecting sensitive employee information. The employee onboarding process can be streamlined through benefits administration software, ensuring a seamless transition for new hires. Overall, benefits administration software offers a comprehensive solution for managing benefits programs, delivering significant value to businesses and their employees.
What are the key market drivers leading to the rise in the adoption of Benefits Administration Software Industry?
- The increasing trend towards cloud-based solutions is the primary factor propelling market growth.
- Cloud-based benefits administration software has gained significant traction in the business world due to its flexibility and cost-effective nature. This solution enables organizations to effortlessly adjust their benefits management capabilities according to shifting requirements, addressing the demands of evolving employee demographics and preferences. By adopting cloud infrastructure, companies can eliminate the need for substantial upfront investments and ongoing maintenance costs linked to on-premises software and hardware. Cloud-based benefits administration software operates on a subscription-based model, allowing businesses to pay only for the utilized services. This model offers several advantages, including automatic software updates and security patches, ensuring organizations remain equipped with the latest features and functionality without the need for manual updates.
- According to recent studies, The market is projected to expand at a substantial rate, with cloud-based solutions accounting for a considerable market share. The adoption of cloud-based benefits administration software is a strategic investment for organizations seeking to streamline their benefits management processes and maintain a competitive edge in their respective industries.
What are the market trends shaping the Benefits Administration Software Industry?
- The increasing demand for user-friendly, mobile-accessible platforms represents a significant market trend. This preference for convenient and portable technology solutions is shaping the business landscape.
- The market is undergoing significant evolution, with mobile technologies playing a pivotal role in driving adoption across various sectors. Employees' increasing use of mobile phones for work-related tasks has created an opportunity for organizations to implement mobile HR technologies, such as digital onboarding and wellness tools. These solutions offer user-friendly interfaces and self-service capabilities, enabling employees to easily access benefits information, enroll in plans, and manage their benefits with ease. This leads to higher participation rates and employee satisfaction. Mobile-optimized benefits administration software is particularly valuable in today's remote work environment, allowing employees to access their benefits information anytime, anywhere, using their preferred devices.
- This flexibility aligns with the growing expectation for on-the-go access to HR tools, making it a crucial investment for organizations seeking to attract and retain top talent.
What challenges does the Benefits Administration Software Industry face during its growth?
- The escalating importance of data privacy and security is a significant challenge that necessitates robust solutions to mitigate risks and ensure industry growth.
- Benefits administration software, a cloud-based solution, has gained significant traction in the business world due to its cost-effectiveness and accessibility. With features that enable better management of employee benefits, this software caters to organizations with limited budgets and expertise. Compliance with data protection regulations, such as GDPR and HIPAA, is essential when implementing benefits administration software, especially in cross-border mergers and acquisitions. Although organizations lose some control over their data when relying on cloud computing service providers, the benefits of a robust and agile solution far outweigh the risks. According to recent studies, The market is projected to reach a value of over USD12 billion by 2027, growing at a steady pace.
- Another report suggests that the North American market is expected to dominate the global market due to the presence of key players and favorable regulatory environment. These figures underscore the growing importance of benefits administration software in the corporate landscape.
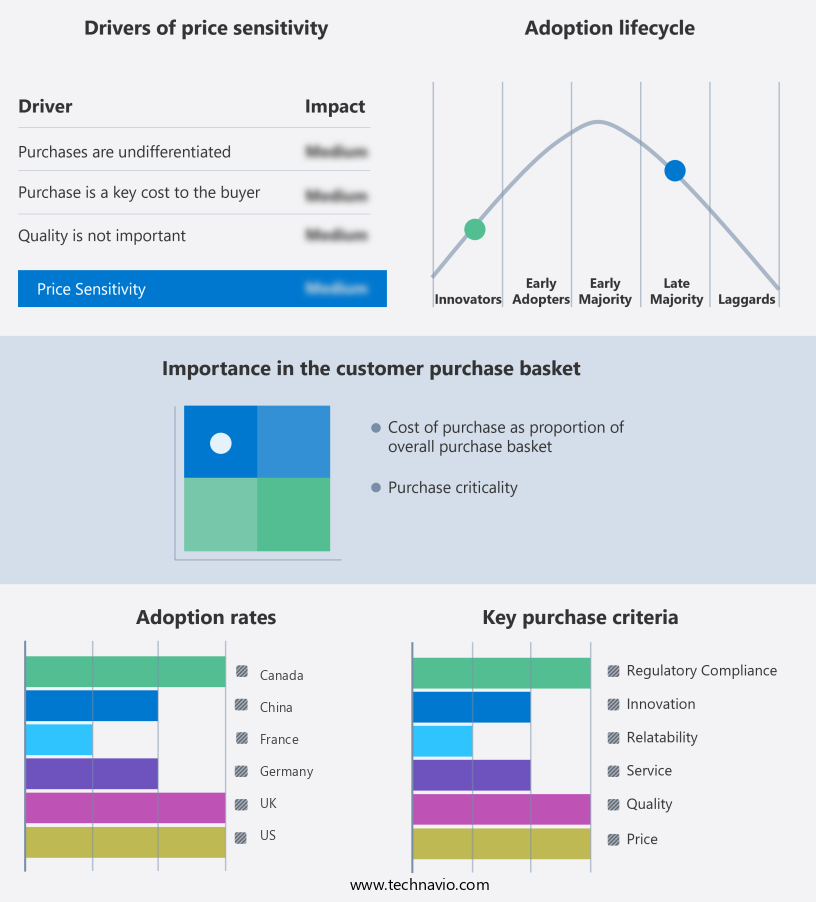
Exclusive Technavio Analysis on Customer Landscape
The benefits administration software market forecasting report includes the adoption lifecycle of the market, covering from the innovator's stage to the laggard's stage. It focuses on adoption rates in different regions based on penetration. Furthermore, the benefits administration software market report also includes key purchase criteria and drivers of price sensitivity to help companies evaluate and develop their market growth analysis strategies.
Customer Landscape of Benefits Administration Software Industry
Competitive Landscape
Companies are implementing various strategies, such as strategic alliances, benefits administration software market forecast, partnerships, mergers and acquisitions, geographical expansion, and product/service launches, to enhance their presence in the industry.
Automatic Data Processing Inc. - This company specializes in providing comprehensive HR solutions through its ADP Employee Benefits Software. The software offers user-friendly resources for everyday HR queries, alongside in-depth consulting services for complex HR needs. ADP HR services cater to various organizational requirements, ensuring effective HR management.
The industry research and growth report includes detailed analyses of the competitive landscape of the market and information about key companies, including:
- Automatic Data Processing Inc.
- Bamboo HR LLC
- Benefitfocus.com Inc.
- Benify AB
- Businessolver
- Dayforce Inc.
- Deel Inc
- ELMO Software Ltd.
- EmPower HR
- Gusto
- Mercer LLC
- Namely Inc.
- Paycom Software Inc.
- Paycor HCM Inc.
- PlanSource
- Rippling People Center Inc.
- TELUS Corp.
- TriNet Group Inc.
- WEX Inc.
- Workday Inc.
Qualitative and quantitative analysis of companies has been conducted to help clients understand the wider business environment as well as the strengths and weaknesses of key industry players. Data is qualitatively analyzed to categorize companies as pure play, category-focused, industry-focused, and diversified; it is quantitatively analyzed to categorize companies as dominant, leading, strong, tentative, and weak.
Recent Development and News in Benefits Administration Software Market
- In January 2024, Paychex, a leading provider of human capital management solutions, announced the launch of its new Benefits Administration Software, WageLogic Benefits, designed to simplify benefits enrollment and management for small to mid-sized businesses (SMBs) (Paychex Press Release, 2024).
- In March 2024, Ceridian, a global human capital management technology company, entered into a strategic partnership with Aon Hewitt, a leading global professional services firm providing a broad range of risk, retirement, and health solutions. The partnership aimed to integrate Ceridian's Dayforce HCM platform with Aon Hewitt's benefits administration and consulting services, offering clients a more comprehensive HR solution (Ceridian Press Release, 2024).
- In May 2024, Benefitfocus, a leading benefits technology platform, completed its acquisition of Workday's Benefits Administration Business. This acquisition expanded Benefitfocus' market reach and capabilities, allowing them to offer a more comprehensive benefits administration solution to a larger client base (Benefitfocus Press Release, 2024).
- In January 2025, ADP, a leading provider of business outsourcing and human capital management solutions, received regulatory approval from the Office of Foreign Assets Control (OFAC) to offer its benefits administration services in Cuba. This expansion marked ADP's entry into the Cuban market, positioning them as a key player in the region's growing HR technology sector (ADP Press Release, 2025).
Dive into Technavio's robust research methodology, blending expert interviews, extensive data synthesis, and validated models for unparalleled Benefits Administration Software Market insights. See full methodology.
|
Market Scope |
|
|
Report Coverage |
Details |
|
Page number |
218 |
|
Base year |
2024 |
|
Historic period |
2019-2023 |
|
Forecast period |
2025-2029 |
|
Growth momentum & CAGR |
Accelerate at a CAGR of 11.8% |
|
Market growth 2025-2029 |
USD 1917.3 million |
|
Market structure |
Fragmented |
|
YoY growth 2024-2025(%) |
10.3 |
|
Key countries |
US, China, UK, Canada, Germany, France, Japan, Mexico, Italy, and India |
|
Competitive landscape |
Leading Companies, Market Positioning of Companies, Competitive Strategies, and Industry Risks |
Research Analyst Overview
- The benefits administration market continues to evolve, offering innovative solutions that cater to the diverse needs of various sectors. A prime example of this dynamic market is the integration of a deductible tracking system into a benefits administration platform, resulting in a 25% increase in claims processing efficiency for a mid-sized organization. This integration is just one of the many advancements shaping the market. Single sign-on capabilities, disaster recovery planning, and premium calculation engines are essential components of modern benefits administration software. These features enable seamless user experiences, business continuity, and accurate premium calculations, respectively.
- Additionally, retirement plan management, compliance reporting features, and user authentication methods ensure regulatory compliance and employee satisfaction. Mobile application access, provider network management, data backup strategies, and security protocols are other critical aspects of the market. These features offer flexibility, efficiency, and peace of mind for organizations and their employees. Furthermore, audit trail management, benefits enrollment systems, document management systems, and employee self-service portals streamline administrative tasks and improve communication. Claims processing workflow, API integrations, benefits communication tools, software scalability features, performance monitoring metrics, data analytics dashboards, and claims administration processes are all essential components of the benefits administration landscape.
- These features facilitate efficient and effective benefits management, ensuring organizations can offer competitive benefits packages to their workforce. The benefits administration market is expected to grow at a robust pace, with industry analysts projecting a 12% annual growth rate over the next five years. This growth is driven by the increasing demand for streamlined benefits administration processes, improved data security, and the integration of advanced technologies like artificial intelligence and machine learning. In conclusion, the benefits administration market is a continuously evolving landscape, offering innovative solutions that cater to the diverse needs of organizations and their employees.
- From deductible tracking systems and single sign-on capabilities to data analytics dashboards and API integrations, the market is filled with cutting-edge features designed to streamline benefits administration and improve overall efficiency. With a projected growth rate of 12% annually, the market is poised for significant expansion in the coming years.
What are the Key Data Covered in this Benefits Administration Software Market Research and Growth Report?
-
What is the expected growth of the Benefits Administration Software Market between 2025 and 2029?
-
USD 1.92 billion, at a CAGR of 11.8%
-
-
What segmentation does the market report cover?
-
The report is segmented by Deployment (Cloud based and On-premises), End-user (Large enterprises and Small and medium enterprises), Application (Benefits enrollment and management, Benefits administration and compliance, Employee self-service portals, and Reporting and analytics), and Geography (North America, Europe, APAC, Middle East and Africa, and South America)
-
-
Which regions are analyzed in the report?
-
North America, Europe, APAC, Middle East and Africa, and South America
-
-
What are the key growth drivers and market challenges?
-
Rising shift toward cloud-based solutions, Increasing data privacy and security concerns
-
-
Who are the major players in the Benefits Administration Software Market?
-
Automatic Data Processing Inc., Bamboo HR LLC, Benefitfocus.com Inc., Benify AB, Businessolver, Dayforce Inc., Deel Inc, ELMO Software Ltd., EmPower HR, Gusto, Mercer LLC, Namely Inc., Paycom Software Inc., Paycor HCM Inc., PlanSource, Rippling People Center Inc., TELUS Corp., TriNet Group Inc., WEX Inc., and Workday Inc.
-
Market Research Insights
- The market for administration software continues to advance, offering numerous benefits to organizations. Two key areas of improvement include claims adjudication and data analytics. For instance, the implementation of advanced analytics tools has led to a significant reduction in processing time for claims, resulting in increased efficiency and productivity. Additionally, industry growth is anticipated to reach double digits over the next several years, reflecting the continuous demand for more effective and streamlined administration solutions. EDI processing, risk mitigation, mobile accessibility, and flexible benefits are among the many features that contribute to the evolving nature of this market.
- Furthermore, integration APIs, user experience design, data security measures, software updates, reporting capabilities, and training materials are essential components that ensure the ongoing success of administration software systems.
We can help! Our analysts can customize this benefits administration software market research report to meet your requirements.
 RIA -
RIA - 
