Bio Plasticizer Market Analysis, Size, and Forecast 2026-2030: North America (US, Canada, and Mexico), Europe (Germany, UK, and France), APAC (China, Japan, and India), South America (Brazil and Argentina), Middle East and Africa (Saudi Arabia, UAE, and South Africa), and Rest of World (ROW)

Bio Plasticizer Market Analysis, Size, and Forecast 2026-2030:
North America (US, Canada, and Mexico), Europe (Germany, UK, and France), APAC (China, Japan, and India), South America (Brazil and Argentina), Middle East and Africa (Saudi Arabia, UAE, and South Africa), and Rest of World (ROW)

Published: Dec 2025 308 Pages SKU: IRTNTR80096

Market Overview at a Glance

$902 Mn
Market Opportunity
6.2%
CAGR 2025 - 2030
39.3%
North America Growth
$903.2 Mn
ESBO segment 2024

Bio Plasticizer Market Size 2026-2030

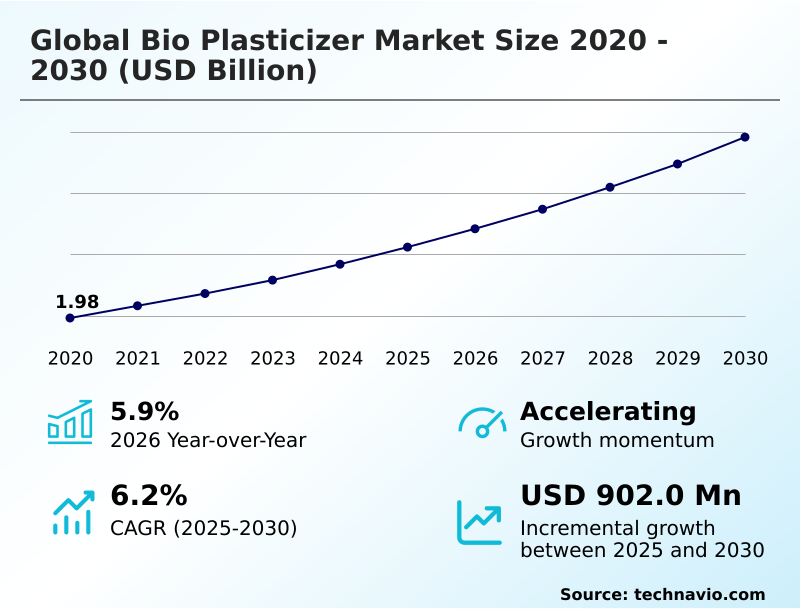
The bio plasticizer market size is valued to increase by USD 902 million, at a CAGR of 6.2% from 2025 to 2030. Rise in number of applications of bio plasticizers across different industries will drive the bio plasticizer market.

Major Market Trends & Insights

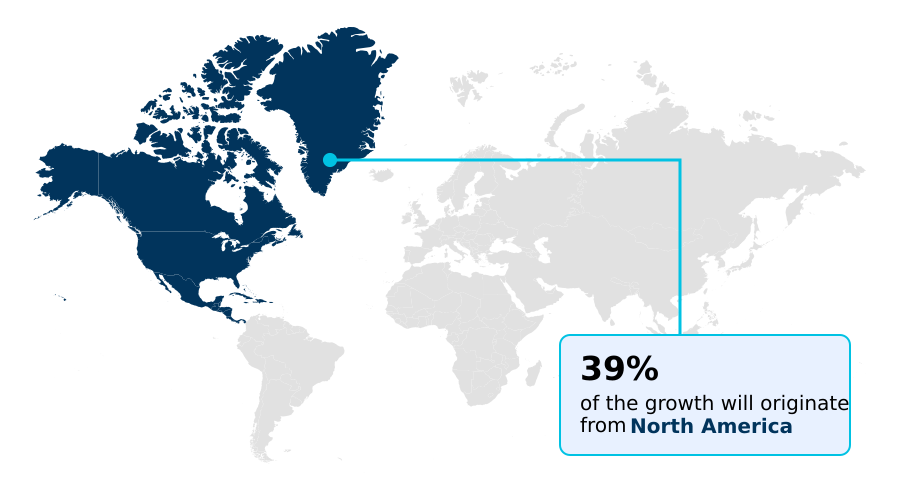
  • North America dominated the market and accounted for a 39.3% growth during the forecast period.
  • By Product - ESBO segment was valued at USD 903.2 million in 2024
  • By Application - Packaging materials segment accounted for the largest market revenue share in 2024

Market Size & Forecast

  • Market Opportunities: USD 1.48 billion
  • Market Future Opportunities: USD 902 million
  • CAGR from 2025 to 2030 : 6.2%

Market Summary

What will be the Size of the Bio Plasticizer Market during the forecast period?

Get Key Insights on Market Forecast (PDF) Request Free Sample

How is the Bio Plasticizer Market Segmented?

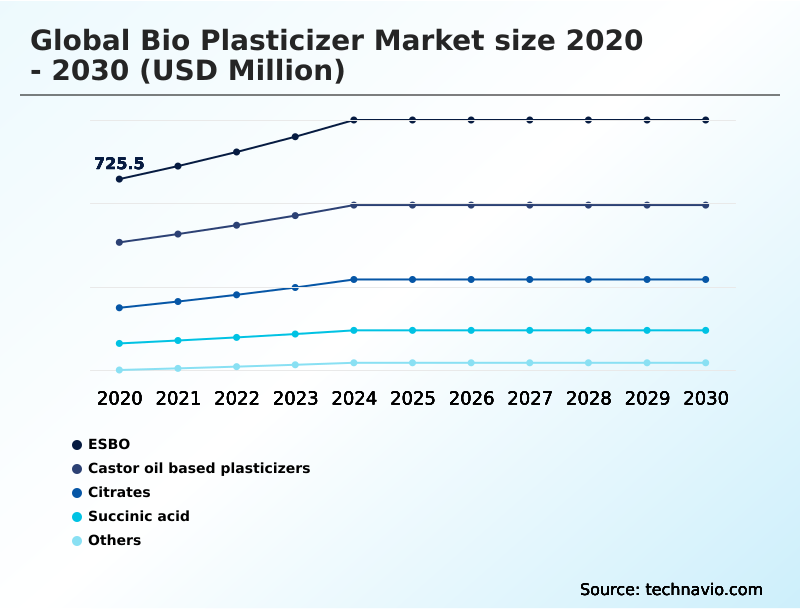
The bio plasticizer industry research report provides comprehensive data (region-wise segment analysis), with forecasts and estimates in "USD million" for the period 2026-2030, as well as historical data from 2020-2024 for the following segments.

  • Product
    • ESBO
    • Castor oil based plasticizers
    • Citrates
    • Succinic acid
    • Others
  • Application
    • Packaging materials
    • Automotive and transport
    • Consumer goods
    • Building and construction
    • Others
  • Source
    • Renewable resources
    • Synthetic sources
  • Geography
    • North America
      • US
      • Canada
      • Mexico
    • Europe
      • Germany
      • UK
      • France
    • APAC
      • China
      • Japan
      • India
    • South America
      • Brazil
      • Argentina
    • Middle East and Africa
      • Saudi Arabia
      • UAE
      • South Africa
    • Rest of World (ROW)

By Product Insights

The esbo segment is estimated to witness significant growth during the forecast period.

Request Free Sample

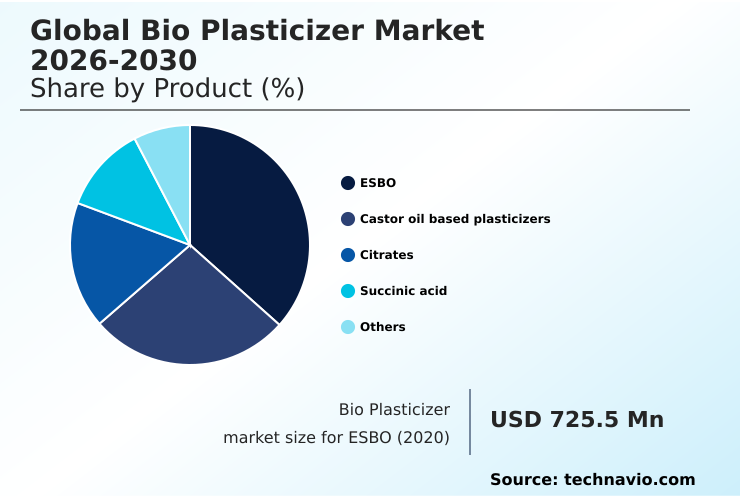
The ESBO segment was valued at USD 903.2 million in 2024 and showed a gradual increase during the forecast period.

Request Free Sample

Regional Analysis

North America is estimated to contribute 39.3% to the growth of the global market during the forecast period.Technavio’s analysts have elaborately explained the regional trends and drivers that shape the market during the forecast period.

See How Bio Plasticizer Market Demand is Rising in North America Request Free Sample

Market Dynamics

Our researchers analyzed the data with 2025 as the base year, along with the key drivers, trends, and challenges. A holistic analysis of drivers will help companies refine their marketing strategies to gain a competitive advantage.

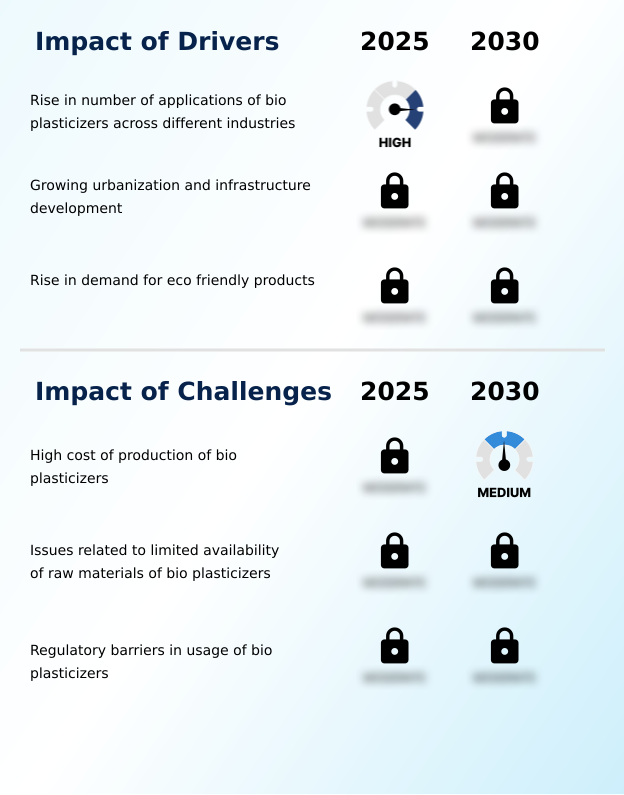
What are the key market drivers leading to the rise in the adoption of Bio Plasticizer Industry?

What are the market trends shaping the Bio Plasticizer Industry?

What challenges does the Bio Plasticizer Industry face during its growth?

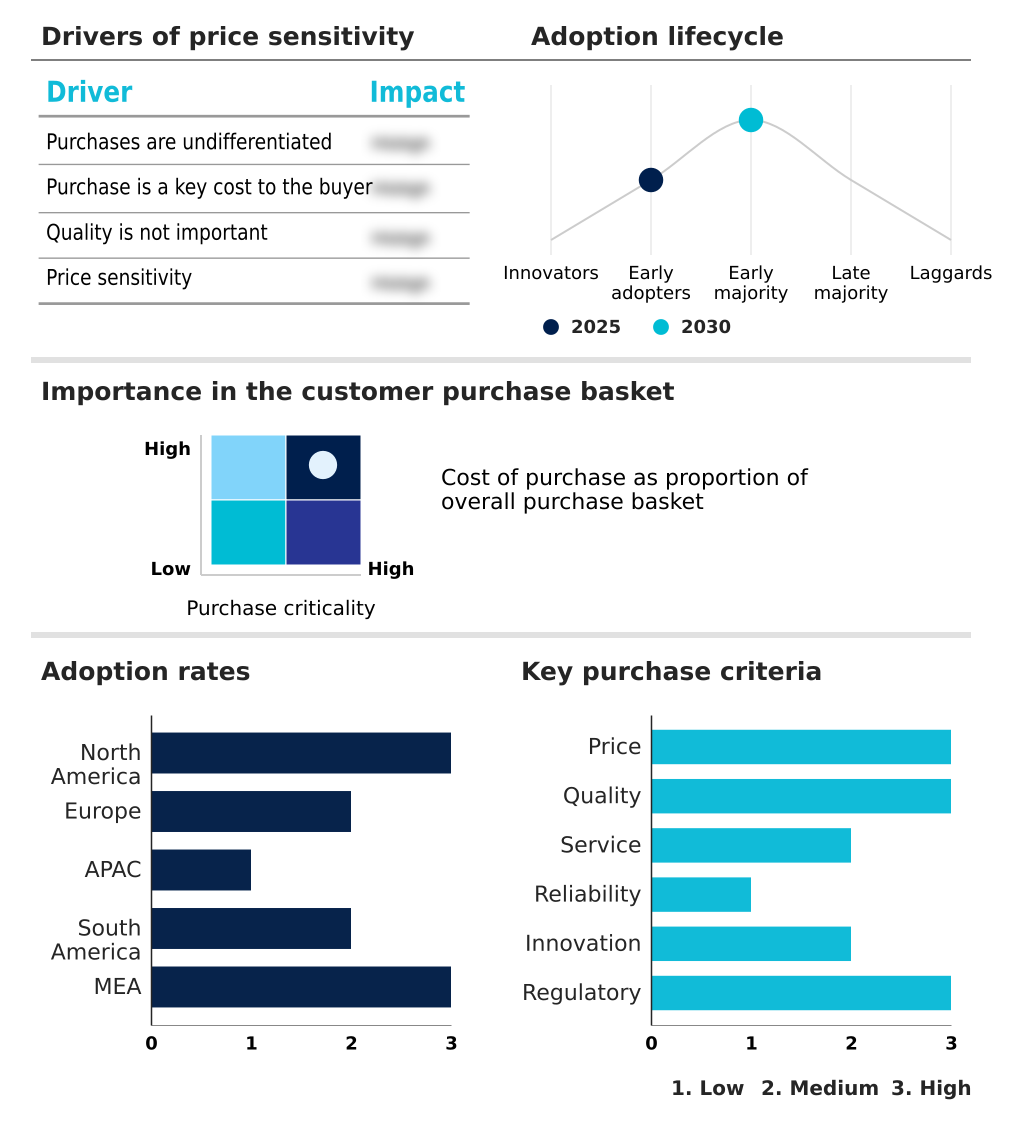
Exclusive Technavio Analysis on Customer Landscape

The bio plasticizer market forecasting report includes the adoption lifecycle of the market, covering from the innovator’s stage to the laggard’s stage. It focuses on adoption rates in different regions based on penetration. Furthermore, the bio plasticizer market report also includes key purchase criteria and drivers of price sensitivity to help companies evaluate and develop their market growth analysis strategies.

Customer Landscape of Bio Plasticizer Industry

Competitive Landscape

Companies are implementing various strategies, such as strategic alliances, bio plasticizer market forecast, partnerships, mergers and acquisitions, geographical expansion, and product/service launches, to enhance their presence in the industry.

ACS Technical Products -

The industry research and growth report includes detailed analyses of the competitive landscape of the market and information about key companies, including:

  • ACS Technical Products
  • Avient Corp.
  • BASF SE
  • Cargill Inc.
  • DIC Corp.
  • Dow Chemical Co.
  • Emery Oleochemicals
  • Evonik Industries AG
  • Goldstab Organics Pvt. Ltd.
  • Grupo Princz IPASA
  • Hebei Jingu Co. Ltd
  • India Glycols Ltd.
  • Jungbunzlauer Suisse AG
  • Lanxess AG
  • Matrica S.p.A
  • Roquette Freres SA
  • Solvay SA
  • Valtris Specialty Chemicals
  • Zhejiang Jiaao Enprotech Stock Co Ltd

Qualitative and quantitative analysis of companies has been conducted to help clients understand the wider business environment as well as the strengths and weaknesses of key industry players. Data is qualitatively analyzed to categorize companies as pure play, category-focused, industry-focused, and diversified; it is quantitatively analyzed to categorize companies as dominant, leading, strong, tentative, and weak.

Recent Development and News in Bio plasticizer market

Dive into Technavio’s robust research methodology, blending expert interviews, extensive data synthesis, and validated models for unparalleled Bio Plasticizer Market insights. See full methodology.

Market Scope
Page number 308
Base year 2025
Historic period 2020-2024
Forecast period 2026-2030
Growth momentum & CAGR Accelerate at a CAGR of 6.2%
Market growth 2026-2030 USD 902.0 million
Market structure Fragmented
YoY growth 2025-2026(%) 5.9%
Key countries US, Canada, Mexico, Germany, UK, France, Italy, The Netherlands, Spain, China, Japan, India, South Korea, Australia, Indonesia, Brazil, Argentina, Chile, Saudi Arabia, UAE, South Africa, Israel and Turkey
Competitive landscape Leading Companies, Market Positioning of Companies, Competitive Strategies, and Industry Risks

Request Free Sample

Research Analyst Overview

What are the Key Data Covered in this Bio Plasticizer Market Research and Growth Report?

  • What is the expected growth of the Bio Plasticizer Market between 2026 and 2030?

    • USD 902 million, at a CAGR of 6.2%

  • What segmentation does the market report cover?

    • The report is segmented by Product (ESBO, Castor oil based plasticizers, Citrates, Succinic acid, and Others), Application (Packaging materials, Automotive and transport, Consumer goods, Building and construction, and Others), Source (Renewable resources, and Synthetic sources) and Geography (North America, Europe, APAC, South America, Middle East and Africa)

  • Which regions are analyzed in the report?

    • North America, Europe, APAC, South America and Middle East and Africa

  • What are the key growth drivers and market challenges?

    • Rise in number of applications of bio plasticizers across different industries, High cost of production of bio plasticizers

  • Who are the major players in the Bio Plasticizer Market?

    • ACS Technical Products, Avient Corp., BASF SE, Cargill Inc., DIC Corp., Dow Chemical Co., Emery Oleochemicals, Evonik Industries AG, Goldstab Organics Pvt. Ltd., Grupo Princz IPASA, Hebei Jingu Co. Ltd, India Glycols Ltd., Jungbunzlauer Suisse AG, Lanxess AG, Matrica S.p.A, Roquette Freres SA, Solvay SA, Valtris Specialty Chemicals and Zhejiang Jiaao Enprotech Stock Co Ltd

Market Research Insights

We can help! Our analysts can customize this bio plasticizer market research report to meet your requirements.

Get in touch

1. Executive Summary

1.1 Market overview

Executive Summary - Chart on Market Overview
Executive Summary - Data Table on Market Overview
Executive Summary - Chart on Global Market Characteristics
Executive Summary - Chart on Market by Geography
Executive Summary - Chart on Market Segmentation by Product
Executive Summary - Chart on Market Segmentation by Application
Executive Summary - Chart on Market Segmentation by Source
Executive Summary - Chart on Incremental Growth
Executive Summary - Data Table on Incremental Growth
Executive Summary - Chart on Company Market Positioning

2. Technavio Analysis

2.1 Analysis of price sensitivity, lifecycle, customer purchase basket, adoption rates, and purchase criteria

2.2 Criticality of inputs and Factors of differentiation

Chart on Overview on criticality of inputs and factors of differentiation

2.3 Factors of disruption

Chart on Overview on factors of disruption

2.4 Impact of drivers and challenges

Chart on Impact of drivers and challenges in 2025 and 2030

3. Market Landscape

3.1 Market ecosystem

Chart on Parent Market
Data Table on - Parent Market

3.2 Market characteristics

Chart on Market characteristics analysis

3.3 Value chain analysis

Chart on Value chain analysis

4. Market Sizing

4.1 Market definition

Data Table on Offerings of companies included in the market definition

4.2 Market segment analysis

Market segments

4.3 Market size 2025

4.4 Market outlook: Forecast for 2025-2030

Chart on Global - Market size and forecast 2025-2030 ($ million)
Data Table on Global - Market size and forecast 2025-2030 ($ million)
Chart on Global Market: Year-over-year growth 2025-2030 (%)
Data Table on Global Market: Year-over-year growth 2025-2030 (%)

5. Historic Market Size

5.1 Global Bio Plasticizer Market 2020 - 2024

Historic Market Size - Data Table on Global Bio Plasticizer Market 2020 - 2024 ($ million)

5.2 Product segment analysis 2020 - 2024

Historic Market Size - Product Segment 2020 - 2024 ($ million)

5.3 Application segment analysis 2020 - 2024

Historic Market Size - Application Segment 2020 - 2024 ($ million)

5.4 Source segment analysis 2020 - 2024

Historic Market Size - Source Segment 2020 - 2024 ($ million)

5.5 Geography segment analysis 2020 - 2024

Historic Market Size - Geography Segment 2020 - 2024 ($ million)

5.6 Country segment analysis 2020 - 2024

Historic Market Size - Country Segment 2020 - 2024 ($ million)

6. Qualitative Analysis

6.1 Impact of AI in global bio plasticizer market

7. Five Forces Analysis

7.1 Five forces summary

Five forces analysis - Comparison between 2025 and 2030

7.2 Bargaining power of buyers

Bargaining power of buyers - Impact of key factors 2025 and 2030

7.3 Bargaining power of suppliers

Bargaining power of suppliers - Impact of key factors in 2025 and 2030

7.4 Threat of new entrants

Threat of new entrants - Impact of key factors in 2025 and 2030

7.5 Threat of substitutes

Threat of substitutes - Impact of key factors in 2025 and 2030

7.6 Threat of rivalry

Threat of rivalry - Impact of key factors in 2025 and 2030

7.7 Market condition

Chart on Market condition - Five forces 2025 and 2030

8. Market Segmentation by Product

8.1 Market segments

Chart on Product - Market share 2025-2030 (%)
Data Table on Product - Market share 2025-2030 (%)

8.2 Comparison by Product

Chart on Comparison by Product
Data Table on Comparison by Product

8.3 ESBO - Market size and forecast 2025-2030

Chart on ESBO - Market size and forecast 2025-2030 ($ million)
Data Table on ESBO - Market size and forecast 2025-2030 ($ million)
Chart on ESBO - Year-over-year growth 2025-2030 (%)
Data Table on ESBO - Year-over-year growth 2025-2030 (%)

8.4 Castor oil based plasticizers - Market size and forecast 2025-2030

Chart on Castor oil based plasticizers - Market size and forecast 2025-2030 ($ million)
Data Table on Castor oil based plasticizers - Market size and forecast 2025-2030 ($ million)
Chart on Castor oil based plasticizers - Year-over-year growth 2025-2030 (%)
Data Table on Castor oil based plasticizers - Year-over-year growth 2025-2030 (%)

8.5 Citrates - Market size and forecast 2025-2030

Chart on Citrates - Market size and forecast 2025-2030 ($ million)
Data Table on Citrates - Market size and forecast 2025-2030 ($ million)
Chart on Citrates - Year-over-year growth 2025-2030 (%)
Data Table on Citrates - Year-over-year growth 2025-2030 (%)

8.6 Succinic acid - Market size and forecast 2025-2030

Chart on Succinic acid - Market size and forecast 2025-2030 ($ million)
Data Table on Succinic acid - Market size and forecast 2025-2030 ($ million)
Chart on Succinic acid - Year-over-year growth 2025-2030 (%)
Data Table on Succinic acid - Year-over-year growth 2025-2030 (%)

8.7 Others - Market size and forecast 2025-2030

Chart on Others - Market size and forecast 2025-2030 ($ million)
Data Table on Others - Market size and forecast 2025-2030 ($ million)
Chart on Others - Year-over-year growth 2025-2030 (%)
Data Table on Others - Year-over-year growth 2025-2030 (%)

8.8 Market opportunity by Product

Market opportunity by Product ($ million)
Data Table on Market opportunity by Product ($ million)

9. Market Segmentation by Application

9.1 Market segments

Chart on Application - Market share 2025-2030 (%)
Data Table on Application - Market share 2025-2030 (%)

9.2 Comparison by Application

Chart on Comparison by Application
Data Table on Comparison by Application

9.3 Packaging materials - Market size and forecast 2025-2030

Chart on Packaging materials - Market size and forecast 2025-2030 ($ million)
Data Table on Packaging materials - Market size and forecast 2025-2030 ($ million)
Chart on Packaging materials - Year-over-year growth 2025-2030 (%)
Data Table on Packaging materials - Year-over-year growth 2025-2030 (%)

9.4 Automotive and transport - Market size and forecast 2025-2030

Chart on Automotive and transport - Market size and forecast 2025-2030 ($ million)
Data Table on Automotive and transport - Market size and forecast 2025-2030 ($ million)
Chart on Automotive and transport - Year-over-year growth 2025-2030 (%)
Data Table on Automotive and transport - Year-over-year growth 2025-2030 (%)

9.5 Consumer goods - Market size and forecast 2025-2030

Chart on Consumer goods - Market size and forecast 2025-2030 ($ million)
Data Table on Consumer goods - Market size and forecast 2025-2030 ($ million)
Chart on Consumer goods - Year-over-year growth 2025-2030 (%)
Data Table on Consumer goods - Year-over-year growth 2025-2030 (%)

9.6 Building and construction - Market size and forecast 2025-2030

Chart on Building and construction - Market size and forecast 2025-2030 ($ million)
Data Table on Building and construction - Market size and forecast 2025-2030 ($ million)
Chart on Building and construction - Year-over-year growth 2025-2030 (%)
Data Table on Building and construction - Year-over-year growth 2025-2030 (%)

9.7 Others - Market size and forecast 2025-2030

Chart on Others - Market size and forecast 2025-2030 ($ million)
Data Table on Others - Market size and forecast 2025-2030 ($ million)
Chart on Others - Year-over-year growth 2025-2030 (%)
Data Table on Others - Year-over-year growth 2025-2030 (%)

9.8 Market opportunity by Application

Market opportunity by Application ($ million)
Data Table on Market opportunity by Application ($ million)

10. Market Segmentation by Source

10.1 Market segments

Chart on Source - Market share 2025-2030 (%)
Data Table on Source - Market share 2025-2030 (%)

10.2 Comparison by Source

Chart on Comparison by Source
Data Table on Comparison by Source

10.3 Renewable resources - Market size and forecast 2025-2030

Chart on Renewable resources - Market size and forecast 2025-2030 ($ million)
Data Table on Renewable resources - Market size and forecast 2025-2030 ($ million)
Chart on Renewable resources - Year-over-year growth 2025-2030 (%)
Data Table on Renewable resources - Year-over-year growth 2025-2030 (%)

10.4 Synthetic sources - Market size and forecast 2025-2030

Chart on Synthetic sources - Market size and forecast 2025-2030 ($ million)
Data Table on Synthetic sources - Market size and forecast 2025-2030 ($ million)
Chart on Synthetic sources - Year-over-year growth 2025-2030 (%)
Data Table on Synthetic sources - Year-over-year growth 2025-2030 (%)

10.5 Market opportunity by Source

Market opportunity by Source ($ million)
Data Table on Market opportunity by Source ($ million)

11. Customer Landscape

11.1 Customer landscape overview

Analysis of price sensitivity, lifecycle, customer purchase basket, adoption rates, and purchase criteria

12. Geographic Landscape

12.1 Geographic segmentation

Chart on Market share by geography 2025-2030 (%)
Data Table on Market share by geography 2025-2030 (%)

12.2 Geographic comparison

Chart on Geographic comparison
Data Table on Geographic comparison

12.3 North America - Market size and forecast 2025-2030

Chart on North America - Market size and forecast 2025-2030 ($ million)
Data Table on North America - Market size and forecast 2025-2030 ($ million)
Chart on North America - Year-over-year growth 2025-2030 (%)
Data Table on North America - Year-over-year growth 2025-2030 (%)
Chart on Regional Comparison - North America
Data Table on Regional Comparison - North America

12.3.1 US - Market size and forecast 2025-2030

Chart on US - Market size and forecast 2025-2030 ($ million)
Data Table on US - Market size and forecast 2025-2030 ($ million)
Chart on US - Year-over-year growth 2025-2030 (%)
Data Table on US - Year-over-year growth 2025-2030 (%)

12.3.2 Canada - Market size and forecast 2025-2030

Chart on Canada - Market size and forecast 2025-2030 ($ million)
Data Table on Canada - Market size and forecast 2025-2030 ($ million)
Chart on Canada - Year-over-year growth 2025-2030 (%)
Data Table on Canada - Year-over-year growth 2025-2030 (%)

12.3.3 Mexico - Market size and forecast 2025-2030

Chart on Mexico - Market size and forecast 2025-2030 ($ million)
Data Table on Mexico - Market size and forecast 2025-2030 ($ million)
Chart on Mexico - Year-over-year growth 2025-2030 (%)
Data Table on Mexico - Year-over-year growth 2025-2030 (%)

12.4 Europe - Market size and forecast 2025-2030

Chart on Europe - Market size and forecast 2025-2030 ($ million)
Data Table on Europe - Market size and forecast 2025-2030 ($ million)
Chart on Europe - Year-over-year growth 2025-2030 (%)
Data Table on Europe - Year-over-year growth 2025-2030 (%)
Chart on Regional Comparison - Europe
Data Table on Regional Comparison - Europe

12.4.1 Germany - Market size and forecast 2025-2030

Chart on Germany - Market size and forecast 2025-2030 ($ million)
Data Table on Germany - Market size and forecast 2025-2030 ($ million)
Chart on Germany - Year-over-year growth 2025-2030 (%)
Data Table on Germany - Year-over-year growth 2025-2030 (%)

12.4.2 UK - Market size and forecast 2025-2030

Chart on UK - Market size and forecast 2025-2030 ($ million)
Data Table on UK - Market size and forecast 2025-2030 ($ million)
Chart on UK - Year-over-year growth 2025-2030 (%)
Data Table on UK - Year-over-year growth 2025-2030 (%)

12.4.3 France - Market size and forecast 2025-2030

Chart on France - Market size and forecast 2025-2030 ($ million)
Data Table on France - Market size and forecast 2025-2030 ($ million)
Chart on France - Year-over-year growth 2025-2030 (%)
Data Table on France - Year-over-year growth 2025-2030 (%)

12.4.4 Italy - Market size and forecast 2025-2030

Chart on Italy - Market size and forecast 2025-2030 ($ million)
Data Table on Italy - Market size and forecast 2025-2030 ($ million)
Chart on Italy - Year-over-year growth 2025-2030 (%)
Data Table on Italy - Year-over-year growth 2025-2030 (%)

12.4.5 The Netherlands - Market size and forecast 2025-2030

Chart on The Netherlands - Market size and forecast 2025-2030 ($ million)
Data Table on The Netherlands - Market size and forecast 2025-2030 ($ million)
Chart on The Netherlands - Year-over-year growth 2025-2030 (%)
Data Table on The Netherlands - Year-over-year growth 2025-2030 (%)

12.4.6 Spain - Market size and forecast 2025-2030

Chart on Spain - Market size and forecast 2025-2030 ($ million)
Data Table on Spain - Market size and forecast 2025-2030 ($ million)
Chart on Spain - Year-over-year growth 2025-2030 (%)
Data Table on Spain - Year-over-year growth 2025-2030 (%)

12.5 APAC - Market size and forecast 2025-2030

Chart on APAC - Market size and forecast 2025-2030 ($ million)
Data Table on APAC - Market size and forecast 2025-2030 ($ million)
Chart on APAC - Year-over-year growth 2025-2030 (%)
Data Table on APAC - Year-over-year growth 2025-2030 (%)
Chart on Regional Comparison - APAC
Data Table on Regional Comparison - APAC

12.5.1 China - Market size and forecast 2025-2030

Chart on China - Market size and forecast 2025-2030 ($ million)
Data Table on China - Market size and forecast 2025-2030 ($ million)
Chart on China - Year-over-year growth 2025-2030 (%)
Data Table on China - Year-over-year growth 2025-2030 (%)

12.5.2 Japan - Market size and forecast 2025-2030

Chart on Japan - Market size and forecast 2025-2030 ($ million)
Data Table on Japan - Market size and forecast 2025-2030 ($ million)
Chart on Japan - Year-over-year growth 2025-2030 (%)
Data Table on Japan - Year-over-year growth 2025-2030 (%)

12.5.3 India - Market size and forecast 2025-2030

Chart on India - Market size and forecast 2025-2030 ($ million)
Data Table on India - Market size and forecast 2025-2030 ($ million)
Chart on India - Year-over-year growth 2025-2030 (%)
Data Table on India - Year-over-year growth 2025-2030 (%)

12.5.4 South Korea - Market size and forecast 2025-2030

Chart on South Korea - Market size and forecast 2025-2030 ($ million)
Data Table on South Korea - Market size and forecast 2025-2030 ($ million)
Chart on South Korea - Year-over-year growth 2025-2030 (%)
Data Table on South Korea - Year-over-year growth 2025-2030 (%)

12.5.5 Australia - Market size and forecast 2025-2030

Chart on Australia - Market size and forecast 2025-2030 ($ million)
Data Table on Australia - Market size and forecast 2025-2030 ($ million)
Chart on Australia - Year-over-year growth 2025-2030 (%)
Data Table on Australia - Year-over-year growth 2025-2030 (%)

12.5.6 Indonesia - Market size and forecast 2025-2030

Chart on Indonesia - Market size and forecast 2025-2030 ($ million)
Data Table on Indonesia - Market size and forecast 2025-2030 ($ million)
Chart on Indonesia - Year-over-year growth 2025-2030 (%)
Data Table on Indonesia - Year-over-year growth 2025-2030 (%)

12.6 South America - Market size and forecast 2025-2030

Chart on South America - Market size and forecast 2025-2030 ($ million)
Data Table on South America - Market size and forecast 2025-2030 ($ million)
Chart on South America - Year-over-year growth 2025-2030 (%)
Data Table on South America - Year-over-year growth 2025-2030 (%)
Chart on Regional Comparison - South America
Data Table on Regional Comparison - South America

12.6.1 Brazil - Market size and forecast 2025-2030

Chart on Brazil - Market size and forecast 2025-2030 ($ million)
Data Table on Brazil - Market size and forecast 2025-2030 ($ million)
Chart on Brazil - Year-over-year growth 2025-2030 (%)
Data Table on Brazil - Year-over-year growth 2025-2030 (%)

12.6.2 Argentina - Market size and forecast 2025-2030

Chart on Argentina - Market size and forecast 2025-2030 ($ million)
Data Table on Argentina - Market size and forecast 2025-2030 ($ million)
Chart on Argentina - Year-over-year growth 2025-2030 (%)
Data Table on Argentina - Year-over-year growth 2025-2030 (%)

12.6.3 Chile - Market size and forecast 2025-2030

Chart on Chile - Market size and forecast 2025-2030 ($ million)
Data Table on Chile - Market size and forecast 2025-2030 ($ million)
Chart on Chile - Year-over-year growth 2025-2030 (%)
Data Table on Chile - Year-over-year growth 2025-2030 (%)

12.7 Middle East and Africa - Market size and forecast 2025-2030

Chart on Middle East and Africa - Market size and forecast 2025-2030 ($ million)
Data Table on Middle East and Africa - Market size and forecast 2025-2030 ($ million)
Chart on Middle East and Africa - Year-over-year growth 2025-2030 (%)
Data Table on Middle East and Africa - Year-over-year growth 2025-2030 (%)
Chart on Regional Comparison - Middle East and Africa
Data Table on Regional Comparison - Middle East and Africa

12.7.1 Saudi Arabia - Market size and forecast 2025-2030

Chart on Saudi Arabia - Market size and forecast 2025-2030 ($ million)
Data Table on Saudi Arabia - Market size and forecast 2025-2030 ($ million)
Chart on Saudi Arabia - Year-over-year growth 2025-2030 (%)
Data Table on Saudi Arabia - Year-over-year growth 2025-2030 (%)

12.7.2 UAE - Market size and forecast 2025-2030

Chart on UAE - Market size and forecast 2025-2030 ($ million)
Data Table on UAE - Market size and forecast 2025-2030 ($ million)
Chart on UAE - Year-over-year growth 2025-2030 (%)
Data Table on UAE - Year-over-year growth 2025-2030 (%)

12.7.3 South Africa - Market size and forecast 2025-2030

Chart on South Africa - Market size and forecast 2025-2030 ($ million)
Data Table on South Africa - Market size and forecast 2025-2030 ($ million)
Chart on South Africa - Year-over-year growth 2025-2030 (%)
Data Table on South Africa - Year-over-year growth 2025-2030 (%)

12.7.4 Israel - Market size and forecast 2025-2030

Chart on Israel - Market size and forecast 2025-2030 ($ million)
Data Table on Israel - Market size and forecast 2025-2030 ($ million)
Chart on Israel - Year-over-year growth 2025-2030 (%)
Data Table on Israel - Year-over-year growth 2025-2030 (%)

12.7.5 Turkey - Market size and forecast 2025-2030

Chart on Turkey - Market size and forecast 2025-2030 ($ million)
Data Table on Turkey - Market size and forecast 2025-2030 ($ million)
Chart on Turkey - Year-over-year growth 2025-2030 (%)
Data Table on Turkey - Year-over-year growth 2025-2030 (%)

12.8 Market opportunity by geography

Market opportunity by geography ($ million)
Data Tables on Market opportunity by geography ($ million)

13. Drivers, Challenges, and Opportunity

13.1 Market drivers

Rise in number of applications of bio plasticizers across different industries
Growing urbanization and infrastructure development
Rise in demand for eco friendly products

13.2 Market challenges

High cost of production of bio plasticizers
Issues related to limited availability of raw materials of bio plasticizers
Regulatory barriers in usage of bio plasticizers

13.3 Impact of drivers and challenges

Impact of drivers and challenges in 2025 and 2030

13.4 Market opportunities

Technological advancements of bio plasticizers
Increasing focus on sustainable packaging solutions
Increasing use in consumer goods

14. Competitive Landscape

14.1 Overview

14.2

Overview on criticality of inputs and factors of differentiation

14.3 Landscape disruption

Overview on factors of disruption

14.4 Industry risks

Impact of key risks on business

15. Competitive Analysis

15.1 Companies profiled

Companies covered

15.2 Company ranking index

15.3 Market positioning of companies

Matrix on companies position and classification

15.4 ACS Technical Products

ACS Technical Products - Overview
ACS Technical Products - Product / Service
ACS Technical Products - Key offerings
SWOT

15.5 Avient Corp.

Avient Corp. - Overview
Avient Corp. - Business segments
Avient Corp. - Key offerings
Avient Corp. - Segment focus
SWOT

15.6 Cargill Inc.

Cargill Inc. - Overview
Cargill Inc. - Product / Service
Cargill Inc. - Key offerings
SWOT

15.7 DIC Corp.

DIC Corp. - Overview
DIC Corp. - Business segments
DIC Corp. - Key news
DIC Corp. - Key offerings
DIC Corp. - Segment focus
SWOT

15.8 Dow Chemical Co.

Dow Chemical Co. - Overview
Dow Chemical Co. - Business segments
Dow Chemical Co. - Key news
Dow Chemical Co. - Key offerings
Dow Chemical Co. - Segment focus
SWOT

15.9 Emery Oleochemicals

Emery Oleochemicals - Overview
Emery Oleochemicals - Product / Service
Emery Oleochemicals - Key offerings
SWOT

15.10 Evonik Industries AG

Evonik Industries AG - Overview
Evonik Industries AG - Business segments
Evonik Industries AG - Key news
Evonik Industries AG - Key offerings
Evonik Industries AG - Segment focus
SWOT

15.11 Goldstab Organics Pvt. Ltd.

Goldstab Organics Pvt. Ltd. - Overview
Goldstab Organics Pvt. Ltd. - Product / Service
Goldstab Organics Pvt. Ltd. - Key offerings
SWOT

15.12 Grupo Princz IPASA

Grupo Princz IPASA - Overview
Grupo Princz IPASA - Product / Service
Grupo Princz IPASA - Key offerings
SWOT

15.13 India Glycols Ltd.

India Glycols Ltd. - Overview
India Glycols Ltd. - Business segments
India Glycols Ltd. - Key offerings
India Glycols Ltd. - Segment focus
SWOT

15.14 Jungbunzlauer Suisse AG

Jungbunzlauer Suisse AG - Overview
Jungbunzlauer Suisse AG - Product / Service
Jungbunzlauer Suisse AG - Key offerings
SWOT

15.15 Roquette Freres SA

Roquette Freres SA - Overview
Roquette Freres SA - Product / Service
Roquette Freres SA - Key offerings
SWOT

15.16 Solvay SA

Solvay SA - Overview
Solvay SA - Business segments
Solvay SA - Key news
Solvay SA - Key offerings
Solvay SA - Segment focus
SWOT

15.17 Valtris Specialty Chemicals

Valtris Specialty Chemicals - Overview
Valtris Specialty Chemicals - Product / Service
Valtris Specialty Chemicals - Key offerings
SWOT

15.18 Zhejiang Jiaao Enprotech Stock Co Ltd

Zhejiang Jiaao Enprotech Stock Co Ltd - Overview
Zhejiang Jiaao Enprotech Stock Co Ltd - Product / Service
Zhejiang Jiaao Enprotech Stock Co Ltd - Key offerings
SWOT

16. Appendix

16.1 Scope of the report

Market definition
Objectives
Notes and caveats

16.2 Inclusions and exclusions checklist

Inclusions checklist
Exclusions checklist

16.3 Currency conversion rates for US$

16.4 Research methodology

16.5 Data procurement

Information sources

16.6 Data validation

16.7 Validation techniques employed for market sizing

16.8 Data synthesis

16.9 360 degree market analysis

16.10 List of abbreviations

Research Methodology

Technavio presents a detailed picture of the market by way of study, synthesis, and summation of data from multiple sources. The analysts have presented the various facets of the market with a particular focus on identifying the key industry influencers. The data thus presented is comprehensive, reliable, and the result of extensive research, both primary and secondary.

INFORMATION SOURCES

Primary sources

  • Manufacturers and suppliers
  • Channel partners
  • Industry experts
  • Strategic decision makers

Secondary sources

  • Industry journals and periodicals
  • Government data
  • Financial reports of key industry players
  • Historical data
  • Press releases

DATA ANALYSIS

Data Synthesis

  • Collation of data
  • Estimation of key figures
  • Analysis of derived insights

Data Validation

  • Triangulation with data models
  • Reference against proprietary databases
  • Corroboration with industry experts

REPORT WRITING

Qualitative

  • Market drivers
  • Market challenges
  • Market trends
  • Five forces analysis

Quantitative

  • Market size and forecast
  • Market segmentation
  • Geographical insights
  • Competitive landscape

Interested in this report?

Get your sample now to see our research methodology and insights!

Download Now

Frequently Asked Questions

Bio Plasticizer market growth will increase by USD 902.0 million during 2026-2030.

The Bio Plasticizer market is expected to grow at a CAGR of 6.2% during 2026-2030.

Bio Plasticizer market is segmented by Product (ESBO, Castor oil based plasticizers, Citrates, Succinic acid, Others) Application (Packaging materials, Automotive and transport, Consumer goods, Building and construction, Others) Source (Renewable resources, Synthetic sources)

ACS Technical Products, Avient Corp., BASF SE, Cargill Inc., DIC Corp., Dow Chemical Co., Emery Oleochemicals, Evonik Industries AG, Goldstab Organics Pvt. Ltd., Grupo Princz IPASA, Hebei Jingu Co. Ltd, India Glycols Ltd., Jungbunzlauer Suisse AG, Lanxess AG, Matrica S.p.A, Roquette Freres SA, Solvay SA, Valtris Specialty Chemicals, Zhejiang Jiaao Enprotech Stock Co Ltd are a few of the key vendors in the Bio Plasticizer market.

North America will register the highest growth rate of 39.3% among the other regions. Therefore, the Bio Plasticizer market in North America is expected to garner significant business opportunities for the vendors during the forecast period.

US, Canada, Mexico, Germany, UK, France, Italy, The Netherlands, Spain, China, Japan, India, South Korea, Australia, Indonesia, Brazil, Argentina, Chile, Saudi Arabia, UAE, South Africa, Israel, Turkey

  • Rise in number of applications of bio plasticizers across different industries is the driving factor this market.

The Bio Plasticizer market vendors should focus on grabbing business opportunities from the Product segment as it accounted for the largest market share in the base year.