Bioprocess Technology Market Analysis, Size, and Forecast 2025-2029: North America (US, Canada, and Mexico), Europe (Germany, UK, and France), APAC (China, India, and Japan), South America (Brazil, Argentina, and Colombia), Middle East and Africa (Saudi Arabia, UAE, and Turkey), Asia, Rest of World (ROW)

Bioprocess Technology Market Analysis, Size, and Forecast 2025-2029:
North America (US, Canada, and Mexico), Europe (Germany, UK, and France), APAC (China, India, and Japan), South America (Brazil, Argentina, and Colombia), Middle East and Africa (Saudi Arabia, UAE, and Turkey), Asia, Rest of World (ROW)

Published: Dec 2025 294 Pages SKU: IRTNTR73957

Market Overview at a Glance

$55.64 B
Market Opportunity
11.4%
CAGR 2024 - 2029
46.4%
North America Growth
$40.68 B
Bioreactors segment 2023

Bioprocess Technology Market Size 2025-2029

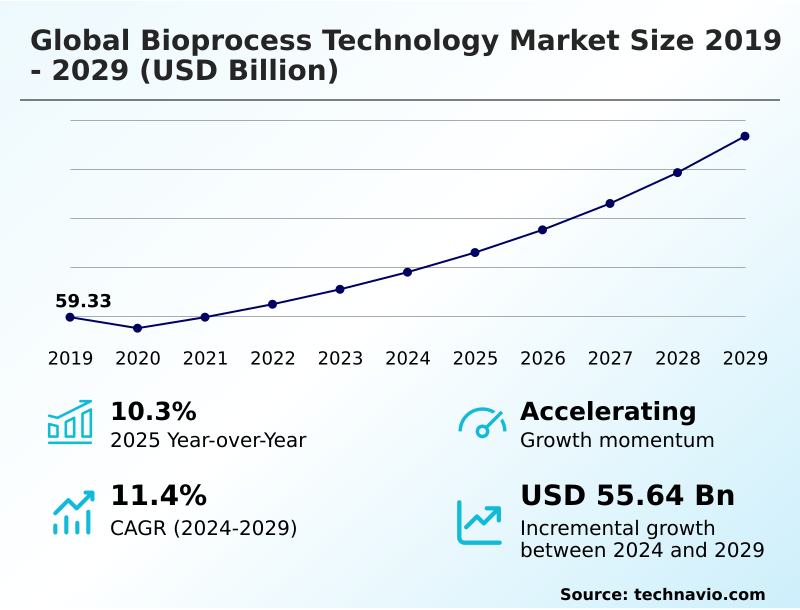
The bioprocess technology market size is valued to increase by USD 55.64 billion, at a CAGR of 11.4% from 2024 to 2029. Increase in infectious diseases will drive the bioprocess technology market.

Major Market Trends & Insights

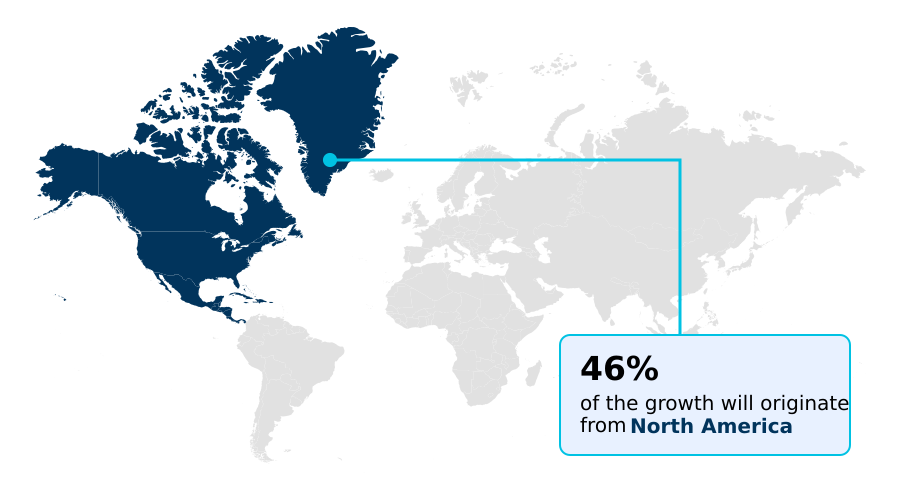
  • North America dominated the market and accounted for a 46.4% growth during the forecast period.
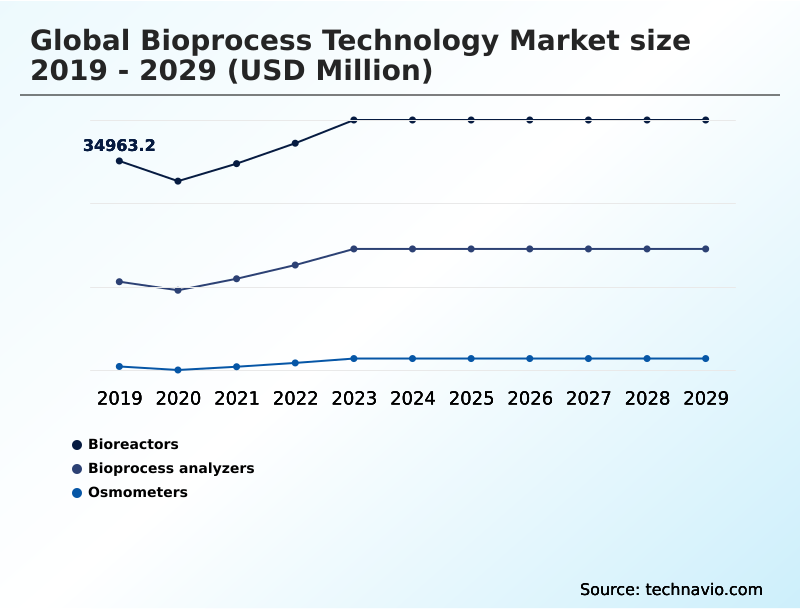
  • By Product Type - Bioreactors segment was valued at USD 40.68 billion in 2023
  • By Application - Cell and gene therapy segment accounted for the largest market revenue share in 2023

Market Size & Forecast

  • Market Opportunities: USD 74.04 billion
  • Market Future Opportunities: USD 55.64 billion
  • CAGR from 2024 to 2029 : 11.4%

Market Summary

  • The bioprocess technology market is foundational to modern medicine, enabling the manufacture of complex biologics from living cells. This sector is characterized by a significant shift from traditional pharmaceuticals to advanced therapies, including monoclonal antibodies and cell and gene therapies, which demand highly specialized production environments.
  • A core industry focus involves leveraging single-use systems and automation to enhance efficiency and mitigate contamination risks. For instance, a biopharmaceutical firm implementing process analytical technology (PAT) can monitor critical quality attributes in real-time, reducing batch deviations and ensuring consistent product quality, which is crucial for regulatory compliance.
  • This drive for innovation in upstream and downstream processing is balanced by challenges such as ensuring the scalability of manufacturing processes, managing complex global supply chains for critical raw materials, and navigating the rigorous validation requirements for new therapeutic modalities. The continued evolution of bioprocessing methods is essential to meet the growing global demand for life-saving treatments.

What will be the Size of the Bioprocess Technology Market during the forecast period?

Get Key Insights on Market Forecast (PDF) Request Free Sample

How is the Bioprocess Technology Market Segmented?

The bioprocess technology industry research report provides comprehensive data (region-wise segment analysis), with forecasts and estimates in "USD million" for the period 2025-2029, as well as historical data from 2019-2023 for the following segments.

  • Product type
    • Bioreactors
    • Bioprocess analyzers
    • Osmometers
  • Application
    • Cell and gene therapy
    • Monoclonal antibodies
    • Recombinant proteins
  • End-user
    • Biopharmaceutical companies
    • Contract manufacturing organizations
    • Academic research institutes
    • Others
  • Geography
    • North America
      • US
      • Canada
      • Mexico
    • Europe
      • Germany
      • UK
      • France
    • Asia
    • Rest of World (ROW)

By Product Type Insights

The bioreactors segment is estimated to witness significant growth during the forecast period.

The bioreactors segment is central to biopharmaceutical production, providing the controlled environment for mammalian cell culture and other processes. Market momentum is driven by the growing pipeline of complex biologics, including monoclonal antibodies and cell and gene therapy products.

A significant driver is the widespread single-use technology adoption, with disposable bioreactors offering greater agility for flexible manufacturing facilities. These systems eliminate extensive cleaning and validation, reducing facility changeover times by over 80%.

This efficiency is critical for accelerating tech transfer and enabling both fed-batch culture and emerging continuous biomanufacturing strategies.

As the industry moves toward process intensification, demand for innovative reactor designs that support aseptic processing and provide end-to-end solutions continues to increase.

Request Free Sample

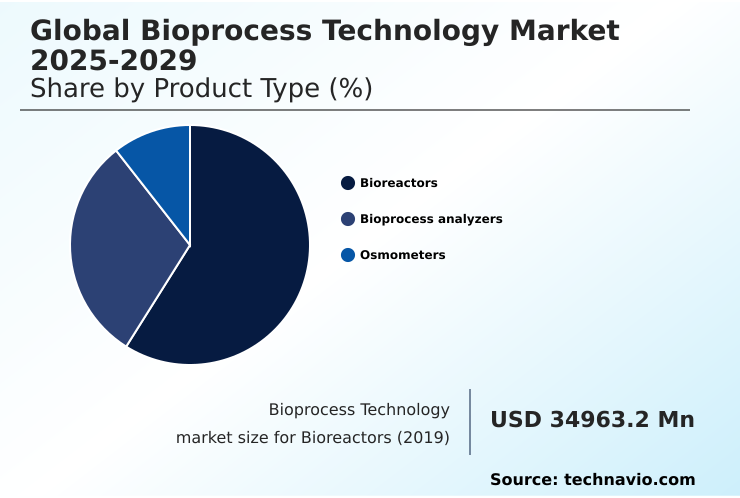
The Bioreactors segment was valued at USD 40.68 billion in 2023 and showed a gradual increase during the forecast period.

Request Free Sample

Regional Analysis

North America is estimated to contribute 46.4% to the growth of the global market during the forecast period.Technavio’s analysts have elaborately explained the regional trends and drivers that shape the market during the forecast period.

See How Bioprocess Technology Market Demand is Rising in North America Request Free Sample

North America leads the market, contributing over 46% of incremental growth, driven by its mature cGMP biomanufacturing ecosystem. High adoption of bioprocess analyzers, osmometers, and automated cell counting for controlling suspension culture processes underpins its dominance.

Europe follows, with hubs specializing in biologics. The Asia region exhibits the most rapid expansion, with investment in modular bioprocessing facilities increasing by over 20% annually.

This growth is fueled by building local capabilities in media formulation, aseptic sampling, and establishing working cell bank infrastructure.

Advanced techniques like closed system processing and aseptic fluid transfer, validated through bioprocess simulation, are becoming standard to ensure quality and regulatory alignment globally.
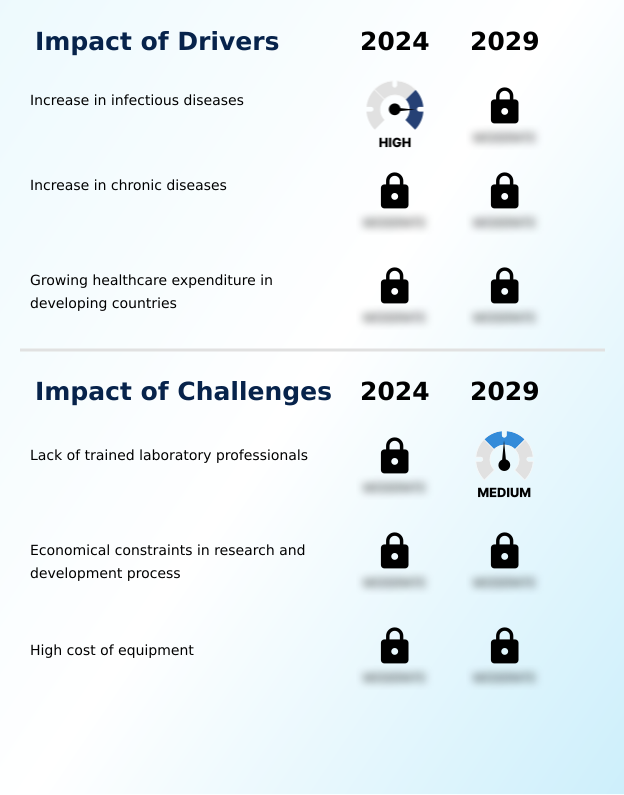
Market Dynamics

Our researchers analyzed the data with 2024 as the base year, along with the key drivers, trends, and challenges. A holistic analysis of drivers will help companies refine their marketing strategies to gain a competitive advantage.

  • Achieving operational excellence in the global bioprocess technology market 2025-2029 hinges on mastering highly specific and interconnected manufacturing disciplines. The successful continuous manufacturing for recombinant proteins requires not just advanced bioreactors but also a robust strategy for managing raw material variability bioprocessing.
  • As companies adopt high-throughput process development strategies, the tech transfer for biologic drug substance becomes a critical checkpoint where scale-down models for process validation are essential. A key focus is on the downstream purification of monoclonal antibodies, where optimizing tangential flow filtration system design and implementing effective viral clearance validation for biologics are paramount.
  • The challenges in viral vector scale-up for gene therapies necessitate unique automation solutions for aseptic processing and improved cryopreservation of cell therapy products. Organizations are increasingly turning to bioprocess data analytics and modeling to inform decisions, from optimizing cell culture media formulation to designing a perfusion bioreactor for high-density culture.
  • Integrating a single use bioreactor validation process into a quality management system that also addresses regulatory compliance for advanced therapies is now standard practice. This integrated approach, which offers end-to-end solutions for gene therapy, can improve supply chain robustness by over 50% compared to fragmented operational models.

What are the key market drivers leading to the rise in the adoption of Bioprocess Technology Industry?

  • The rising prevalence of infectious diseases worldwide is a key market driver, fueling demand for rapid development and large-scale production of vaccines and cell-based therapies.

  • Demand for sophisticated bioprocess technologies is primarily driven by the expanding pipeline of advanced therapy medicinal products and legacy biologics. The complex requirements for viral vector manufacturing and the production of recombinant proteins necessitate advanced solutions for drug substance manufacturing.
  • The need for rapid scalability assessment and robust process validation is critical, particularly for allogeneic cell therapy scale-up, where manufacturing a single lot can treat numerous patients.
  • Efficient cell banking protocols, including the establishment of a master cell bank, can shorten development timelines by 15%.
  • Furthermore, innovations supporting both adherent cell culture and autologous cell therapy workflow are vital for expediting the path to a biologics license application, addressing urgent clinical needs and driving market expansion.

What are the market trends shaping the Bioprocess Technology Industry?

  • An upcoming market trend is the globalization of clinical trials, driven by lower costs and greater patient access in developing nations. This expansion increases the demand for bioprocess technologies to support accelerated drug development.

  • A primary trend is the integration of digitalization through bioprocess automation and advanced analytics. PAT implementation enables in-line monitoring of critical process parameters, which improves batch-to-batch consistency by up to 25%. This quality by design approach, supported by sophisticated bioprocess modeling, is transforming both microbial fermentation and suspension culture workflows.
  • The adoption of perfusion bioreactors facilitates integrated bioprocessing and continuous operations, which can increase volumetric productivity by more than threefold compared to traditional methods. These advancements in process analytical technology and bioprocess control strategy are essential for optimizing cell line development and accelerating the timeline for novel modalities like mRNA vaccine production, ensuring more robust and efficient manufacturing.

What challenges does the Bioprocess Technology Industry face during its growth?

  • A significant challenge affecting industry growth is the scarcity of trained laboratory professionals qualified to operate advanced bioprocess equipment and interpret complex experimental results.

  • Key challenges center on manufacturing complexity and supply chain resilience. Raw material variability, especially in critical components like chromatography resins, can impact process performance, leading to batch failure rates that can exceed 5% in unoptimized workflows. Downstream purification remains a significant bottleneck, with multi-step processes for harvest and recovery and endotoxin removal adding considerable time and cost.
  • The shift to single-use systems introduces concerns around leachables and extractables, requiring rigorous testing. Furthermore, effective viral clearance studies and robust cryopreservation techniques are non-negotiable for product safety and stability. Implementing advanced bioreactor sensor technology helps mitigate some risks, but the high cost of technologies like disposable chromatography and tangential flow filtration systems remains a barrier for many organizations.

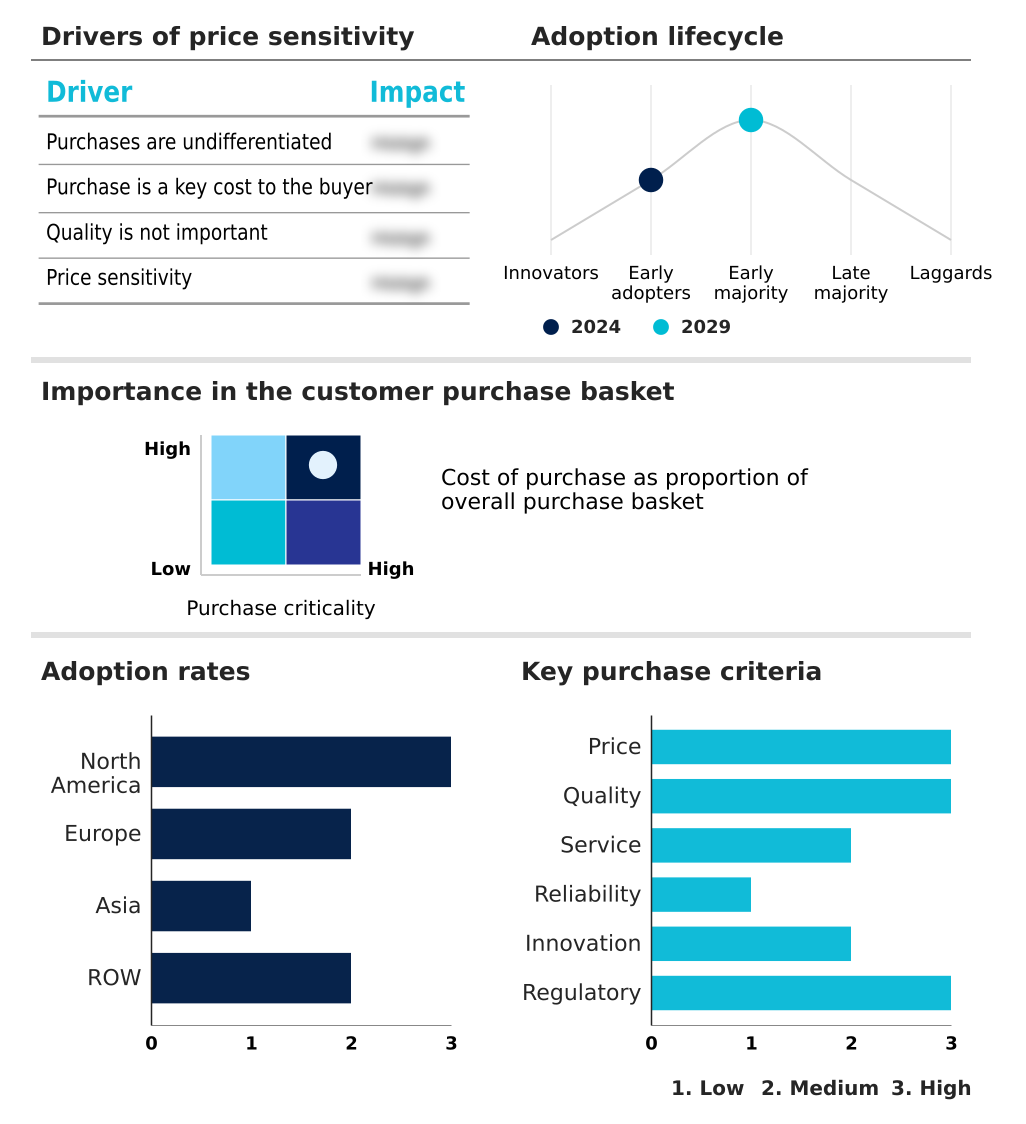
Exclusive Technavio Analysis on Customer Landscape

The bioprocess technology market forecasting report includes the adoption lifecycle of the market, covering from the innovator’s stage to the laggard’s stage. It focuses on adoption rates in different regions based on penetration. Furthermore, the bioprocess technology market report also includes key purchase criteria and drivers of price sensitivity to help companies evaluate and develop their market growth analysis strategies.

Customer Landscape of Bioprocess Technology Industry

Competitive Landscape

Companies are implementing various strategies, such as strategic alliances, bioprocess technology market forecast, partnerships, mergers and acquisitions, geographical expansion, and product/service launches, to enhance their presence in the industry.

Boehringer Ingelheim GmbH - Provides integrated bioprocess solutions, including advanced cell culture media and microbial host systems, to support complex biopharmaceutical development and manufacturing.

The industry research and growth report includes detailed analyses of the competitive landscape of the market and information about key companies, including:

  • Boehringer Ingelheim GmbH
  • Catalent Inc.
  • Charles River Laboratories
  • Corning Inc.
  • Danaher Corp.
  • Emerson Electric Co.
  • Eppendorf SE
  • Fujifilm Diosynth Biotechnologies USA Inc.
  • General Electric Co.
  • ILC Dover LP
  • Koninklijke Philips NV
  • Lonza Group Ltd.
  • Merck KGaA
  • Nova Biomedical Corp.
  • Repligen Corp.
  • Sartorius AG
  • STADA Arzneimittel AG
  • Thermo Fisher Scientific Inc.
  • Univercells SA

Qualitative and quantitative analysis of companies has been conducted to help clients understand the wider business environment as well as the strengths and weaknesses of key industry players. Data is qualitatively analyzed to categorize companies as pure play, category-focused, industry-focused, and diversified; it is quantitatively analyzed to categorize companies as dominant, leading, strong, tentative, and weak.

Recent Development and News in Bioprocess technology market

  • In September 2024, Danaher Corp. announced the acquisition of a leading process analytical technology (PAT) firm to strengthen its real-time monitoring capabilities for continuous biomanufacturing.
  • In November 2024, Thermo Fisher Scientific Inc. launched its next-generation single-use bioreactor platform, designed to improve scalability and process control for cell and gene therapy manufacturing.
  • In February 2025, Sartorius AG entered a strategic partnership with a leading AI software company to integrate predictive analytics into its downstream processing workflows, aiming to optimize purification yields.
  • In April 2025, Lonza Group Ltd. received FDA approval for its new large-scale viral vector manufacturing facility, significantly expanding its capacity to support late-stage gene therapy clinical trials.

Dive into Technavio’s robust research methodology, blending expert interviews, extensive data synthesis, and validated models for unparalleled Bioprocess Technology Market insights. See full methodology.

Market Scope
Page number 294
Base year 2024
Historic period 2019-2023
Forecast period 2025-2029
Growth momentum & CAGR Accelerate at a CAGR of 11.4%
Market growth 2025-2029 USD 55635.4 million
Market structure Fragmented
YoY growth 2024-2025(%) 10.3%
Key countries US, Canada, Mexico, Germany, UK, France, Italy, Spain, The Netherlands, China, India, Japan, South Korea, Thailand, Indonesia, Brazil, Saudi Arabia, UAE, Turkey, Argentina, Colombia, South Africa and Israel
Competitive landscape Leading Companies, Market Positioning of Companies, Competitive Strategies, and Industry Risks

Request Free Sample

Research Analyst Overview

  • The bioprocess technology market is defined by the complex integration of upstream processing and downstream purification to enable biopharmaceutical production. Central to this is the choice between mammalian cell culture and microbial fermentation, with techniques like fed-batch culture and perfusion bioreactors optimizing output. Core equipment, including advanced bioreactors, bioprocess analyzers, and osmometers, are pivotal for control.
  • The industry's shift toward single-use bioreactors reflects a boardroom-level focus on reducing capital expenditure and increasing operational flexibility. This move is supported by bioprocess automation and process analytical technology, which, when applied under a quality by design framework, can reduce process deviations by 25%. Key activities such as cell line development, cell banking, and using defined cryopreservation techniques are fundamental.
  • For biologics like monoclonal antibodies, recombinant proteins, and products from viral vector manufacturing, purification requires high-purity chromatography resins, tangential flow filtration, and affinity chromatography. Ensuring safety through sterile filtration, endotoxin removal, and rigorous aseptic processing via aseptic sampling is non-negotiable.
  • Ultimately, successful cGMP biomanufacturing depends on robust process validation and a clear scalability assessment to transition from development to commercial-scale harvest and recovery, especially for complex cell and gene therapy applications.

What are the Key Data Covered in this Bioprocess Technology Market Research and Growth Report?

  • What is the expected growth of the Bioprocess Technology Market between 2025 and 2029?

    • USD 55.64 billion, at a CAGR of 11.4%

  • What segmentation does the market report cover?

    • The report is segmented by Product Type (Bioreactors, Bioprocess analyzers, and Osmometers), Application (Cell and gene therapy, Monoclonal antibodies, and Recombinant proteins), End-user (Biopharmaceutical companies, Contract manufacturing organizations, Academic research institutes, and Others) and Geography (North America, Europe, Asia, Rest of World (ROW))

  • Which regions are analyzed in the report?

    • North America, Europe, Asia and Rest of World (ROW)

  • What are the key growth drivers and market challenges?

    • Increase in infectious diseases, Lack of trained laboratory professionals

  • Who are the major players in the Bioprocess Technology Market?

    • Boehringer Ingelheim GmbH, Catalent Inc., Charles River Laboratories, Corning Inc., Danaher Corp., Emerson Electric Co., Eppendorf SE, Fujifilm Diosynth Biotechnologies USA Inc., General Electric Co., ILC Dover LP, Koninklijke Philips NV, Lonza Group Ltd., Merck KGaA, Nova Biomedical Corp., Repligen Corp., Sartorius AG, STADA Arzneimittel AG, Thermo Fisher Scientific Inc. and Univercells SA

Market Research Insights

  • The market's momentum is driven by a strategic shift toward technologies that enhance manufacturing agility and speed. The adoption of single-use systems has been pivotal, reducing contamination risks by over 90% compared to traditional stainless-steel infrastructures. This transition to disposable components facilitates the implementation of flexible manufacturing and continuous bioprocessing, which can shorten process development timelines by up to 40%.
  • Concurrently, process intensification is a key dynamic, enabling higher product titers and greater throughput within smaller facility footprints. These advancements are critical for meeting the production demands of both commercial-scale biologics and personalized cell therapies, where efficiency and control are paramount for clinical success.

We can help! Our analysts can customize this bioprocess technology market research report to meet your requirements.

Get in touch

1. Executive Summary

1.1 Market overview

Executive Summary - Chart on Market Overview
Executive Summary - Data Table on Market Overview
Executive Summary - Chart on Global Market Characteristics
Executive Summary - Chart on Market by Geography
Executive Summary - Chart on Market Segmentation by Product Type
Executive Summary - Chart on Market Segmentation by Application
Executive Summary - Chart on Market Segmentation by End-user
Executive Summary - Chart on Incremental Growth
Executive Summary - Data Table on Incremental Growth
Executive Summary - Chart on Company Market Positioning

2. Technavio Analysis

2.1 Analysis of price sensitivity, lifecycle, customer purchase basket, adoption rates, and purchase criteria

2.2 Criticality of inputs and Factors of differentiation

Chart on Overview on criticality of inputs and factors of differentiation

2.3 Factors of disruption

Chart on Overview on factors of disruption

2.4 Impact of drivers and challenges

Chart on Impact of drivers and challenges in 2024 and 2029

3. Market Landscape

3.1 Market ecosystem

Chart on Parent Market
Data Table on - Parent Market

3.2 Market characteristics

Chart on Market characteristics analysis

3.3 Value chain analysis

Chart on Value chain analysis

4. Market Sizing

4.1 Market definition

Data Table on Offerings of companies included in the market definition

4.2 Market segment analysis

Market segments

4.3 Market size 2024

4.4 Market outlook: Forecast for 2024-2029

Chart on Global - Market size and forecast 2024-2029 ($ million)
Data Table on Global - Market size and forecast 2024-2029 ($ million)
Chart on Global Market: Year-over-year growth 2024-2029 (%)
Data Table on Global Market: Year-over-year growth 2024-2029 (%)

5. Historic Market Size

5.1 Global Bioprocess Technology Market 2019 - 2023

Historic Market Size - Data Table on Global Bioprocess Technology Market 2019 - 2023 ($ million)

5.2 Product Type segment analysis 2019 - 2023

Historic Market Size - Product Type Segment 2019 - 2023 ($ million)

5.3 Application segment analysis 2019 - 2023

Historic Market Size - Application Segment 2019 - 2023 ($ million)

5.4 End-user segment analysis 2019 - 2023

Historic Market Size - End-user Segment 2019 - 2023 ($ million)

5.5 Geography segment analysis 2019 - 2023

Historic Market Size - Geography Segment 2019 - 2023 ($ million)

5.6 Country segment analysis 2019 - 2023

Historic Market Size - Country Segment 2019 - 2023 ($ million)

6. Qualitative Analysis

6.1 The impact of AI in Global Bioprocess Technology Market

7. Five Forces Analysis

7.1 Five forces summary

Five forces analysis - Comparison between 2024 and 2029

7.2 Bargaining power of buyers

Bargaining power of buyers - Impact of key factors 2024 and 2029

7.3 Bargaining power of suppliers

Bargaining power of suppliers - Impact of key factors in 2024 and 2029

7.4 Threat of new entrants

Threat of new entrants - Impact of key factors in 2024 and 2029

7.5 Threat of substitutes

Threat of substitutes - Impact of key factors in 2024 and 2029

7.6 Threat of rivalry

Threat of rivalry - Impact of key factors in 2024 and 2029

7.7 Market condition

Chart on Market condition - Five forces 2024 and 2029

8. Market Segmentation by Product Type

8.1 Market segments

Chart on Product Type - Market share 2024-2029 (%)
Data Table on Product Type - Market share 2024-2029 (%)

8.2 Comparison by Product Type

Chart on Comparison by Product Type
Data Table on Comparison by Product Type

8.3 Bioreactors - Market size and forecast 2024-2029

Chart on Bioreactors - Market size and forecast 2024-2029 ($ million)
Data Table on Bioreactors - Market size and forecast 2024-2029 ($ million)
Chart on Bioreactors - Year-over-year growth 2024-2029 (%)
Data Table on Bioreactors - Year-over-year growth 2024-2029 (%)

8.4 Bioprocess analyzers - Market size and forecast 2024-2029

Chart on Bioprocess analyzers - Market size and forecast 2024-2029 ($ million)
Data Table on Bioprocess analyzers - Market size and forecast 2024-2029 ($ million)
Chart on Bioprocess analyzers - Year-over-year growth 2024-2029 (%)
Data Table on Bioprocess analyzers - Year-over-year growth 2024-2029 (%)

8.5 Osmometers - Market size and forecast 2024-2029

Chart on Osmometers - Market size and forecast 2024-2029 ($ million)
Data Table on Osmometers - Market size and forecast 2024-2029 ($ million)
Chart on Osmometers - Year-over-year growth 2024-2029 (%)
Data Table on Osmometers - Year-over-year growth 2024-2029 (%)

8.6 Market opportunity by Product Type

Market opportunity by Product Type ($ million)
Data Table on Market opportunity by Product Type ($ million)

9. Market Segmentation by Application

9.1 Market segments

Chart on Application - Market share 2024-2029 (%)
Data Table on Application - Market share 2024-2029 (%)

9.2 Comparison by Application

Chart on Comparison by Application
Data Table on Comparison by Application

9.3 Cell and gene therapy - Market size and forecast 2024-2029

Chart on Cell and gene therapy - Market size and forecast 2024-2029 ($ million)
Data Table on Cell and gene therapy - Market size and forecast 2024-2029 ($ million)
Chart on Cell and gene therapy - Year-over-year growth 2024-2029 (%)
Data Table on Cell and gene therapy - Year-over-year growth 2024-2029 (%)

9.4 Monoclonal antibodies - Market size and forecast 2024-2029

Chart on Monoclonal antibodies - Market size and forecast 2024-2029 ($ million)
Data Table on Monoclonal antibodies - Market size and forecast 2024-2029 ($ million)
Chart on Monoclonal antibodies - Year-over-year growth 2024-2029 (%)
Data Table on Monoclonal antibodies - Year-over-year growth 2024-2029 (%)

9.5 Recombinant proteins - Market size and forecast 2024-2029

Chart on Recombinant proteins - Market size and forecast 2024-2029 ($ million)
Data Table on Recombinant proteins - Market size and forecast 2024-2029 ($ million)
Chart on Recombinant proteins - Year-over-year growth 2024-2029 (%)
Data Table on Recombinant proteins - Year-over-year growth 2024-2029 (%)

9.6 Market opportunity by Application

Market opportunity by Application ($ million)
Data Table on Market opportunity by Application ($ million)

10. Market Segmentation by End-user

10.1 Market segments

Chart on End-user - Market share 2024-2029 (%)
Data Table on End-user - Market share 2024-2029 (%)

10.2 Comparison by End-user

Chart on Comparison by End-user
Data Table on Comparison by End-user

10.3 Biopharmaceutical companies - Market size and forecast 2024-2029

Chart on Biopharmaceutical companies - Market size and forecast 2024-2029 ($ million)
Data Table on Biopharmaceutical companies - Market size and forecast 2024-2029 ($ million)
Chart on Biopharmaceutical companies - Year-over-year growth 2024-2029 (%)
Data Table on Biopharmaceutical companies - Year-over-year growth 2024-2029 (%)

10.4 Contract manufacturing organizations - Market size and forecast 2024-2029

Chart on Contract manufacturing organizations - Market size and forecast 2024-2029 ($ million)
Data Table on Contract manufacturing organizations - Market size and forecast 2024-2029 ($ million)
Chart on Contract manufacturing organizations - Year-over-year growth 2024-2029 (%)
Data Table on Contract manufacturing organizations - Year-over-year growth 2024-2029 (%)

10.5 Academic research institutes - Market size and forecast 2024-2029

Chart on Academic research institutes - Market size and forecast 2024-2029 ($ million)
Data Table on Academic research institutes - Market size and forecast 2024-2029 ($ million)
Chart on Academic research institutes - Year-over-year growth 2024-2029 (%)
Data Table on Academic research institutes - Year-over-year growth 2024-2029 (%)

10.6 Others - Market size and forecast 2024-2029

Chart on Others - Market size and forecast 2024-2029 ($ million)
Data Table on Others - Market size and forecast 2024-2029 ($ million)
Chart on Others - Year-over-year growth 2024-2029 (%)
Data Table on Others - Year-over-year growth 2024-2029 (%)

10.7 Market opportunity by End-user

Market opportunity by End-user ($ million)
Data Table on Market opportunity by End-user ($ million)

11. Customer Landscape

11.1 Customer landscape overview

Analysis of price sensitivity, lifecycle, customer purchase basket, adoption rates, and purchase criteria

12. Geographic Landscape

12.1 Geographic segmentation

Chart on Market share by geography 2024-2029 (%)
Data Table on Market share by geography 2024-2029 (%)

12.2 Geographic comparison

Chart on Geographic comparison
Data Table on Geographic comparison

12.3 North America - Market size and forecast 2024-2029

Chart on North America - Market size and forecast 2024-2029 ($ million)
Data Table on North America - Market size and forecast 2024-2029 ($ million)
Chart on North America - Year-over-year growth 2024-2029 (%)
Data Table on North America - Year-over-year growth 2024-2029 (%)
Chart on Regional Comparison - North America
Data Table on Regional Comparison - North America

12.3.1 US - Market size and forecast 2024-2029

Chart on US - Market size and forecast 2024-2029 ($ million)
Data Table on US - Market size and forecast 2024-2029 ($ million)
Chart on US - Year-over-year growth 2024-2029 (%)
Data Table on US - Year-over-year growth 2024-2029 (%)

12.3.2 Canada - Market size and forecast 2024-2029

Chart on Canada - Market size and forecast 2024-2029 ($ million)
Data Table on Canada - Market size and forecast 2024-2029 ($ million)
Chart on Canada - Year-over-year growth 2024-2029 (%)
Data Table on Canada - Year-over-year growth 2024-2029 (%)

12.3.3 Mexico - Market size and forecast 2024-2029

Chart on Mexico - Market size and forecast 2024-2029 ($ million)
Data Table on Mexico - Market size and forecast 2024-2029 ($ million)
Chart on Mexico - Year-over-year growth 2024-2029 (%)
Data Table on Mexico - Year-over-year growth 2024-2029 (%)

12.4 Europe - Market size and forecast 2024-2029

Chart on Europe - Market size and forecast 2024-2029 ($ million)
Data Table on Europe - Market size and forecast 2024-2029 ($ million)
Chart on Europe - Year-over-year growth 2024-2029 (%)
Data Table on Europe - Year-over-year growth 2024-2029 (%)
Chart on Regional Comparison - Europe
Data Table on Regional Comparison - Europe

12.4.1 Germany - Market size and forecast 2024-2029

Chart on Germany - Market size and forecast 2024-2029 ($ million)
Data Table on Germany - Market size and forecast 2024-2029 ($ million)
Chart on Germany - Year-over-year growth 2024-2029 (%)
Data Table on Germany - Year-over-year growth 2024-2029 (%)

12.4.2 UK - Market size and forecast 2024-2029

Chart on UK - Market size and forecast 2024-2029 ($ million)
Data Table on UK - Market size and forecast 2024-2029 ($ million)
Chart on UK - Year-over-year growth 2024-2029 (%)
Data Table on UK - Year-over-year growth 2024-2029 (%)

12.4.3 France - Market size and forecast 2024-2029

Chart on France - Market size and forecast 2024-2029 ($ million)
Data Table on France - Market size and forecast 2024-2029 ($ million)
Chart on France - Year-over-year growth 2024-2029 (%)
Data Table on France - Year-over-year growth 2024-2029 (%)

12.4.4 Italy - Market size and forecast 2024-2029

Chart on Italy - Market size and forecast 2024-2029 ($ million)
Data Table on Italy - Market size and forecast 2024-2029 ($ million)
Chart on Italy - Year-over-year growth 2024-2029 (%)
Data Table on Italy - Year-over-year growth 2024-2029 (%)

12.4.5 Spain - Market size and forecast 2024-2029

Chart on Spain - Market size and forecast 2024-2029 ($ million)
Data Table on Spain - Market size and forecast 2024-2029 ($ million)
Chart on Spain - Year-over-year growth 2024-2029 (%)
Data Table on Spain - Year-over-year growth 2024-2029 (%)

12.4.6 The Netherlands - Market size and forecast 2024-2029

Chart on The Netherlands - Market size and forecast 2024-2029 ($ million)
Data Table on The Netherlands - Market size and forecast 2024-2029 ($ million)
Chart on The Netherlands - Year-over-year growth 2024-2029 (%)
Data Table on The Netherlands - Year-over-year growth 2024-2029 (%)

12.5 Asia - Market size and forecast 2024-2029

Chart on Asia - Market size and forecast 2024-2029 ($ million)
Data Table on Asia - Market size and forecast 2024-2029 ($ million)
Chart on Asia - Year-over-year growth 2024-2029 (%)
Data Table on Asia - Year-over-year growth 2024-2029 (%)
Chart on Regional Comparison - Asia
Data Table on Regional Comparison - Asia

12.5.1 China - Market size and forecast 2024-2029

Chart on China - Market size and forecast 2024-2029 ($ million)
Data Table on China - Market size and forecast 2024-2029 ($ million)
Chart on China - Year-over-year growth 2024-2029 (%)
Data Table on China - Year-over-year growth 2024-2029 (%)

12.5.2 India - Market size and forecast 2024-2029

Chart on India - Market size and forecast 2024-2029 ($ million)
Data Table on India - Market size and forecast 2024-2029 ($ million)
Chart on India - Year-over-year growth 2024-2029 (%)
Data Table on India - Year-over-year growth 2024-2029 (%)

12.5.3 Japan - Market size and forecast 2024-2029

Chart on Japan - Market size and forecast 2024-2029 ($ million)
Data Table on Japan - Market size and forecast 2024-2029 ($ million)
Chart on Japan - Year-over-year growth 2024-2029 (%)
Data Table on Japan - Year-over-year growth 2024-2029 (%)

12.5.4 South Korea - Market size and forecast 2024-2029

Chart on South Korea - Market size and forecast 2024-2029 ($ million)
Data Table on South Korea - Market size and forecast 2024-2029 ($ million)
Chart on South Korea - Year-over-year growth 2024-2029 (%)
Data Table on South Korea - Year-over-year growth 2024-2029 (%)

12.5.5 Thailand - Market size and forecast 2024-2029

Chart on Thailand - Market size and forecast 2024-2029 ($ million)
Data Table on Thailand - Market size and forecast 2024-2029 ($ million)
Chart on Thailand - Year-over-year growth 2024-2029 (%)
Data Table on Thailand - Year-over-year growth 2024-2029 (%)

12.5.6 Indonesia - Market size and forecast 2024-2029

Chart on Indonesia - Market size and forecast 2024-2029 ($ million)
Data Table on Indonesia - Market size and forecast 2024-2029 ($ million)
Chart on Indonesia - Year-over-year growth 2024-2029 (%)
Data Table on Indonesia - Year-over-year growth 2024-2029 (%)

12.6 Rest of World (ROW) - Market size and forecast 2024-2029

Chart on Rest of World (ROW) - Market size and forecast 2024-2029 ($ million)
Data Table on Rest of World (ROW) - Market size and forecast 2024-2029 ($ million)
Chart on Rest of World (ROW) - Year-over-year growth 2024-2029 (%)
Data Table on Rest of World (ROW) - Year-over-year growth 2024-2029 (%)
Chart on Regional Comparison - Rest of World (ROW)
Data Table on Regional Comparison - Rest of World (ROW)

12.6.1 Brazil - Market size and forecast 2024-2029

Chart on Brazil - Market size and forecast 2024-2029 ($ million)
Data Table on Brazil - Market size and forecast 2024-2029 ($ million)
Chart on Brazil - Year-over-year growth 2024-2029 (%)
Data Table on Brazil - Year-over-year growth 2024-2029 (%)

12.6.2 Saudi Arabia - Market size and forecast 2024-2029

Chart on Saudi Arabia - Market size and forecast 2024-2029 ($ million)
Data Table on Saudi Arabia - Market size and forecast 2024-2029 ($ million)
Chart on Saudi Arabia - Year-over-year growth 2024-2029 (%)
Data Table on Saudi Arabia - Year-over-year growth 2024-2029 (%)

12.6.3 UAE - Market size and forecast 2024-2029

Chart on UAE - Market size and forecast 2024-2029 ($ million)
Data Table on UAE - Market size and forecast 2024-2029 ($ million)
Chart on UAE - Year-over-year growth 2024-2029 (%)
Data Table on UAE - Year-over-year growth 2024-2029 (%)

12.6.4 Turkey - Market size and forecast 2024-2029

Chart on Turkey - Market size and forecast 2024-2029 ($ million)
Data Table on Turkey - Market size and forecast 2024-2029 ($ million)
Chart on Turkey - Year-over-year growth 2024-2029 (%)
Data Table on Turkey - Year-over-year growth 2024-2029 (%)

12.6.5 Argentina - Market size and forecast 2024-2029

Chart on Argentina - Market size and forecast 2024-2029 ($ million)
Data Table on Argentina - Market size and forecast 2024-2029 ($ million)
Chart on Argentina - Year-over-year growth 2024-2029 (%)
Data Table on Argentina - Year-over-year growth 2024-2029 (%)

12.6.6 Colombia - Market size and forecast 2024-2029

Chart on Colombia - Market size and forecast 2024-2029 ($ million)
Data Table on Colombia - Market size and forecast 2024-2029 ($ million)
Chart on Colombia - Year-over-year growth 2024-2029 (%)
Data Table on Colombia - Year-over-year growth 2024-2029 (%)

12.6.7 South Africa - Market size and forecast 2024-2029

Chart on South Africa - Market size and forecast 2024-2029 ($ million)
Data Table on South Africa - Market size and forecast 2024-2029 ($ million)
Chart on South Africa - Year-over-year growth 2024-2029 (%)
Data Table on South Africa - Year-over-year growth 2024-2029 (%)

12.6.8 Israel - Market size and forecast 2024-2029

Chart on Israel - Market size and forecast 2024-2029 ($ million)
Data Table on Israel - Market size and forecast 2024-2029 ($ million)
Chart on Israel - Year-over-year growth 2024-2029 (%)
Data Table on Israel - Year-over-year growth 2024-2029 (%)

12.7 Market opportunity by geography

Market opportunity by geography ($ million)
Data Tables on Market opportunity by geography ($ million)

13. Drivers, Challenges, and Opportunity

13.1 Market drivers

Increase in infectious diseases
Increase in chronic diseases
Growing healthcare expenditure in developing countries

13.2 Market challenges

Lack of trained laboratory professionals
Economical constraints in research and development process
High cost of equipment

13.3 Impact of drivers and challenges

Impact of drivers and challenges in 2024 and 2029

13.4 Market opportunities

Increasing clinical trials in countries
Increase in merger and acquisition activities by companies
Increasing demand for 3D cell culture

14. Competitive Landscape

14.1 Overview

14.2

Overview on criticality of inputs and factors of differentiation

14.3 Landscape disruption

Overview on factors of disruption

14.4 Industry risks

Impact of key risks on business

15. Competitive Analysis

15.1 Companies profiled

Companies covered

15.2 Company ranking index

15.3 Market positioning of companies

Matrix on companies position and classification

15.4 Boehringer Ingelheim GmbH

Boehringer Ingelheim GmbH - Overview
Boehringer Ingelheim GmbH - Product / Service
Boehringer Ingelheim GmbH - Key news
Boehringer Ingelheim GmbH - Key offerings
SWOT

15.5 Catalent Inc.

Catalent Inc. - Overview
Catalent Inc. - Business segments
Catalent Inc. - Key offerings
Catalent Inc. - Segment focus
SWOT

15.6 Charles River Laboratories

Charles River Laboratories - Overview
Charles River Laboratories - Business segments
Charles River Laboratories - Key offerings
Charles River Laboratories - Segment focus
SWOT

15.7 Corning Inc.

Corning Inc. - Overview
Corning Inc. - Business segments
Corning Inc. - Key offerings
Corning Inc. - Segment focus
SWOT

15.8 Danaher Corp.

Danaher Corp. - Overview
Danaher Corp. - Business segments
Danaher Corp. - Key news
Danaher Corp. - Key offerings
Danaher Corp. - Segment focus
SWOT

15.9 Emerson Electric Co.

Emerson Electric Co. - Overview
Emerson Electric Co. - Business segments
Emerson Electric Co. - Key news
Emerson Electric Co. - Key offerings
Emerson Electric Co. - Segment focus
SWOT

15.10 Eppendorf SE

Eppendorf SE - Overview
Eppendorf SE - Product / Service
Eppendorf SE - Key news
Eppendorf SE - Key offerings
SWOT

15.11 ILC Dover LP

ILC Dover LP - Overview
ILC Dover LP - Product / Service
ILC Dover LP - Key offerings
SWOT

15.12 Lonza Group Ltd.

Lonza Group Ltd. - Overview
Lonza Group Ltd. - Business segments
Lonza Group Ltd. - Key news
Lonza Group Ltd. - Key offerings
Lonza Group Ltd. - Segment focus
SWOT

15.13 Merck KGaA

Merck KGaA - Overview
Merck KGaA - Business segments
Merck KGaA - Key news
Merck KGaA - Key offerings
Merck KGaA - Segment focus
SWOT

15.14 Nova Biomedical Corp.

Nova Biomedical Corp. - Overview
Nova Biomedical Corp. - Product / Service
Nova Biomedical Corp. - Key offerings
SWOT

15.15 Repligen Corp.

Repligen Corp. - Overview
Repligen Corp. - Product / Service
Repligen Corp. - Key offerings
SWOT

15.16 Sartorius AG

Sartorius AG - Overview
Sartorius AG - Business segments
Sartorius AG - Key news
Sartorius AG - Key offerings
Sartorius AG - Segment focus
SWOT

15.17 Thermo Fisher Scientific Inc.

Thermo Fisher Scientific Inc. - Overview
Thermo Fisher Scientific Inc. - Business segments
Thermo Fisher Scientific Inc. - Key news
Thermo Fisher Scientific Inc. - Key offerings
Thermo Fisher Scientific Inc. - Segment focus
SWOT

15.18 Univercells SA

Univercells SA - Overview
Univercells SA - Product / Service
Univercells SA - Key offerings
SWOT

16. Appendix

16.1 Scope of the report

Market definition
Objectives
Notes and caveats

16.2 Inclusions and exclusions checklist

Inclusions checklist
Exclusions checklist

16.3 Currency conversion rates for US$

16.4 Research methodology

16.5 Data procurement

Information sources

16.6 Data validation

16.7 Validation techniques employed for market sizing

16.8 Data synthesis

16.9 360 degree market analysis

16.10 List of abbreviations

Research Methodology

Technavio presents a detailed picture of the market by way of study, synthesis, and summation of data from multiple sources. The analysts have presented the various facets of the market with a particular focus on identifying the key industry influencers. The data thus presented is comprehensive, reliable, and the result of extensive research, both primary and secondary.

INFORMATION SOURCES

Primary sources

  • Manufacturers and suppliers
  • Channel partners
  • Industry experts
  • Strategic decision makers

Secondary sources

  • Industry journals and periodicals
  • Government data
  • Financial reports of key industry players
  • Historical data
  • Press releases

DATA ANALYSIS

Data Synthesis

  • Collation of data
  • Estimation of key figures
  • Analysis of derived insights

Data Validation

  • Triangulation with data models
  • Reference against proprietary databases
  • Corroboration with industry experts

REPORT WRITING

Qualitative

  • Market drivers
  • Market challenges
  • Market trends
  • Five forces analysis

Quantitative

  • Market size and forecast
  • Market segmentation
  • Geographical insights
  • Competitive landscape

Interested in this report?

Get your sample now to see our research methodology and insights!

Download Now

Frequently Asked Questions

Bioprocess Technology market growth will increase by USD 55635.4 million during 2025-2029.

The Bioprocess Technology market is expected to grow at a CAGR of 11.4% during 2025-2029.

Bioprocess Technology market is segmented by Product type (Bioreactors, Bioprocess analyzers, Osmometers) Application (Cell and gene therapy, Monoclonal antibodies, Recombinant proteins) End-user (Biopharmaceutical companies, Contract manufacturing organizations, Academic research institutes, Others)

Boehringer Ingelheim GmbH, Catalent Inc., Charles River Laboratories, Corning Inc., Danaher Corp., Emerson Electric Co., Eppendorf SE, Fujifilm Diosynth Biotechnologies USA Inc., General Electric Co., ILC Dover LP, Koninklijke Philips NV, Lonza Group Ltd., Merck KGaA, Nova Biomedical Corp., Repligen Corp., Sartorius AG, STADA Arzneimittel AG, Thermo Fisher Scientific Inc., Univercells SA are a few of the key vendors in the Bioprocess Technology market.

North America will register the highest growth rate of 46.4% among the other regions. Therefore, the Bioprocess Technology market in North America is expected to garner significant business opportunities for the vendors during the forecast period.

US, Canada, Mexico, Germany, UK, France, Italy, Spain, The Netherlands, China, India, Japan, South Korea, Thailand, Indonesia, Brazil, Saudi Arabia, UAE, Turkey, Argentina, Colombia, South Africa, Israel

  • Increase in infectious diseases is the driving factor this market.

The Bioprocess Technology market vendors should focus on grabbing business opportunities from the Product type segment as it accounted for the largest market share in the base year.