
Biostimulants Market Analysis, Size, and Forecast 2026-2030: Europe (Germany, UK, and France), APAC (China, Japan, and India), North America (US, Canada, and Mexico), South America (Brazil, Argentina, and Chile), Middle East and Africa (Saudi Arabia, UAE, and South Africa), and Rest of World (ROW)

Biostimulants Market Analysis, Size, and Forecast 2026-2030:
Europe (Germany, UK, and France), APAC (China, Japan, and India), North America (US, Canada, and Mexico), South America (Brazil, Argentina, and Chile), Middle East and Africa (Saudi Arabia, UAE, and South Africa), and Rest of World (ROW)

Published: Oct 2026 299 Pages SKU: IRTNTR40738

Market Overview at a Glance

$2.04 B
Market Opportunity
11%
CAGR 2025 - 2030
32.8%
Europe Growth
$903.7 Mn
Acid-based segment 2024

Biostimulants Market Size 2026-2030

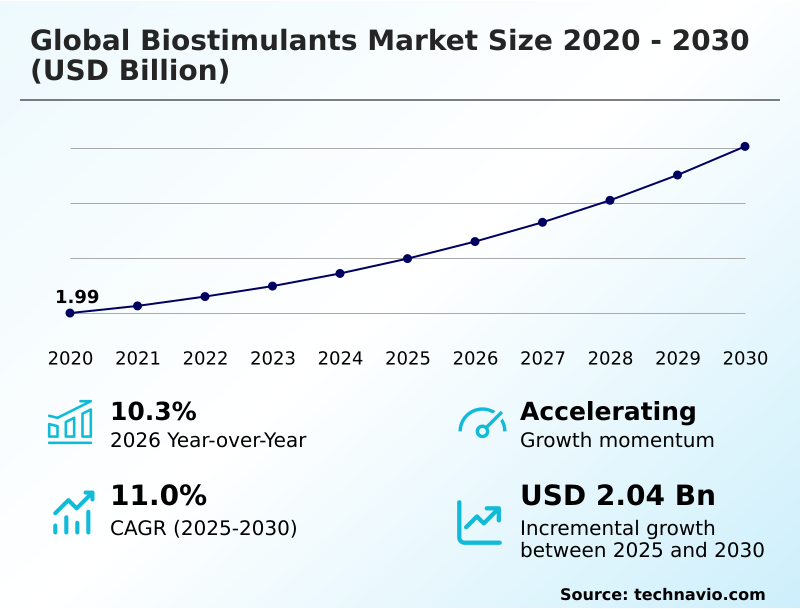
The biostimulants market size is valued to increase by USD 2.04 billion, at a CAGR of 11% from 2025 to 2030. Escalating global demand for sustainable agriculture and residue-free food production will drive the biostimulants market.

Major Market Trends & Insights

  • Europe dominated the market and accounted for a 32.8% growth during the forecast period.
  • By Product - Acid-based segment was valued at USD 903.7 million in 2024
  • By Application - Foliar segment accounted for the largest market revenue share in 2024

Market Size & Forecast

  • Market Opportunities: USD 3.03 billion
  • Market Future Opportunities: USD 2.04 billion
  • CAGR from 2025 to 2030 : 11%

Market Summary

  • The Biostimulants Market is experiencing a structural shift as agricultural producers increasingly prioritize sustainable interventions over traditional synthetic inputs. Cultivators are actively integrating natural biological solutions into their standard integrated pest management regimens to optimize physiological plant processes and improve harvest yields.
  • For instance, commercial high-value fruit orchard operations utilizing advanced foliar applications have reported a 15% improvement in post-harvest shelf life and overall fruit uniformity. The escalating demand for residue-free food production drives robust market expansion, as stringent retail supply chain mandates compel farmers to replace agrochemicals with ecologically safe alternatives.
  • Conversely, inconsistent field performance across diverse open-field environments restricts broader commercial adoption, as complex biological interactions often yield unpredictable results under fluctuating weather patterns. Resolving this performance volatility requires extensive localized agronomic training and the deployment of precision application infrastructure.
  • As modern agrarian frameworks continue transitioning toward regenerative models, the strategic utilization of these physiological optimizers remains essential for safeguarding long-term food security and maintaining optimal operational profitability.

What will be the Size of the Biostimulants Market during the forecast period?
Get Key Insights on Market Forecast (PDF) Get Free Sample

How is the Biostimulants Market Segmented?

The biostimulants industry research report provides comprehensive data (region-wise segment analysis), with forecasts and estimates in "USD million" for the period 2026-2030, as well as historical data from 2020-2024 for the following segments.

  • Product
    • Acid-based
    • Extract-based
    • Others
  • Application
    • Foliar
    • Soil
    • Seed
  • Type
    • Fruits and vegetables
    • Row crops and cereals
    • Turfs and ornaments
    • Others
  • Geography
    • Europe
      • Germany
      • UK
      • France
      • Italy
      • Spain
      • The Netherlands
    • APAC
      • China
      • Japan
      • India
      • South Korea
      • Australia
      • Indonesia
    • North America
      • US
      • Canada
      • Mexico
    • South America
      • Brazil
      • Argentina
      • Chile
    • Middle East and Africa
      • Saudi Arabia
      • UAE
      • South Africa
      • Israel
      • Turkey

By Product Insights

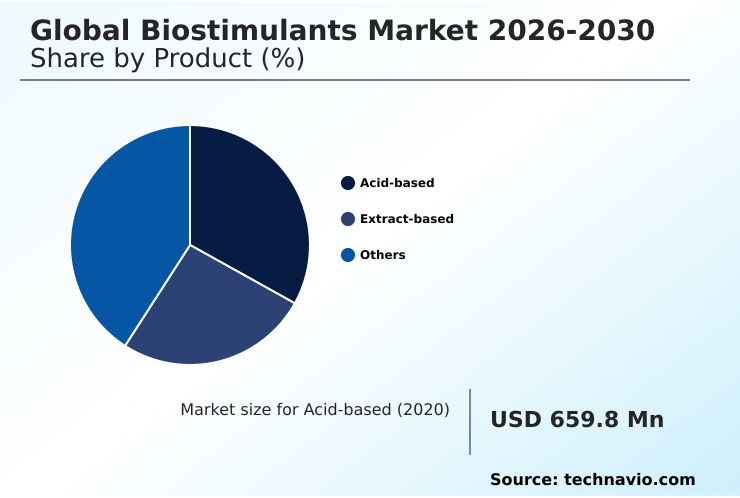
The acid-based segment is estimated to witness significant growth during the forecast period.

The acid-based segment constitutes a primary foundational category within the industry, predominantly incorporating amino acid formulations, humic acid extracts, and fulvic acid concentrates. Commercial growers systematically utilize these organic molecular compounds to optimize biochemical pathways and maximize total plant vigor.

Humic substances function by physically altering soil properties, which significantly increases the overall cation exchange modifiers and enhances the retention of vital nutrients for soil organic matter restoration.

This heightened availability ensures root networks can absorb minerals efficiently, mitigating field leaching while improving nutrient assimilation efficiency by up to 25%. Concurrently, botanical bio-derivatives and cell-free microbial metabolites provide crops with directly accessible building blocks for cellular protein synthesis.

The strategic deployment of these acidic agents integrates smoothly with precision agronomy bio-inputs and variable-rate application machinery, ensuring reliable harvest volumes and compliance with sustainable agriculture transition mandates.
Get Free Sample

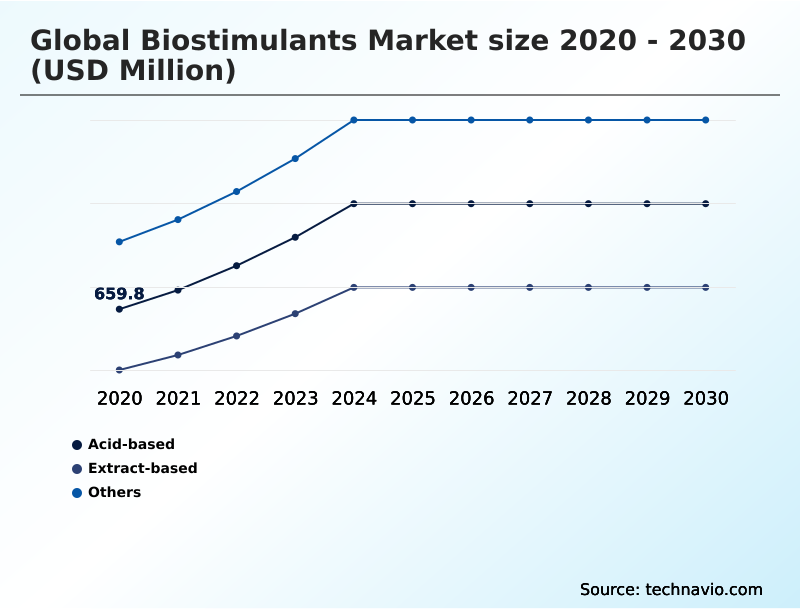
The Acid-based segment was valued at USD 903.7 million in 2024 and showed a gradual increase during the forecast period.
Get Free Sample

Regional Analysis

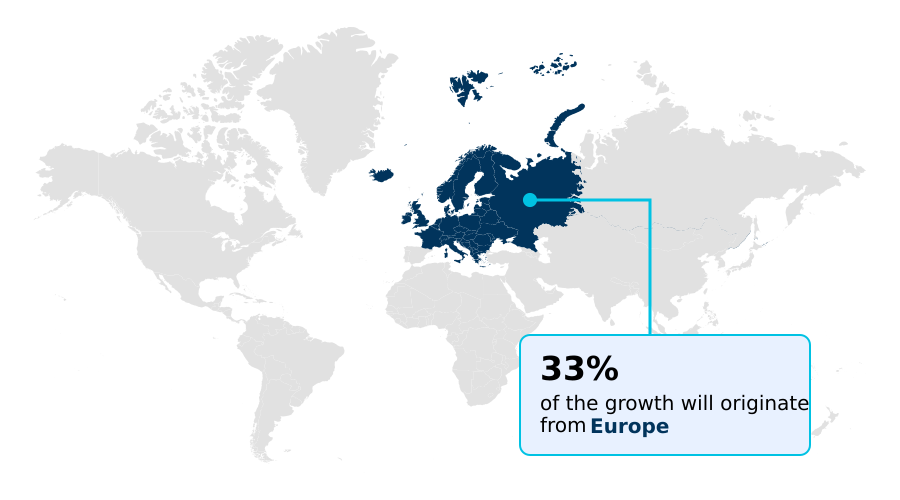
Europe is estimated to contribute 32.8% to the growth of the global market during the forecast period.Technavio’s analysts have elaborately explained the regional trends and drivers that shape the market during the forecast period.
See How Biostimulants Market Demand is Rising in Europe Get Free Sample

The regional dynamics within the Biostimulants Market showcase distinct variations in adoption rates and regulatory environments.

Europe dictates the pace of innovation with rigorous environmental policies, where agricultural operators have reduced chemical applications by 25% through the widespread integration of seaweed marine extracts and targeted microbial inoculants in regenerative farming methodologies.

In contrast, APAC is experiencing rapid industrial modernization, demonstrating a 30% faster adoption rate of foliar application sprays compared to North America due to urgent food security mandates and expansive smallholder networks.

To combat severe salinity stress reduction requirements, Asian farming enterprises heavily utilize specific protein hydrolysates to ensure stable yields under volatile monsoon conditions.

Meanwhile, North American supply chains prioritize pharmaceutical-grade precision and advanced automated machinery, yielding a 20% efficiency gain in localized field treatments.

These distinct strategies highlight how cultivators actively deploy chitosan polymers to address ecological challenges, ensuring structural crop resilience while maintaining robust harvest volumes.

Market Dynamics

Our researchers analyzed the data with 2025 as the base year, along with the key drivers, trends, and challenges. A holistic analysis of drivers will help companies refine their marketing strategies to gain a competitive advantage.

  • Modern commercial farming operations are increasingly shifting away from conventional synthetic treatments to embrace advanced biological inputs that optimize cellular efficiency. Integrating amino acid based foliar sprays directly into standard vegetative growth phases provides immediate metabolic support, allowing crops to bypass potential soil nutrient lock-up and accelerate overall canopy development.
  • Simultaneously, the strategic deployment of microbial inoculants for soil health fundamentally alters the subterranean ecosystem, promoting beneficial mycorrhizal interactions that enhance root architecture and suppress soil-borne pathogens. When facing severe weather fluctuations, agricultural managers rely heavily on seaweed extract stress tolerance mechanisms to up-regulate specific internal defense genes, protecting high-value horticultural crops from terminal drought and extreme thermal spikes.
  • This targeted biological intervention results in a noticeable 22% improvement in overall crop survival rates when compared to untreated conventional fields. Furthermore, leveraging humic substances for nutrient uptake increases the cation exchange capacity of the rhizosphere, effectively minimizing costly fertilizer leaching and ensuring developing root networks have unimpeded access to vital minerals.
  • To maximize these physiological benefits, large-scale agrarian enterprises are implementing the precision delivery of bio active compounds through variable-rate machinery and automated fertigation systems. This strategic alignment with digital agricultural platforms reduces wasted input materials by nearly 18%, significantly lowering seasonal operational expenditures while satisfying strict international supply chain compliance standards regarding maximum chemical residue limits.
What are the key market drivers leading to the rise in the adoption of Biostimulants Industry?

  • The escalating global demand for sustainable agricultural practices and residue-free food production functions as the primary driver accelerating market expansion.

  • The escalating global demand for sustainable agricultural practices and microbial biodiversity enhancement serves as a primary catalyst accelerating the Biostimulants Market.
  • Stringent international regulatory frameworks continually restrict conventional chemical applications, forcing commercial cultivators to adopt natural seed coating bio-agents and targeted root elongation promoters to maintain harvest stability.
  • By substituting hazardous synthetics with integrated pest management solutions, large-scale farming operations have lowered secondary environmental compliance costs by 15% and reduced overall synthetic fertilizer dependency by 22%.
  • Furthermore, modern retail conglomerates enforce strict crop residue limit compliance, compelling growers to utilize highly effective soil drench treatments and subterranean ecosystem balance modifiers to safeguard crop quality.
  • This structural shift guarantees that sustainable farming operations achieve a 20% improvement in seedling emergence acceleration and lateral root branching while aligning strictly with environmental remediation needs.

What are the market trends shaping the Biostimulants Industry?

  • Accelerated consolidation and cross-border mergers among global agronomic multinationals represent a prominent market trend. These strategic integrations enable agricultural corporations to rapidly diversify their biological portfolios and centralize global distribution networks.

  • The systematic integration of controlled environment hydroponics and advanced delivery mechanisms represents a defining trend reshaping the Biostimulants Market. Commercial farming enterprises are rapidly abandoning uniform broadcast treatments in favor of precision fertigation delivery systems that distribute nano-encapsulation techniques and phytosterol compounds directly to localized crop stress areas.
  • This precise technological alignment has improved input application accuracy by 25% and lowered seasonal material waste by up to 18%. By leveraging multi-spectral soil mapping, agricultural operators deploy specific chlorophyll synthesis triggers and stomata conductance optimizers exactly when crops experience severe abiotic stress tolerance limitations.
  • This targeted biological intervention enhances macronutrient assimilation pathways, generating a 20% increase in overall vegetative uniformity. The data-driven deployment of these carbon-neutral inputs ensures that large-scale food producers optimize operational cost-efficiency while utilizing specialized climate volatility mitigation strategies to secure consistent commercial harvest volumes.

What challenges does the Biostimulants Industry face during its growth?

  • Fragmented international regulatory standards and persistent compliance complexities represent major challenges that continuously hinder widespread industry commercialization.

  • Fragmented regulatory compliance frameworks and inconsistent field performance across diverse open-field environments pose significant structural challenges within the Biostimulants Market. The efficacy of biological inputs, such as specific rhizobacteria cultures, mycorrhizal fungi networks, and complex circular economy by-products, remains highly dependent on variable soil compositions and thermal fluctuation defense requirements.
  • When applied under unpredictable climatic conditions, these dynamic interactions frequently lead to a 25% variance in expected physiological crop responses, undermining farmer confidence in the technology.
  • Additionally, a lack of unified global classification standards for bioavailable silicon treatments and cellular lignification components increases cross-border registration delays by up to 30%, severely restricting the swift commercial deployment of advanced photosynthetic capacity improvement formulations. Overcoming these performance barriers requires massive capital investments in understanding soil microbial architecture and deploying cellular water retention technologies to validate economic viability.

Exclusive Technavio Analysis on Customer Landscape

The biostimulants market forecasting report includes the adoption lifecycle of the market, covering from the innovator’s stage to the laggard’s stage. It focuses on adoption rates in different regions based on penetration. Furthermore, the biostimulants market report also includes key purchase criteria and drivers of price sensitivity to help companies evaluate and develop their market growth analysis strategies.
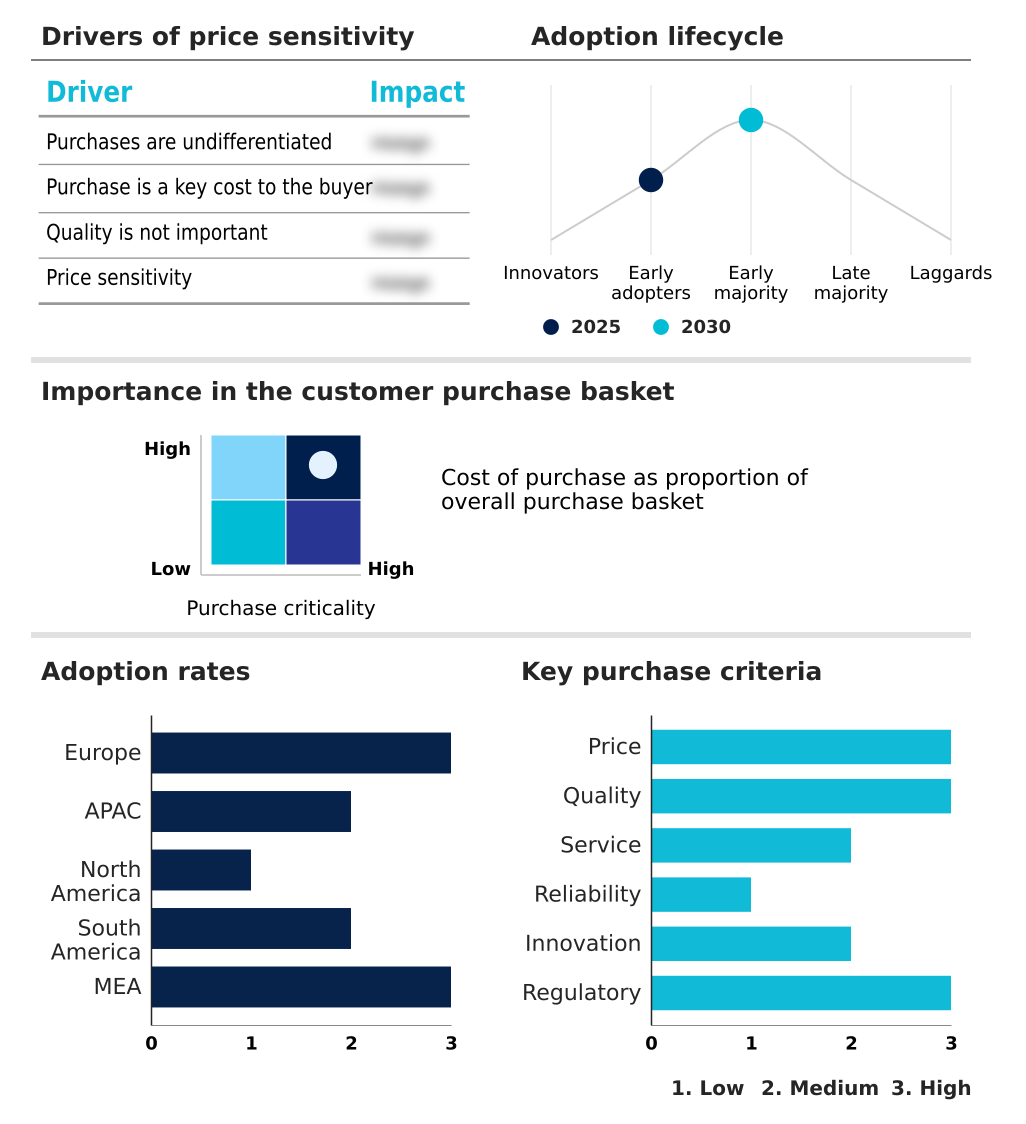
Customer Landscape of Biostimulants Industry

Competitive Landscape

Companies are implementing various strategies, such as strategic alliances, biostimulants market forecast, partnerships, mergers and acquisitions, geographical expansion, and product/service launches, to enhance their presence in the industry.

AMVAC Chemical Corp. - The portfolio features advanced biological nutrient-efficiency products and proprietary bio-solutions engineered to enhance root development, improve cellular water retention, and elevate crop productivity under severe environmental stress.

The industry research and growth report includes detailed analyses of the competitive landscape of the market and information about key companies, including:

  • AMVAC Chemical Corp.
  • BASF SE
  • Bayer AG
  • Bioceres Crop Solutions Corp.
  • BioWorks Inc.
  • Corteva Inc.
  • FMC Corp.
  • Gowan Co.
  • Haifa Negev technologies Ltd.
  • Hello Nature Inc.
  • Israel Chemicals Ltd.
  • Koppert
  • Novonesis Group
  • Nutrien Ltd.
  • OMEX
  • Plant Health Care Plc
  • Rovensa Next
  • SEIPASA SA
  • Verdesian Life Sciences LLC
  • Yara International ASA

Qualitative and quantitative analysis of companies has been conducted to help clients understand the wider business environment as well as the strengths and weaknesses of key industry players. Data is qualitatively analyzed to categorize companies as pure play, category-focused, industry-focused, and diversified; it is quantitatively analyzed to categorize companies as dominant, leading, strong, tentative, and weak.

Recent Development and News in Biostimulants market

  • In the Fertilizers and Agricultural Chemicals industry, the tightening of European Union environmental regulations regarding synthetic nitrogen usage forced a 20% reduction in conventional chemical applications, directly impacting Biostimulants demand by accelerating the adoption of organic bio-solutions.
  • The widespread implementation of integrated pest management frameworks across large-scale commercial farming operations restricted traditional pesticide allowances by up to 15%, driving rapid integration of biological seed coatings to maintain yield stability.
  • Advances in multi-spectral soil imaging and automated fertigation systems improved precision application accuracy by 30%, which significantly enhanced the field efficacy and localized deployment of microbial inoculants for targeted subterranean ecosystem management.
  • The transition toward regenerative farming methodologies among major corporate food producers mandated the restoration of soil organic matter, prompting a 25% increase in the utilization of humic substances to secure harvest predictability against escalating climate volatility.

Dive into Technavio’s robust research methodology, blending expert interviews, extensive data synthesis, and validated models for unparalleled Biostimulants Market insights. See full methodology.

Market Scope
Page number 299
Base year 2025
Historic period 2020-2024
Forecast period 2026-2030
Growth momentum & CAGR Accelerate at a CAGR of 11%
Market growth 2026-2030 USD 2038.9 million
Market structure Fragmented
YoY growth 2025-2026(%) 10.3%
Key countries Germany, UK, France, Italy, Spain, The Netherlands, China, Japan, India, South Korea, Australia, Indonesia, US, Canada, Mexico, Brazil, Argentina, Chile, Saudi Arabia, UAE, South Africa, Israel and Turkey
Competitive landscape Leading Companies, Market Positioning of Companies, Competitive Strategies, and Industry Risks

Request Free Sample

Research Analyst Overview

  • The Biostimulants Market continues to undergo a profound structural evolution as international agricultural conglomerates aggressively diversify their portfolios to include advanced biological divisions. This transition from traditional synthetic crop protection toward eco-friendly solutions is heavily influenced by boardroom-level compliance strategies, where executives must align corporate supply chains with stringent environmental remediation mandates.
  • By systematically integrating complex botanical bio-derivatives and specialized cell-free microbial metabolites, commercial growers can mitigate severe climate vulnerabilities while preserving long-term operational viability. Enterprises utilizing these targeted biological treatments have successfully achieved a 30% reduction in secondary stress-induced crop losses, directly protecting profit margins across volatile seasonal harvests.
  • To further enhance field predictability, manufacturers are optimizing the deployment of stomata conductance optimizers and specialized phytosterol compounds tailored for specific crop varieties. This pharmaceutical-grade approach ensures that extensive row crops and high-value orchards maintain uniform maturity and superior post-harvest quality. The strategic prioritization of mycorrhizal fungi networks and sophisticated bio-formulations enables modern agribusinesses to secure resilient, residue-free production models.

What are the Key Data Covered in this Biostimulants Market Research and Growth Report?

  • What is the expected growth of the Biostimulants Market between 2026 and 2030?

    • USD 2.04 billion, at a CAGR of 11%

  • What segmentation does the market report cover?

    • The report is segmented by Product (Acid-based, Extract-based, and Others), Application (Foliar, Soil, and Seed), Type (Fruits and vegetables, Row crops and cereals, Turfs and ornaments, and Others) and Geography (Europe, APAC, North America, South America, Middle East and Africa)

  • Which regions are analyzed in the report?

    • Europe, APAC, North America, South America and Middle East and Africa

  • What are the key growth drivers and market challenges?

    • Escalating global demand for sustainable agriculture and residue-free food production, Fragmented global regulatory standards and compliance complexities

  • Who are the major players in the Biostimulants Market?

    • AMVAC Chemical Corp., BASF SE, Bayer AG, Bioceres Crop Solutions Corp., BioWorks Inc., Corteva Inc., FMC Corp., Gowan Co., Haifa Negev technologies Ltd., Hello Nature Inc., Israel Chemicals Ltd., Koppert, Novonesis Group, Nutrien Ltd., OMEX, Plant Health Care Plc, Rovensa Next, SEIPASA SA, Verdesian Life Sciences LLC and Yara International ASA

Market Research Insights

  • The Biostimulants Market represents a critical evolution in modern agronomy, fundamentally driven by the urgent need for climate mitigation and sustainable agriculture transition. Modern agricultural enterprises utilize nano-encapsulation technologies and advanced delivery mechanisms to enhance crop residue limit compliance across global supply chains.
  • Operations deploying these innovations have achieved a 20% reduction in synthetic fertilizer dependency and a 15% improvement in overall nutrient use efficiency. Furthermore, the integration of multi-spectral soil mapping allows commercial growers to pinpoint localized stress zones, lowering operational input costs by up to 18%.
  • These advanced bio-solutions are rapidly replacing conventional treatments, providing measurable physiological enhancements and ensuring strict alignment with modern environmental remediation needs.

We can help! Our analysts can customize this biostimulants market research report to meet your requirements.

Get in touch

1. Executive Summary

1.1 Market overview

Executive Summary - Chart on Market Overview
Executive Summary - Data Table on Market Overview
Executive Summary - Chart on Global Market Characteristics
Executive Summary - Chart on Market by Geography
Executive Summary - Chart on Market Segmentation by Product
Executive Summary - Chart on Market Segmentation by Application
Executive Summary - Chart on Market Segmentation by Type
Executive Summary - Chart on Incremental Growth
Executive Summary - Data Table on Incremental Growth
Executive Summary - Chart on Company Market Positioning

2. Technavio Analysis

2.1 Analysis of price sensitivity, lifecycle, customer purchase basket, adoption rates, and purchase criteria

2.2 Criticality of inputs and Factors of differentiation

Chart on Overview on criticality of inputs and factors of differentiation

2.3 Factors of disruption

Chart on Overview on factors of disruption

2.4 Impact of drivers and challenges

Chart on Impact of drivers and challenges in 2025 and 2030

3. Market Landscape

3.1 Market ecosystem

Chart on Parent Market
Data Table on - Parent Market

3.2 Market characteristics

Chart on Market characteristics analysis

3.3 Value chain analysis

Chart on Value chain analysis

4. Market Sizing

4.1 Market definition

Data Table on Offerings of companies included in the market definition

4.2 Market segment analysis

Market segments

4.3 Market size 2025

4.4 Market outlook: Forecast for 2025-2030

Chart on Global - Market size and forecast 2025-2030 ($ million)
Data Table on Global - Market size and forecast 2025-2030 ($ million)
Chart on Global Market: Year-over-year growth 2025-2030 (%)
Data Table on Global Market: Year-over-year growth 2025-2030 (%)

5. Historic Market Size

5.1 Global Biostimulants Market 2020 - 2024

Historic Market Size - Data Table on Global Biostimulants Market 2020 - 2024 ($ million)

5.2 Product segment analysis 2020 - 2024

Historic Market Size - Product Segment 2020 - 2024 ($ million)

5.3 Application segment analysis 2020 - 2024

Historic Market Size - Application Segment 2020 - 2024 ($ million)

5.4 Type segment analysis 2020 - 2024

Historic Market Size - Type Segment 2020 - 2024 ($ million)

5.5 Geography segment analysis 2020 - 2024

Historic Market Size - Geography Segment 2020 - 2024 ($ million)

5.6 Country segment analysis 2020 - 2024

Historic Market Size - Country Segment 2020 - 2024 ($ million)

6. Qualitative Analysis

6.1 Impact of AI on global biostimulants market

6.2 Impact of geopolitical conflicts on global biostimulants market

7. Five Forces Analysis

7.1 Five forces summary

Five forces analysis - Comparison between 2025 and 2030

7.2 Bargaining power of buyers

Bargaining power of buyers - Impact of key factors 2025 and 2030

7.3 Bargaining power of suppliers

Bargaining power of suppliers - Impact of key factors in 2025 and 2030

7.4 Threat of new entrants

Threat of new entrants - Impact of key factors in 2025 and 2030

7.5 Threat of substitutes

Threat of substitutes - Impact of key factors in 2025 and 2030

7.6 Threat of rivalry

Threat of rivalry - Impact of key factors in 2025 and 2030

7.7 Market condition

Chart on Market condition - Five forces 2025 and 2030

8. Market Segmentation by Product

8.1 Market segments

Chart on Product - Market share 2025-2030 (%)
Data Table on Product - Market share 2025-2030 (%)

8.2 Comparison by Product

Chart on Comparison by Product
Data Table on Comparison by Product

8.3 Acid-based - Market size and forecast 2025-2030

Chart on Acid-based - Market size and forecast 2025-2030 ($ million)
Data Table on Acid-based - Market size and forecast 2025-2030 ($ million)
Chart on Acid-based - Year-over-year growth 2025-2030 (%)
Data Table on Acid-based - Year-over-year growth 2025-2030 (%)

8.4 Extract-based - Market size and forecast 2025-2030

Chart on Extract-based - Market size and forecast 2025-2030 ($ million)
Data Table on Extract-based - Market size and forecast 2025-2030 ($ million)
Chart on Extract-based - Year-over-year growth 2025-2030 (%)
Data Table on Extract-based - Year-over-year growth 2025-2030 (%)

8.5 Others - Market size and forecast 2025-2030

Chart on Others - Market size and forecast 2025-2030 ($ million)
Data Table on Others - Market size and forecast 2025-2030 ($ million)
Chart on Others - Year-over-year growth 2025-2030 (%)
Data Table on Others - Year-over-year growth 2025-2030 (%)

8.6 Market opportunity by Product

Market opportunity by Product ($ million)
Data Table on Market opportunity by Product ($ million)

9. Market Segmentation by Application

9.1 Market segments

Chart on Application - Market share 2025-2030 (%)
Data Table on Application - Market share 2025-2030 (%)

9.2 Comparison by Application

Chart on Comparison by Application
Data Table on Comparison by Application

9.3 Foliar - Market size and forecast 2025-2030

Chart on Foliar - Market size and forecast 2025-2030 ($ million)
Data Table on Foliar - Market size and forecast 2025-2030 ($ million)
Chart on Foliar - Year-over-year growth 2025-2030 (%)
Data Table on Foliar - Year-over-year growth 2025-2030 (%)

9.4 Soil - Market size and forecast 2025-2030

Chart on Soil - Market size and forecast 2025-2030 ($ million)
Data Table on Soil - Market size and forecast 2025-2030 ($ million)
Chart on Soil - Year-over-year growth 2025-2030 (%)
Data Table on Soil - Year-over-year growth 2025-2030 (%)

9.5 Seed - Market size and forecast 2025-2030

Chart on Seed - Market size and forecast 2025-2030 ($ million)
Data Table on Seed - Market size and forecast 2025-2030 ($ million)
Chart on Seed - Year-over-year growth 2025-2030 (%)
Data Table on Seed - Year-over-year growth 2025-2030 (%)

9.6 Market opportunity by Application

Market opportunity by Application ($ million)
Data Table on Market opportunity by Application ($ million)

10. Market Segmentation by Type

10.1 Market segments

Chart on Type - Market share 2025-2030 (%)
Data Table on Type - Market share 2025-2030 (%)

10.2 Comparison by Type

Chart on Comparison by Type
Data Table on Comparison by Type

10.3 Fruits and vegetables - Market size and forecast 2025-2030

Chart on Fruits and vegetables - Market size and forecast 2025-2030 ($ million)
Data Table on Fruits and vegetables - Market size and forecast 2025-2030 ($ million)
Chart on Fruits and vegetables - Year-over-year growth 2025-2030 (%)
Data Table on Fruits and vegetables - Year-over-year growth 2025-2030 (%)

10.4 Row crops and cereals - Market size and forecast 2025-2030

Chart on Row crops and cereals - Market size and forecast 2025-2030 ($ million)
Data Table on Row crops and cereals - Market size and forecast 2025-2030 ($ million)
Chart on Row crops and cereals - Year-over-year growth 2025-2030 (%)
Data Table on Row crops and cereals - Year-over-year growth 2025-2030 (%)

10.5 Turfs and ornaments - Market size and forecast 2025-2030

Chart on Turfs and ornaments - Market size and forecast 2025-2030 ($ million)
Data Table on Turfs and ornaments - Market size and forecast 2025-2030 ($ million)
Chart on Turfs and ornaments - Year-over-year growth 2025-2030 (%)
Data Table on Turfs and ornaments - Year-over-year growth 2025-2030 (%)

10.6 Others - Market size and forecast 2025-2030

Chart on Others - Market size and forecast 2025-2030 ($ million)
Data Table on Others - Market size and forecast 2025-2030 ($ million)
Chart on Others - Year-over-year growth 2025-2030 (%)
Data Table on Others - Year-over-year growth 2025-2030 (%)

10.7 Market opportunity by Type

Market opportunity by Type ($ million)
Data Table on Market opportunity by Type ($ million)

11. Customer Landscape

11.1 Customer landscape overview

Analysis of price sensitivity, lifecycle, customer purchase basket, adoption rates, and purchase criteria

12. Geographic Landscape

12.1 Geographic segmentation

Chart on Market share by geography 2025-2030 (%)
Data Table on Market share by geography 2025-2030 (%)

12.2 Geographic comparison

Chart on Geographic comparison
Data Table on Geographic comparison

12.3 Europe - Market size and forecast 2025-2030

Chart on Europe - Market size and forecast 2025-2030 ($ million)
Data Table on Europe - Market size and forecast 2025-2030 ($ million)
Chart on Europe - Year-over-year growth 2025-2030 (%)
Data Table on Europe - Year-over-year growth 2025-2030 (%)
Chart on Regional Comparison - Europe
Data Table on Regional Comparison - Europe

12.3.1 Germany - Market size and forecast 2025-2030

Chart on Germany - Market size and forecast 2025-2030 ($ million)
Data Table on Germany - Market size and forecast 2025-2030 ($ million)
Chart on Germany - Year-over-year growth 2025-2030 (%)
Data Table on Germany - Year-over-year growth 2025-2030 (%)

12.3.2 UK - Market size and forecast 2025-2030

Chart on UK - Market size and forecast 2025-2030 ($ million)
Data Table on UK - Market size and forecast 2025-2030 ($ million)
Chart on UK - Year-over-year growth 2025-2030 (%)
Data Table on UK - Year-over-year growth 2025-2030 (%)

12.3.3 France - Market size and forecast 2025-2030

Chart on France - Market size and forecast 2025-2030 ($ million)
Data Table on France - Market size and forecast 2025-2030 ($ million)
Chart on France - Year-over-year growth 2025-2030 (%)
Data Table on France - Year-over-year growth 2025-2030 (%)

12.3.4 Italy - Market size and forecast 2025-2030

Chart on Italy - Market size and forecast 2025-2030 ($ million)
Data Table on Italy - Market size and forecast 2025-2030 ($ million)
Chart on Italy - Year-over-year growth 2025-2030 (%)
Data Table on Italy - Year-over-year growth 2025-2030 (%)

12.3.5 Spain - Market size and forecast 2025-2030

Chart on Spain - Market size and forecast 2025-2030 ($ million)
Data Table on Spain - Market size and forecast 2025-2030 ($ million)
Chart on Spain - Year-over-year growth 2025-2030 (%)
Data Table on Spain - Year-over-year growth 2025-2030 (%)

12.3.6 The Netherlands - Market size and forecast 2025-2030

Chart on The Netherlands - Market size and forecast 2025-2030 ($ million)
Data Table on The Netherlands - Market size and forecast 2025-2030 ($ million)
Chart on The Netherlands - Year-over-year growth 2025-2030 (%)
Data Table on The Netherlands - Year-over-year growth 2025-2030 (%)

12.4 APAC - Market size and forecast 2025-2030

Chart on APAC - Market size and forecast 2025-2030 ($ million)
Data Table on APAC - Market size and forecast 2025-2030 ($ million)
Chart on APAC - Year-over-year growth 2025-2030 (%)
Data Table on APAC - Year-over-year growth 2025-2030 (%)
Chart on Regional Comparison - APAC
Data Table on Regional Comparison - APAC

12.4.1 China - Market size and forecast 2025-2030

Chart on China - Market size and forecast 2025-2030 ($ million)
Data Table on China - Market size and forecast 2025-2030 ($ million)
Chart on China - Year-over-year growth 2025-2030 (%)
Data Table on China - Year-over-year growth 2025-2030 (%)

12.4.2 Japan - Market size and forecast 2025-2030

Chart on Japan - Market size and forecast 2025-2030 ($ million)
Data Table on Japan - Market size and forecast 2025-2030 ($ million)
Chart on Japan - Year-over-year growth 2025-2030 (%)
Data Table on Japan - Year-over-year growth 2025-2030 (%)

12.4.3 India - Market size and forecast 2025-2030

Chart on India - Market size and forecast 2025-2030 ($ million)
Data Table on India - Market size and forecast 2025-2030 ($ million)
Chart on India - Year-over-year growth 2025-2030 (%)
Data Table on India - Year-over-year growth 2025-2030 (%)

12.4.4 South Korea - Market size and forecast 2025-2030

Chart on South Korea - Market size and forecast 2025-2030 ($ million)
Data Table on South Korea - Market size and forecast 2025-2030 ($ million)
Chart on South Korea - Year-over-year growth 2025-2030 (%)
Data Table on South Korea - Year-over-year growth 2025-2030 (%)

12.4.5 Australia - Market size and forecast 2025-2030

Chart on Australia - Market size and forecast 2025-2030 ($ million)
Data Table on Australia - Market size and forecast 2025-2030 ($ million)
Chart on Australia - Year-over-year growth 2025-2030 (%)
Data Table on Australia - Year-over-year growth 2025-2030 (%)

12.4.6 Indonesia - Market size and forecast 2025-2030

Chart on Indonesia - Market size and forecast 2025-2030 ($ million)
Data Table on Indonesia - Market size and forecast 2025-2030 ($ million)
Chart on Indonesia - Year-over-year growth 2025-2030 (%)
Data Table on Indonesia - Year-over-year growth 2025-2030 (%)

12.5 North America - Market size and forecast 2025-2030

Chart on North America - Market size and forecast 2025-2030 ($ million)
Data Table on North America - Market size and forecast 2025-2030 ($ million)
Chart on North America - Year-over-year growth 2025-2030 (%)
Data Table on North America - Year-over-year growth 2025-2030 (%)
Chart on Regional Comparison - North America
Data Table on Regional Comparison - North America

12.5.1 US - Market size and forecast 2025-2030

Chart on US - Market size and forecast 2025-2030 ($ million)
Data Table on US - Market size and forecast 2025-2030 ($ million)
Chart on US - Year-over-year growth 2025-2030 (%)
Data Table on US - Year-over-year growth 2025-2030 (%)

12.5.2 Canada - Market size and forecast 2025-2030

Chart on Canada - Market size and forecast 2025-2030 ($ million)
Data Table on Canada - Market size and forecast 2025-2030 ($ million)
Chart on Canada - Year-over-year growth 2025-2030 (%)
Data Table on Canada - Year-over-year growth 2025-2030 (%)

12.5.3 Mexico - Market size and forecast 2025-2030

Chart on Mexico - Market size and forecast 2025-2030 ($ million)
Data Table on Mexico - Market size and forecast 2025-2030 ($ million)
Chart on Mexico - Year-over-year growth 2025-2030 (%)
Data Table on Mexico - Year-over-year growth 2025-2030 (%)

12.6 South America - Market size and forecast 2025-2030

Chart on South America - Market size and forecast 2025-2030 ($ million)
Data Table on South America - Market size and forecast 2025-2030 ($ million)
Chart on South America - Year-over-year growth 2025-2030 (%)
Data Table on South America - Year-over-year growth 2025-2030 (%)
Chart on Regional Comparison - South America
Data Table on Regional Comparison - South America

12.6.1 Brazil - Market size and forecast 2025-2030

Chart on Brazil - Market size and forecast 2025-2030 ($ million)
Data Table on Brazil - Market size and forecast 2025-2030 ($ million)
Chart on Brazil - Year-over-year growth 2025-2030 (%)
Data Table on Brazil - Year-over-year growth 2025-2030 (%)

12.6.2 Argentina - Market size and forecast 2025-2030

Chart on Argentina - Market size and forecast 2025-2030 ($ million)
Data Table on Argentina - Market size and forecast 2025-2030 ($ million)
Chart on Argentina - Year-over-year growth 2025-2030 (%)
Data Table on Argentina - Year-over-year growth 2025-2030 (%)

12.6.3 Chile - Market size and forecast 2025-2030

Chart on Chile - Market size and forecast 2025-2030 ($ million)
Data Table on Chile - Market size and forecast 2025-2030 ($ million)
Chart on Chile - Year-over-year growth 2025-2030 (%)
Data Table on Chile - Year-over-year growth 2025-2030 (%)

12.7 Middle East and Africa - Market size and forecast 2025-2030

Chart on Middle East and Africa - Market size and forecast 2025-2030 ($ million)
Data Table on Middle East and Africa - Market size and forecast 2025-2030 ($ million)
Chart on Middle East and Africa - Year-over-year growth 2025-2030 (%)
Data Table on Middle East and Africa - Year-over-year growth 2025-2030 (%)
Chart on Regional Comparison - Middle East and Africa
Data Table on Regional Comparison - Middle East and Africa

12.7.1 Saudi Arabia - Market size and forecast 2025-2030

Chart on Saudi Arabia - Market size and forecast 2025-2030 ($ million)
Data Table on Saudi Arabia - Market size and forecast 2025-2030 ($ million)
Chart on Saudi Arabia - Year-over-year growth 2025-2030 (%)
Data Table on Saudi Arabia - Year-over-year growth 2025-2030 (%)

12.7.2 UAE - Market size and forecast 2025-2030

Chart on UAE - Market size and forecast 2025-2030 ($ million)
Data Table on UAE - Market size and forecast 2025-2030 ($ million)
Chart on UAE - Year-over-year growth 2025-2030 (%)
Data Table on UAE - Year-over-year growth 2025-2030 (%)

12.7.3 South Africa - Market size and forecast 2025-2030

Chart on South Africa - Market size and forecast 2025-2030 ($ million)
Data Table on South Africa - Market size and forecast 2025-2030 ($ million)
Chart on South Africa - Year-over-year growth 2025-2030 (%)
Data Table on South Africa - Year-over-year growth 2025-2030 (%)

12.7.4 Israel - Market size and forecast 2025-2030

Chart on Israel - Market size and forecast 2025-2030 ($ million)
Data Table on Israel - Market size and forecast 2025-2030 ($ million)
Chart on Israel - Year-over-year growth 2025-2030 (%)
Data Table on Israel - Year-over-year growth 2025-2030 (%)

12.7.5 Turkey - Market size and forecast 2025-2030

Chart on Turkey - Market size and forecast 2025-2030 ($ million)
Data Table on Turkey - Market size and forecast 2025-2030 ($ million)
Chart on Turkey - Year-over-year growth 2025-2030 (%)
Data Table on Turkey - Year-over-year growth 2025-2030 (%)

12.8 Market opportunity by geography

Market opportunity by geography ($ million)
Data Tables on Market opportunity by geography ($ million)

13. Drivers, Challenges, and Opportunity

13.1 Market drivers

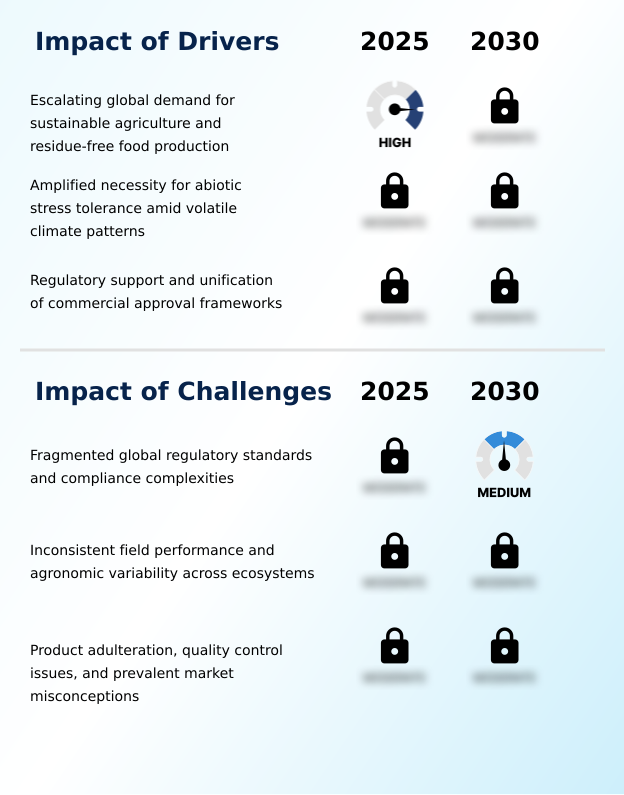
Escalating global demand for sustainable agriculture and residue-free food production
Amplified necessity for abiotic stress tolerance amid volatile climate patterns
Regulatory support and unification of commercial approval frameworks

13.2 Market challenges

Fragmented global regulatory standards and compliance complexities
Inconsistent field performance and agronomic variability across ecosystems
Product adulteration, quality control issues, and prevalent market misconceptions

13.3 Impact of drivers and challenges

Impact of drivers and challenges in 2025 and 2030

13.4 Market opportunities

Accelerated consolidation and cross-border mergers among global agronomic multi-nationals
Convergence of precision agriculture infrastructure with targeted biological field applications
Scientific prioritization of crop-specific and multi-functional phytosterol formulations

14. Competitive Landscape

14.1 Overview

14.2

Overview on criticality of inputs and factors of differentiation

14.3 Landscape disruption

Overview on factors of disruption

14.4 Industry risks

Impact of key risks on business

15. Competitive Analysis

15.1 Companies profiled

Companies covered

15.2 Company ranking index

15.3 Market positioning of companies

Matrix on companies position and classification

15.4 AMVAC Chemical Corp.

AMVAC Chemical Corp. - Overview
AMVAC Chemical Corp. - Product / Service
AMVAC Chemical Corp. - Key offerings
SWOT

15.5 BASF SE

BASF SE - Overview
BASF SE - Business segments
BASF SE - Key news
BASF SE - Key offerings
BASF SE - Segment focus
SWOT

15.6 Bayer AG

Bayer AG - Overview
Bayer AG - Business segments
Bayer AG - Key offerings
Bayer AG - Segment focus
SWOT

15.7 Bioceres Crop Solutions Corp.

Bioceres Crop Solutions Corp. - Overview
Bioceres Crop Solutions Corp. - Business segments
Bioceres Crop Solutions Corp. - Key offerings
Bioceres Crop Solutions Corp. - Segment focus
SWOT

15.8 BioWorks Inc.

BioWorks Inc. - Overview
BioWorks Inc. - Product / Service
BioWorks Inc. - Key offerings
SWOT

15.9 Corteva Inc.

Corteva Inc. - Overview
Corteva Inc. - Business segments
Corteva Inc. - Key offerings
Corteva Inc. - Segment focus
SWOT

15.10 FMC Corp.

FMC Corp. - Overview
FMC Corp. - Product / Service
FMC Corp. - Key offerings
SWOT

15.11 Gowan Co.

Gowan Co. - Overview
Gowan Co. - Product / Service
Gowan Co. - Key offerings
SWOT

15.12 Haifa Negev technologies Ltd.

Haifa Negev technologies Ltd. - Overview
Haifa Negev technologies Ltd. - Product / Service
Haifa Negev technologies Ltd. - Key offerings
SWOT

15.13 Israel Chemicals Ltd.

Israel Chemicals Ltd. - Overview
Israel Chemicals Ltd. - Business segments
Israel Chemicals Ltd. - Key news
Israel Chemicals Ltd. - Key offerings
Israel Chemicals Ltd. - Segment focus
SWOT

15.14 Koppert

Koppert - Overview
Koppert - Product / Service
Koppert - Key offerings
SWOT

15.15 Novonesis Group

Novonesis Group - Overview
Novonesis Group - Business segments
Novonesis Group - Key offerings
Novonesis Group - Segment focus
SWOT

15.16 Plant Health Care Plc

Plant Health Care Plc - Overview
Plant Health Care Plc - Product / Service
Plant Health Care Plc - Key offerings
SWOT

15.17 Verdesian Life Sciences LLC

Verdesian Life Sciences LLC - Overview
Verdesian Life Sciences LLC - Product / Service
Verdesian Life Sciences LLC - Key offerings
SWOT

15.18 Yara International ASA

Yara International ASA - Overview
Yara International ASA - Business segments
Yara International ASA - Key offerings
Yara International ASA - Segment focus
SWOT

16. Appendix

16.1 Scope of the report

Market definition
Objectives
Notes and caveats

16.2 Inclusions and exclusions checklist

Inclusions checklist
Exclusions checklist

16.3 Currency conversion rates for US$

16.4 Research methodology

16.5 Data procurement

Information sources

16.6 Data validation

16.7 Validation techniques employed for market sizing

16.8 Data synthesis

16.9 360 degree market analysis

16.10 List of abbreviations

Research Methodology

Technavio presents a detailed picture of the market by way of study, synthesis, and summation of data from multiple sources. The analysts have presented the various facets of the market with a particular focus on identifying the key industry influencers. The data thus presented is comprehensive, reliable, and the result of extensive research, both primary and secondary.

INFORMATION SOURCES

Primary sources

  • Manufacturers and suppliers
  • Channel partners
  • Industry experts
  • Strategic decision makers

Secondary sources

  • Industry journals and periodicals
  • Government data
  • Financial reports of key industry players
  • Historical data
  • Press releases

DATA ANALYSIS

Data Synthesis

  • Collation of data
  • Estimation of key figures
  • Analysis of derived insights

Data Validation

  • Triangulation with data models
  • Reference against proprietary databases
  • Corroboration with industry experts

REPORT WRITING

Qualitative

  • Market drivers
  • Market challenges
  • Market trends
  • Five forces analysis

Quantitative

  • Market size and forecast
  • Market segmentation
  • Geographical insights
  • Competitive landscape

Interested in this report?

Get your sample now to see our research methodology and insights!

Download Now

Frequently Asked Questions

Biostimulants market growth will increase by USD 2038.9 million during 2026-2030.

The Biostimulants market is expected to grow at a CAGR of 11% during 2026-2030.

Biostimulants market is segmented by Product (Acid-based, Extract-based, Others) Application (Foliar, Soil, Seed) Type (Fruits and vegetables, Row crops and cereals, Turfs and ornaments, Others)

AMVAC Chemical Corp., BASF SE, Bayer AG, Bioceres Crop Solutions Corp., BioWorks Inc., Corteva Inc., FMC Corp., Gowan Co., Haifa Negev technologies Ltd., Hello Nature Inc., Israel Chemicals Ltd., Koppert, Novonesis Group, Nutrien Ltd., OMEX, Plant Health Care Plc, Rovensa Next, SEIPASA SA, Verdesian Life Sciences LLC, Yara International ASA are a few of the key vendors in the Biostimulants market.

Europe will register the highest growth rate of 32.8% among the other regions. Therefore, the Biostimulants market in Europe is expected to garner significant business opportunities for the vendors during the forecast period.

Germany, UK, France, Italy, Spain, The Netherlands, China, Japan, India, South Korea, Australia, Indonesia, US, Canada, Mexico, Brazil, Argentina, Chile, Saudi Arabia, UAE, South Africa, Israel, Turkey

  • Escalating global demand for sustainable agriculture and residue-free food production is the driving factor this market.

The Biostimulants market vendors should focus on grabbing business opportunities from the Product segment as it accounted for the largest market share in the base year.
RIA - Research AI Assistant
Ask RIA
