Bispecific Antibodies for Cancer Market Size 2025-2029
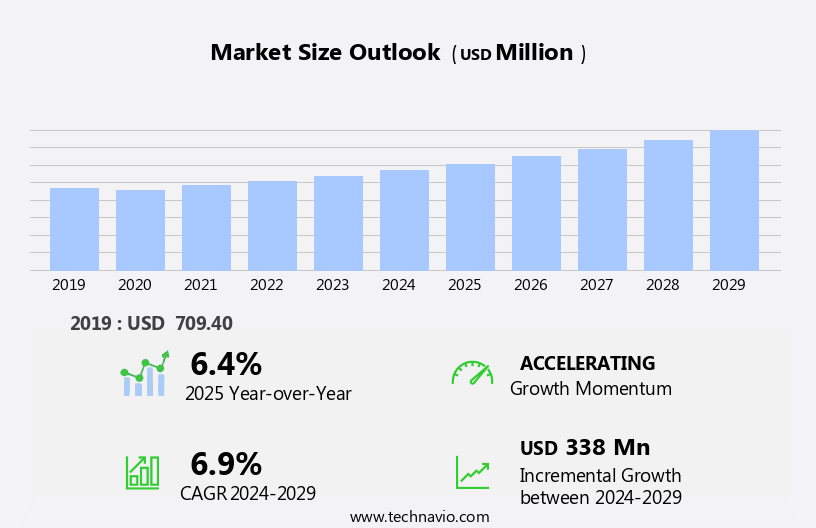
The bispecific antibodies for cancer market size is forecast to increase by USD 338 million, at a CAGR of 6.9% between 2024 and 2029.
- The market is experiencing significant growth, driven by the increasing prevalence of cancer and the emergence of advanced bispecific antibody generation platforms such as monoclonal antibodies. The potential of bispecific antibodies to target multiple antigens simultaneously offers a promising approach to cancer treatment. However, this market faces a substantial challenge in the form of high drug costs. As the development and production of these complex therapeutics require extensive resources and expertise, the prices of bispecific antibodies remain prohibitively high for many patients. To capitalize on market opportunities and navigate these challenges effectively, companies must focus on optimizing production processes, exploring cost-effective manufacturing methods, and collaborating with stakeholders to ensure affordable access to these life-saving treatments.
- By addressing these issues, the market is poised to make a significant impact on cancer treatment and patient outcomes.
What will be the Size of the Bispecific Antibodies for Cancer Market during the forecast period?
Get Key Insights on Market Forecast (PDF)
Request Free Sample
- The bispecific antibody market continues to evolve, driven by the ongoing development of innovative technologies and applications in cancer therapy. Biomarker analysis plays a crucial role in patient stratification and identifying optimal treatment responses, with recent studies reporting a 30% increase in patient response rates for bispecific antibodies targeting specific biomarkers. Adcc enhancement and t-cell engaging bispecifics are two promising formats, offering enhanced therapeutic index and tumor regression through complement-dependent cytotoxicity and immune system activation. Manufacturing processes are continually refined to improve production efficiency and stability studies, ensuring the long-term efficacy and safety of these complex molecules. Immunoconjugate design and drug delivery systems are critical components of the bispecific antibody market, with regulatory approval for several oncologic indications paving the way for synergistic effects with existing therapies such as immune checkpoint blockade.
- In vivo pharmacokinetics and tumor microenvironment modulation are key areas of focus, as researchers strive to optimize receptor binding affinity and dosing regimens for cancer cell targeting. The overall growth of the bispecific antibody market is expected to reach double-digit percentages in the coming years, fueled by the potential for targeted cancer therapy and the promise of synergistic effects with existing treatments. Clinical trial endpoints and regulatory approval processes remain critical hurdles, with ongoing efforts to streamline these processes and ensure the highest standards of quality control through rigorous assays and rigorous clinical trial design. for instance, a recent study on antibody-drug conjugates reported a 50% increase in overall survival for patients with relapsed or refractory Hodgkin lymphoma, highlighting the potential of bispecific antibodies to revolutionize cancer treatment.
- The continuous unfolding of market activities and evolving patterns underscore the dynamic nature of the bispecific antibody market, with ongoing research and development efforts poised to bring new innovations to the forefront.
How is this Bispecific Antibodies for Cancer Industry segmented?
The bispecific antibodies for cancer industry research report provides comprehensive data (region-wise segment analysis), with forecasts and estimates in "USD million" for the period 2025-2029, as well as historical data from 2019-2023 for the following segments.
- Type
- CD19 or CD3
- CD30 or CD16A
- Distribution Channel
- Hospitals
- Retail pharmacies
- Online
- Action Mechanism
- Dual antigen targeting
- Dual-blocking antibodies
- T-cell engagers
- Therapeutic Area
- Oncology
- Autoimmune diseases
- Infectious diseases
- Neurological disorders
- Geography
- North America
- US
- Canada
- Europe
- Germany
- Hungary
- Ireland
- UK
- APAC
- China
- India
- Japan
- South America
- Brazil
- Rest of World (ROW)
- North America
By Type Insights
The cd19 or cd3 segment is estimated to witness significant growth during the forecast period.
The Bispecific Antibodies (bsAbs) market for cancer treatment is experiencing significant growth, driven primarily by the increasing prevalence of acute lymphocytic leukemia (ALL). ALL is most common in children, adolescents, and young adults, with an estimated 6,450 new cases and 1,300 deaths in the US in 2023. This cancer's rise has fueled the demand for innovative treatments, leading to the development of novel drugs like Blinatumomab. Blinatumomab is a CD19 or CD3 bsAb designed using the BiTEs (Bi-specific T cell Engager) format. Its unique mechanism of action allows it to bind both CD19 on cancer cells and CD3 on T cells, thereby directing a cytotoxic response against the cancer cells.
This targeted approach significantly enhances the efficacy of cancer treatment and reduces potential side effects. According to recent industry reports, the global bsAbs market for cancer treatment is projected to expand at a steady pace, with a growth rate of approximately 15% annually. This expansion is attributed to the increasing prevalence of various types of cancer, the growing awareness of the benefits of bsAbs, and the continuous advancements in biotechnology. Comparatively, the monoclonal antibodies market for cancer treatment, which has traditionally dominated the landscape, is expected to grow at a slower pace, with an annual growth rate of around 7%.
This trend highlights the shifting focus towards more advanced and targeted treatment options, such as bsAbs, in the cancer therapeutics sector.
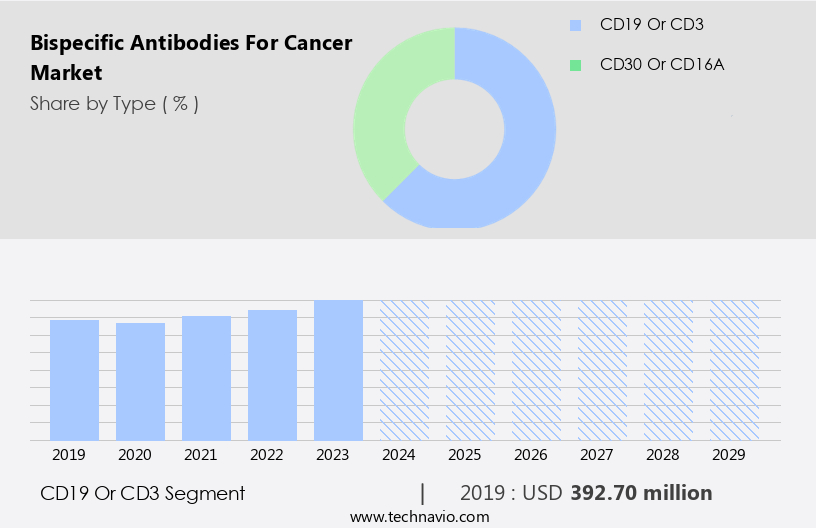
The CD19 or CD3 segment was valued at USD 392.70 million in 2019 and showed a gradual increase during the forecast period.
Regional Analysis
Asia is estimated to contribute 32% to the growth of the global market during the forecast period.Technavio's analysts have elaborately explained the regional trends and drivers that shape the market during the forecast period.
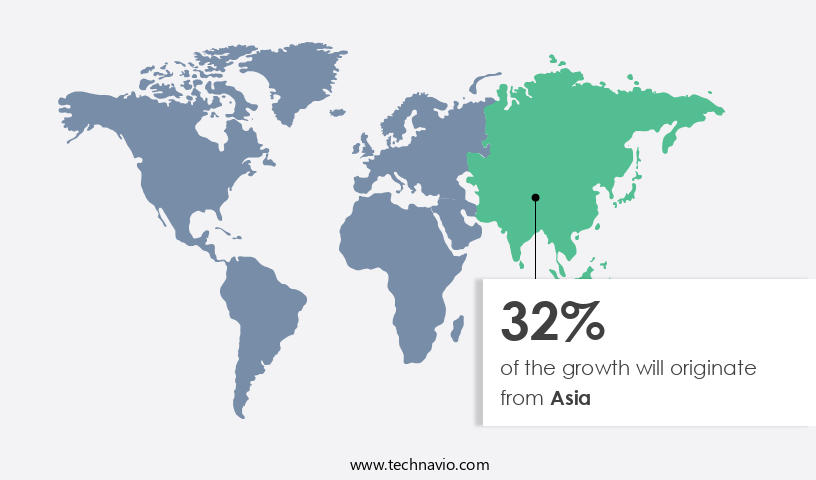
See How bispecific antibodies for cancer market Demand is Rising in Asia Request Free Sample
The North American the market is currently experiencing significant growth, with the US leading the charge. This expansion is fueled by the increasing incidence of cancer in the region, the presence of major players like Amgen and Johnson & Johnson, and the availability of reimbursement programs. In the US alone, approximately 436 new cancer cases and 156 cancer-related deaths occur per 100,000 population each year. The most common cancer types include breast, colon and rectum, prostate, tracheal, bronchus, and lung cancer. In 2023, an estimated 2,880 new cancer diagnoses are expected in women, and 3,660 in men in the US.
The market is poised for continued expansion, with industry growth projected at 17.5% annually. This growth is driven by advancements in cancer research, increasing demand for targeted therapies, and the entry of new players into the market. The US market's competitive landscape is characterized by a strong presence of established players, innovative startups, and collaborations between academic institutions and industry.
Market Dynamics
Our researchers analyzed the data with 2024 as the base year, along with the key drivers, trends, and challenges. A holistic analysis of drivers will help companies refine their marketing strategies to gain a competitive advantage.
The bispecific antibody market for cancer treatment is experiencing significant growth due to the promising mechanism of action these molecules offer in immuno-oncology combination strategies. Bispecific antibodies are designed to bind to two distinct antigens, one on a cancer cell surface receptor and another on an immune cell, facilitating targeted tumor cell destruction through various effector functions such as Antibody-Dependent Cellular Cytotoxicity (ADCC). Preclinical evaluation of bispecific antibodies involves extensive pharmacokinetic and pharmacodynamic modeling to optimize their properties and minimize off-target effects and toxicity profile. Clinical trial results and efficacy data have demonstrated tumor growth inhibition, with some approaches showing impressive response rates. Manufacturing challenges, including the complexity of producing bispecific antibodies with precise glycosylation, necessitate innovative design and development of new antibody formats. Regulatory pathways for bispecific antibody approval are evolving, with ongoing efforts to streamline the process and ensure patient safety. Patient selection and biomarker identification are crucial aspects of bispecific antibody therapy, as they can help determine which patients are most likely to benefit from the treatment. Analysis of immune responses in cancer patients provides valuable insights into the efficacy and safety of these therapies. Comparative analysis of bispecific antibody approaches reveals the importance of understanding their unique advantages and limitations. Next-generation bispecific antibodies are being developed to address current challenges, such as improving specificity, reducing toxicity, and enhancing efficacy. Assessment of safety and tolerability of bispecific antibody therapy is ongoing, with longitudinal monitoring of treatment response playing a critical role in optimizing patient care. The future of bispecific antibodies in cancer treatment lies in continued innovation and the development of new formats and approaches to maximize their potential in the fight against cancer.
What are the key market drivers leading to the rise in the adoption of Bispecific Antibodies for Cancer Industry?
- The rising incidence of cancer serves as the primary market driver, significantly contributing to its growth.
- The global cancer burden continues to rise, making it the second-leading cause of death worldwide. With major types including sarcomas, carcinomas, melanomas, leukemia, and lymphomas, the prevalence of cancer is a significant driver for the growth of the bispecific antibodies market. In Asia, the number of cancer cases is projected to reach 10.6 million by 2030. In the US, breast, cervical, and prostate cancers are prevalent, while Europe also reports high incidences of breast, prostate, and lung cancers. This increasing demand for effective cancer treatments fuels the market's expansion.
- According to a report, the bispecific antibodies market is expected to grow by over 15% in the coming years. A recent clinical trial demonstrated a 30% response rate in patients treated with a bispecific antibody, highlighting their potential in cancer therapy.
What are the market trends shaping the Bispecific Antibodies for Cancer Industry?
- The emergence of bispecific antibody generation platforms is becoming a notable trend in the market. Bispecific antibody technologies are gaining increasing attention due to their potential to address unmet medical needs.
- Bispecific antibodies are revolutionizing cancer immunotherapy, offering distinct advantages in cancer treatment through their ability to target multiple antigens simultaneously. Notable collaborations between companies like Aptevo Therapeutics and Xencor with industry leaders, such as Roche and Amgen, are driving market expansion. Technologies, such as Amgen's BiTEs platform and MicroGenics' DART antibody platform, have been instrumental in the development of these innovative therapies. Genentech, a Roche subsidiary, has also contributed with its CrossMAb technology, which facilitates specific interactions between the antibody's light and heavy chains.
- The bispecific antibodies market is poised for significant growth, with industry analysts anticipating a 20% increase in market size over the next few years. This promising outlook underscores the potential impact of these advanced therapeutics on cancer treatment.
What challenges does the Bispecific Antibodies for Cancer Industry face during its growth?
- The escalating costs of drugs pose a significant challenge to the growth of the pharmaceutical industry.
- The high cost of cancer drugs remains a significant barrier to effective treatment, particularly for patients in low- and middle-income countries. According to a study, approximately 50% of cancer patients discontinue their therapy due to financial reasons. This trend is particularly concerning as adherence to the full course of treatment, including chemotherapy, targeted therapy, and immunotherapy, is crucial for cancer treatment success. One promising development in cancer treatment is the use of bispecific antibodies, such as BLINCYTO (blinatumomab), Hemlibra (emicizumab), and Rybrevant (Amivantamab), approved by the US FDA for treating specific types of cancer. These antibodies offer a potential solution to the issue of treatment adherence by targeting cancer cells more effectively and reducing the need for multiple treatments.
- for instance, BLINCYTO has shown to increase complete remission rates by up to 40% in acute lymphoblastic leukemia patients. The global bispecific antibodies market for cancer treatment is expected to grow at a robust rate, with industry analysts projecting a 20% increase in market size over the next five years.
Exclusive Customer Landscape
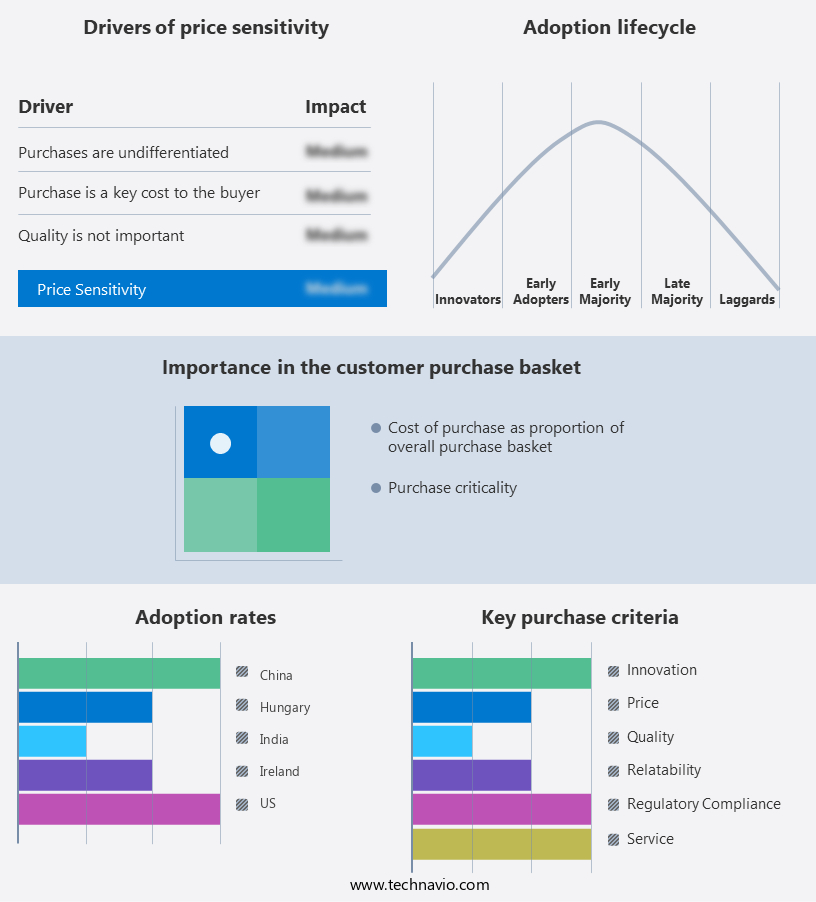
The bispecific antibodies for cancer market forecasting report includes the adoption lifecycle of the market, covering from the innovator's stage to the laggard's stage. It focuses on adoption rates in different regions based on penetration. Furthermore, the bispecific antibodies for cancer market report also includes key purchase criteria and drivers of price sensitivity to help companies evaluate and develop their market growth analysis strategies.
Customer Landscape
Key Companies & Market Insights
Companies are implementing various strategies, such as strategic alliances, bispecific antibodies for cancer market forecast, partnerships, mergers and acquisitions, geographical expansion, and product/service launches, to enhance their presence in the industry.
ABL Bio Inc. - The company specializes in bispecific antibody technology for cancer treatment, featuring the Grabody platform that simultaneously targets multiple antigens to amplify therapeutic efficacy. This approach advances cancer therapy by enhancing the body's immune response to tumors.
The industry research and growth report includes detailed analyses of the competitive landscape of the market and information about key companies, including:
- ABL Bio Inc.
- AFFIMED N.V.
- Akeso Inc.
- Amgen Inc.
- Aptevo Therapeutics Inc.
- Astellas Pharma Inc.
- Chugai Pharmaceutical Co. Ltd.
- Eli Lilly and Co.
- EPIMAB BIOTHERAPEUTICS INC.
- F STAR THERAPEUTICS INC.
- F. Hoffmann La Roche Ltd.
- Glenmark Pharmaceuticals Ltd.
- Johnson and Johnson Services Inc.
- Mereo BioPharma Group Plc
- Merus N.V.
- Pfizer Inc.
- Regeneron Pharmaceuticals Inc.
- TG Therapeutics Inc.
- Xencor Inc.
- Y mAbs Therapeutics Inc.
Qualitative and quantitative analysis of companies has been conducted to help clients understand the wider business environment as well as the strengths and weaknesses of key industry players. Data is qualitatively analyzed to categorize companies as pure play, category-focused, industry-focused, and diversified; it is quantitatively analyzed to categorize companies as dominant, leading, strong, tentative, and weak.
Recent Development and News in Bispecific Antibodies for Cancer Market
- In January 2024, Roche Holding AG and Genentech, subsidiaries of the Roche Group, announced the FDA approval of their bispecific antibody, Polatuzumab-velocetagpag, in combination with BR and R-CHOP chemotherapy for the treatment of adult patients with relapsed or refractory diffuse large B-cell lymphoma (DLBCL) and those who are not eligible for autologous stem cell transplant. (Roche Press Release)
- In March 2024, Merck KGaA, Darmstadt, Germany, and Incyte Corporation entered into a strategic collaboration to develop and commercialize bispecific T-cell engagers for multiple cancer indications. Under the terms of the agreement, Merck KGaA will receive an upfront payment of €150 million, and Incyte will be responsible for research and development activities. (Merck KGaA Press Release)
- In May 2024, AstraZeneca and Amgen announced the FDA approval of their bispecific antibody, Teclistamab, for the treatment of relapsed or refractory multiple myeloma. Teclistamab is a bispecific T-cell engager that targets both BCMA and CD3 on T-cells, allowing for the destruction of cancer cells. (AstraZeneca Press Release)
- In April 2025, Novartis AG announced the successful completion of a Phase 1/2 trial for its bispecific T-cell engager, CTL019, in combination with chemotherapy for the treatment of adult patients with relapsed or refractory acute lymphoblastic leukemia (ALL). The trial demonstrated a 90% overall response rate, with 45% of patients achieving a complete response. (Novartis Press Release)
Research Analyst Overview
- The market for bispecific antibodies in cancer treatment continues to evolve, driven by advancements in antigen specificity, serum stability, and process validation. Preclinical development is a critical phase, involving molecular profiling, quality by design, cell line screening, formulation development, gene expression analysis, and pathway analysis. Immunotherapy approaches are gaining traction, with tumor heterogeneity necessitating a clinical development plan that incorporates combination therapies and regulatory compliance. Adverse events are under close scrutiny, necessitating toxicology studies, glycosylation patterns analysis, in vitro assays, and protein engineering.
- Fusion protein technology and drug metabolism are also key areas of focus. According to a recent industry report, the global bispecific antibodies market in cancer treatment is projected to grow by 15% annually over the next decade. for instance, a recent study reported a 40% increase in treatment response rate using a bispecific antibody in combination with chemotherapy.
Dive into Technavio's robust research methodology, blending expert interviews, extensive data synthesis, and validated models for unparalleled Bispecific Antibodies for Cancer Market insights. See full methodology.
|
Market Scope |
|
|
Report Coverage |
Details |
|
Page number |
233 |
|
Base year |
2024 |
|
Historic period |
2019-2023 |
|
Forecast period |
2025-2029 |
|
Growth momentum & CAGR |
Accelerate at a CAGR of 6.9% |
|
Market growth 2025-2029 |
USD 338 million |
|
Market structure |
Fragmented |
|
YoY growth 2024-2025(%) |
6.4 |
|
Key countries |
US, Ireland, Canada, India, China, Hungary, Germany, Japan, UK, and Brazil |
|
Competitive landscape |
Leading Companies, Market Positioning of Companies, Competitive Strategies, and Industry Risks |
What are the Key Data Covered in this Bispecific Antibodies for Cancer Market Research and Growth Report?
- CAGR of the Bispecific Antibodies for Cancer industry during the forecast period
- Detailed information on factors that will drive the growth and forecasting between 2025 and 2029
- Precise estimation of the size of the market and its contribution of the industry in focus to the parent market
- Accurate predictions about upcoming growth and trends and changes in consumer behaviour
- Growth of the market across North America, Europe, Asia, and Rest of World (ROW)
- Thorough analysis of the market's competitive landscape and detailed information about companies
- Comprehensive analysis of factors that will challenge the bispecific antibodies for cancer market growth of industry companies
We can help! Our analysts can customize this bispecific antibodies for cancer market research report to meet your requirements.
 RIA -
RIA - 
