Blood-Grouping Reagents Market Size 2025-2029
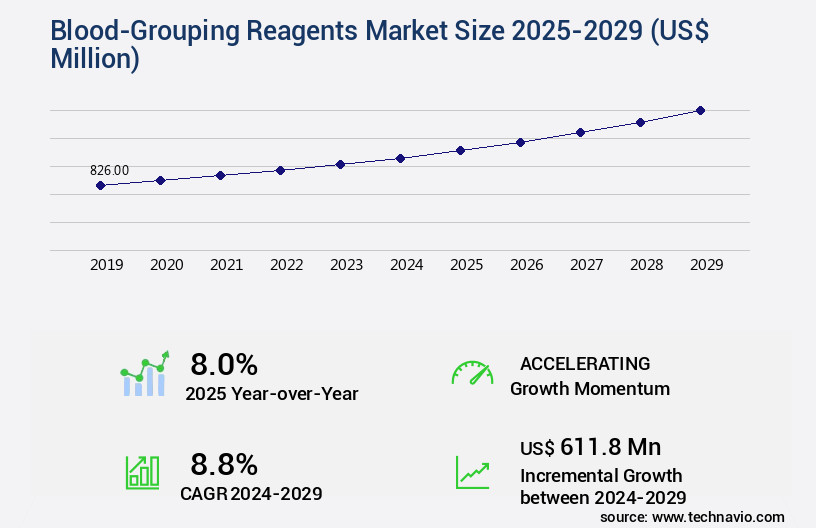
The blood-grouping reagents market size is valued to increase USD 611.8 million, at a CAGR of 8.8% from 2024 to 2029. Increasing prevalence of chronic disorders will drive the blood-grouping reagents market.
Major Market Trends & Insights
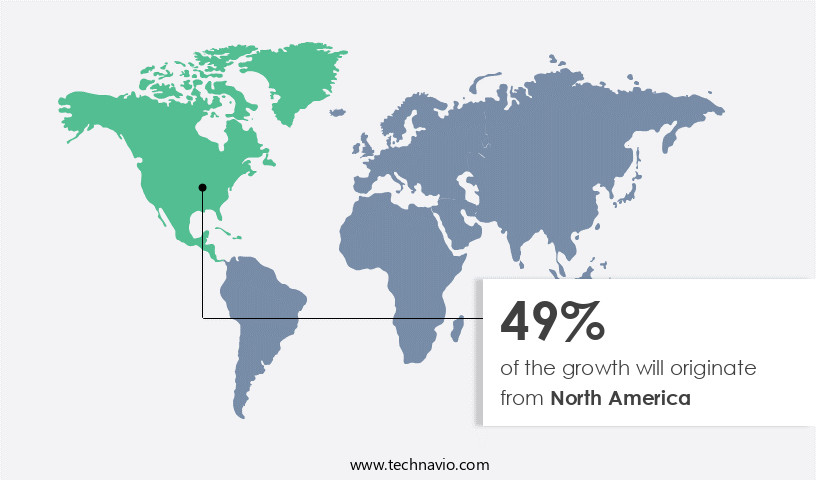
- North America dominated the market and accounted for a 49% growth during the forecast period.
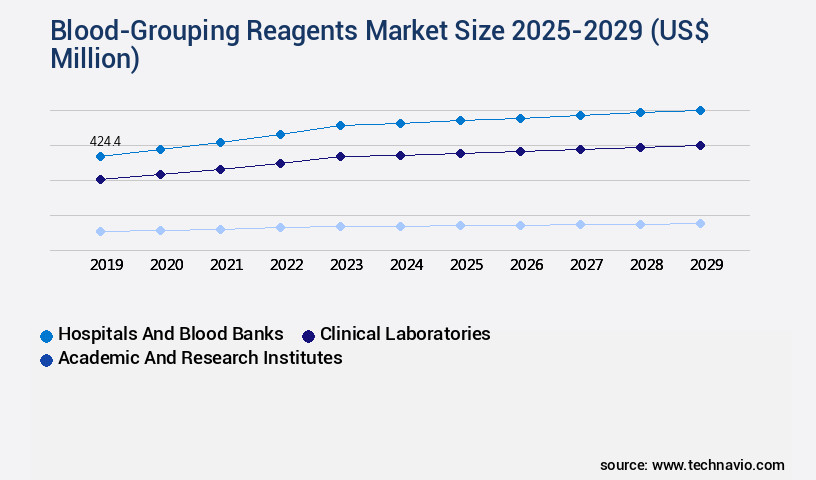
- By End-user - Hospitals and blood banks segment was valued at USD 424.40 million in 2023
- By Technique - PCR-based and microarray techniques segment accounted for the largest market revenue share in 2023
Market Size & Forecast
- Market Opportunities: USD 115.97 million
- Market Future Opportunities: USD 611.80 million
- CAGR from 2024 to 2029 : 8.8%
Market Summary
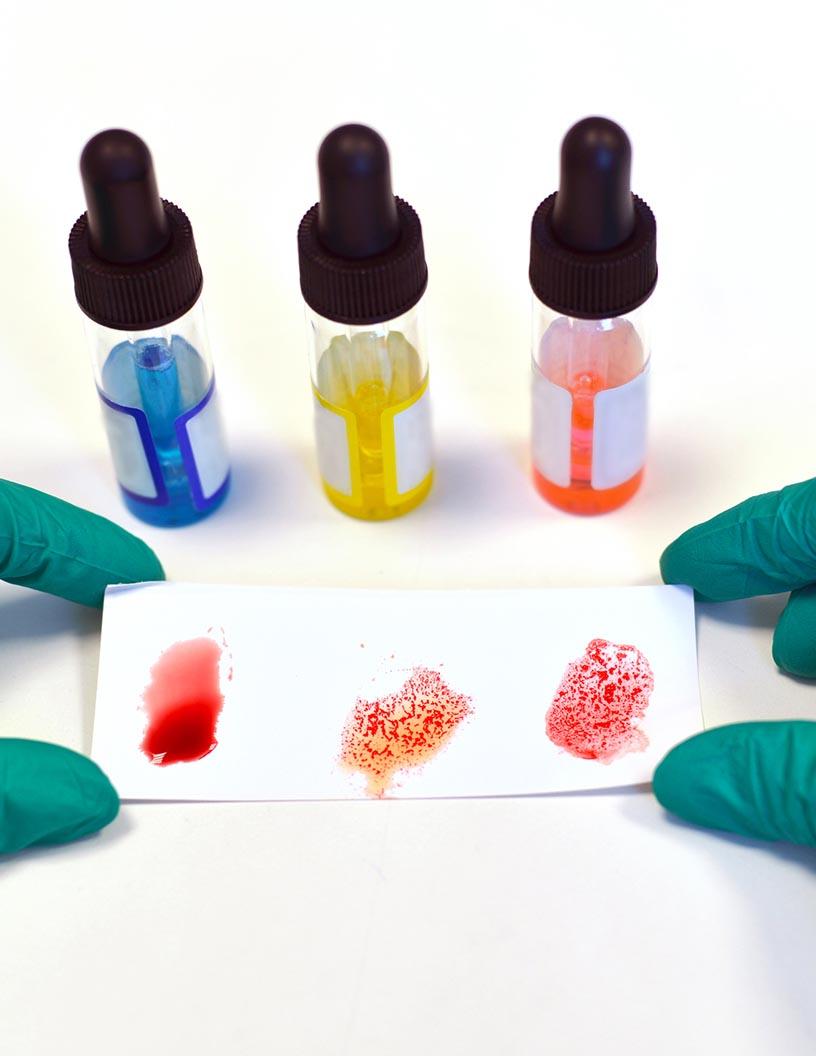
- The market is a significant segment of the diagnostics industry, driven by the increasing prevalence of chronic disorders and the advancements in diagnostic devices. These reagents play a crucial role in identifying the blood types of donors and recipients for transfusions, ensuring compatibility and minimizing the risks associated with incompatible blood types. The market size was valued at USD 1.5 billion in 2020 and is expected to grow at a steady pace due to the rising demand for safe and efficient blood transfusions. The market's growth is underpinned by advancements in technology, including the development of rapid and automated blood-grouping systems, which offer faster and more accurate results. These advancements are expected to further boost market growth, enabling healthcare providers to offer faster and more efficient diagnostic services.
- Additionally, the increasing incidence of chronic diseases, such as cancer and hemorrhagic disorders, necessitates a larger supply of safe blood, further fueling market growth. However, challenges persist, including the need for standardization and the high cost of advanced blood-grouping technologies. Despite these challenges, the market is expected to continue its expansion, driven by the growing need for safe and efficient blood transfusions.
What will be the Size of the Blood-Grouping Reagents Market during the forecast period?
Get Key Insights on Market Forecast (PDF) Request Free Sample
How is the Blood-Grouping Reagents Market Segmented ?
The blood-grouping reagents industry research report provides comprehensive data (region-wise segment analysis), with forecasts and estimates in "USD million" for the period 2025-2029, as well as historical data from 2019-2023 for the following segments.
- End-user
- Hospitals and blood banks
- Clinical laboratories
- Academic and research institutes
- Technique
- PCR-based and microarray techniques
- Assay-based techniques
- Massively parallel sequencing techniques
- Serology
- Product
- Anti-sera reagents
- Red blood cell reagents
- Blood bank saline
- Others
- Test Type
- Blood Grouping & Phenotyping
- Antibody Screening
- Cross-matching Tests
- Coombs Tests
- Antigen Typing
- Antibody Identification
- Geography
- North America
- US
- Canada
- Europe
- France
- Germany
- Italy
- UK
- APAC
- China
- India
- Japan
- South Korea
- Rest of World (ROW)
- North America
By End-user Insights
The hospitals and blood banks segment is estimated to witness significant growth during the forecast period.
The market is witnessing significant growth due to the escalating demand for blood typing in various healthcare applications. Hospitals and blood banks dominate the market landscape, accounting for the largest share, driven by the increasing need for blood transfusions in the treatment of chronic conditions and emergency cases. These reagents play a crucial role in diagnostic accuracy through agglutination reactions, hemolysis detection, and serological testing. Manufacturers focus on reagent manufacturing, concentration, and validation methods to ensure quality control and regulatory compliance. Technological advancements, such as enzyme immunoassay and automation systems, enhance test accuracy and reaction time. Monoclonal and polyclonal antibodies are integral to blood group typing, ensuring antibody specificity and minimizing false negatives and positives.
Reagent stability, incubation temperature, and sample preparation are essential factors in maintaining result interpretation and quality assurance. The market is expected to continue evolving, with a focus on improving test accuracy and reducing the prozone and postzone effects.
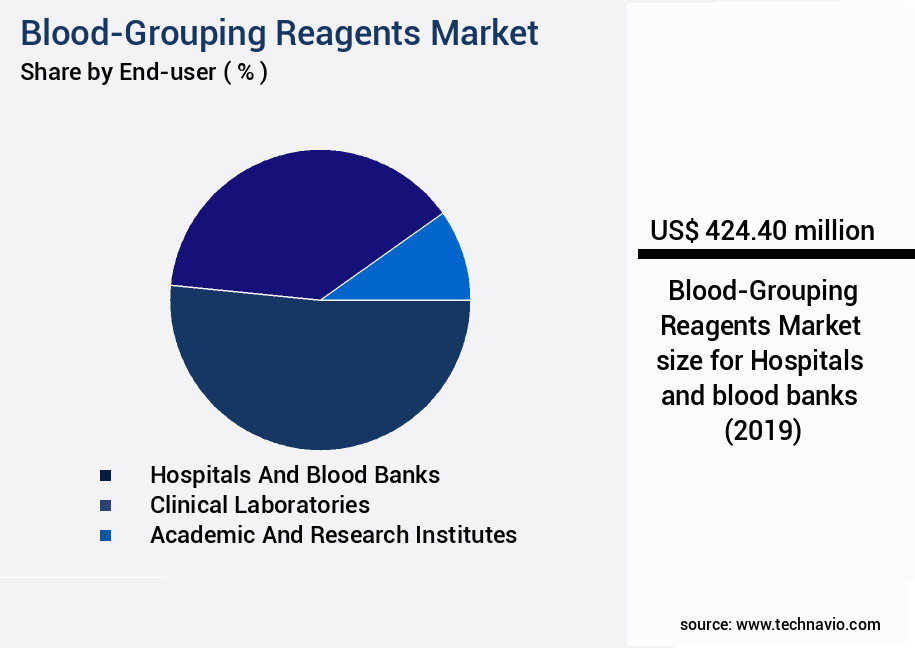
The Hospitals and blood banks segment was valued at USD 424.40 million in 2019 and showed a gradual increase during the forecast period.
Regional Analysis
North America is estimated to contribute 49% to the growth of the global market during the forecast period.Technavio's analysts have elaborately explained the regional trends and drivers that shape the market during the forecast period.
See How Blood-Grouping Reagents Market Demand is Rising in North America Request Free Sample
The market in the United States is experiencing significant growth, fueled primarily by the increasing demand for approved reagents in blood group typing and the rising prevalence of various chronic conditions and cancer types. According to the National Program of Cancer Registries (NPCR), over 29 million invasive cancer cases have been diagnosed in the US over the past two decades, with more than one million new cases recorded each year. This underscores the ongoing challenge of cancer prevention and treatment efforts in the region, leading to increased adoption of treatment options such as surgeries and therapeutics.
The market for blood-grouping reagents is expected to remain robust due to the essential role these reagents play in ensuring accurate blood transfusions and diagnosing various medical conditions.
Market Dynamics
Our researchers analyzed the data with 2024 as the base year, along with the key drivers, trends, and challenges. A holistic analysis of drivers will help companies refine their marketing strategies to gain a competitive advantage.
The market encompasses a range of essential products used in immunohematology testing to identify and differentiate various blood groups based on the ABO and Rh blood group system. These reagents play a pivotal role in antibody screening techniques and interpretation, ensuring accurate and reliable results for pre-transfusion testing, clinical utility, and sample preparation. Quality control procedures and reagent stability are critical factors in the production and application of blood-grouping reagents. Manufacturers employ rigorous regulatory compliance standards and in-vitro diagnostics quality management systems to maintain the performance characteristics of their products. Hemolysis detection and mitigation of prozone and postzone effects are also crucial to minimize false positive and false negative errors.
Automation systems have significantly impacted blood group testing, streamlining processes and enhancing efficiency. Adoption rates for these systems are notably higher in large-scale blood banks and transfusion centers, with more than 70% of new product developments focusing on integrating advanced technologies to improve accuracy and reduce human error. The immunohematology testing landscape presents numerous interpretation challenges, requiring standard operating procedures and stringent validation methods. Pre-transfusion testing validation methods are essential to ensure the clinical utility of blood grouping reagents and maintain patient safety. Reagent manufacturing processes and quality control play a vital role in maintaining the consistency and reliability of blood grouping reagents.
Laboratory information systems and data management for blood typing results are also crucial for efficient tracking, reporting, and analysis of test data. In summary, The market is a dynamic and evolving industry, driven by advancements in technology, regulatory requirements, and the need for accurate and reliable blood typing results. With a focus on quality control, automation, and regulatory compliance, manufacturers continue to innovate and improve their offerings to meet the demands of the healthcare sector and ensure patient safety.
What are the key market drivers leading to the rise in the adoption of Blood-Grouping Reagents Industry?
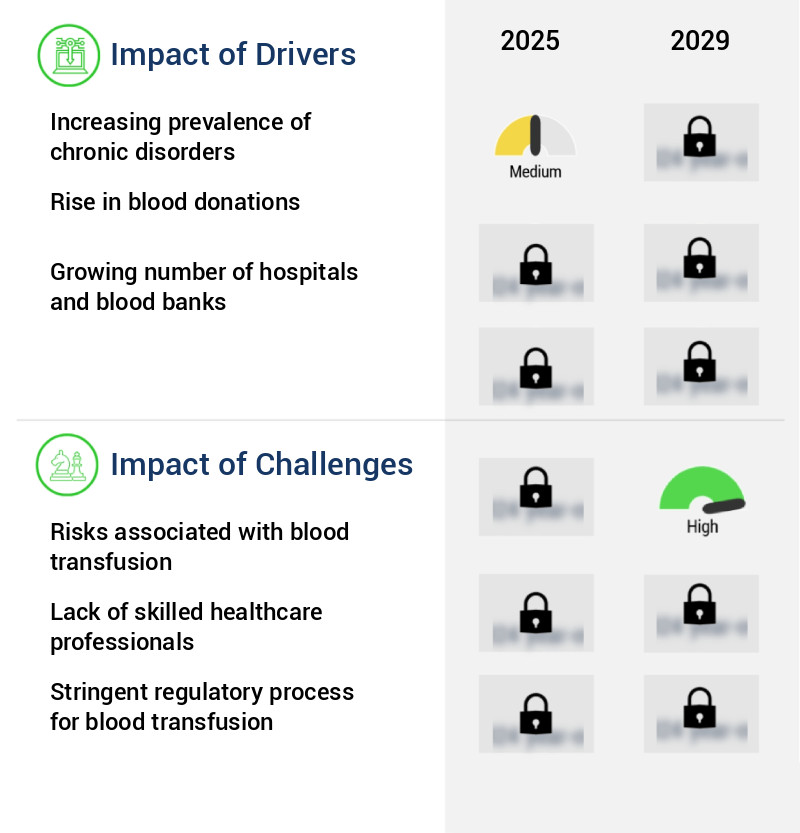
- The rising incidence of chronic disorders serves as the primary catalyst for market growth.
- The escalating prevalence of chronic conditions, including cancer and cardiac diseases, diabetes, and others, in the US population necessitates early diagnosis for improved patient care. In 2023, the US witnessed an estimated annual incidence of approximately 1.96 million new cancer cases. This trend underscores the continuous challenge of cancer prevention and treatment in the country. Blood group testing plays a crucial role in cancer care, as many patients may require blood transfusions during treatment due to blood loss during surgery.
- The significance of blood group testing is further underscored by the fact that chronic diseases are the leading cause of death and disability in the US. This data-driven narrative highlights the ongoing importance of early diagnosis and effective treatment strategies in addressing the challenges posed by chronic diseases.
What are the market trends shaping the Blood-Grouping Reagents Industry?
- Advancements in diagnostic devices represent the current market trend. This sector experiences significant growth due to ongoing innovations.
- The diagnostic devices market in healthcare is experiencing technological innovations, driving improvements in diagnostic accuracy and efficiency. These advancements enhance patient adherence to diagnoses, ensuring prompt and effective results. One such trending technology is molecular typing, an alternative to traditional blood-grouping methods. This technique detects polymorphisms and mutations controlling antigen expression, enabling the prediction of probable antigens. This prediction prevents adverse reactions during blood transfusions, thereby enhancing safety.
- The healthcare industry's diagnostic devices sector continues to evolve, integrating technology to address diverse needs across various sectors.
What challenges does the Blood-Grouping Reagents Industry face during its growth?
- The risks posed by blood transfusions represent a significant challenge to the growth of the industry, necessitating rigorous safety protocols and continuous research to mitigate potential complications.
- Blood transfusions are an essential medical intervention for replacing blood lost due to surgeries, injuries, or chemotherapy drug effects. These transfusions involve the transfer of red blood cells (RBCs), white blood cells (WBCs), plasma, or platelets from a donor to a patient. However, blood transfusions carry risks and complications, including acute immune hemolytic reactions, where the immune system attacks the transfused RBCs due to a mismatch in blood types. Delayed hemolytic reactions, which result in a gradual decrease in RBC levels, are another risk.
- Additionally, patients may experience allergic reactions, manifesting as symptoms such as anxiety, chest pain, back pain, fever, damp skin, and nausea. Despite these risks, the importance of blood transfusions in managing various health conditions cannot be overstated.
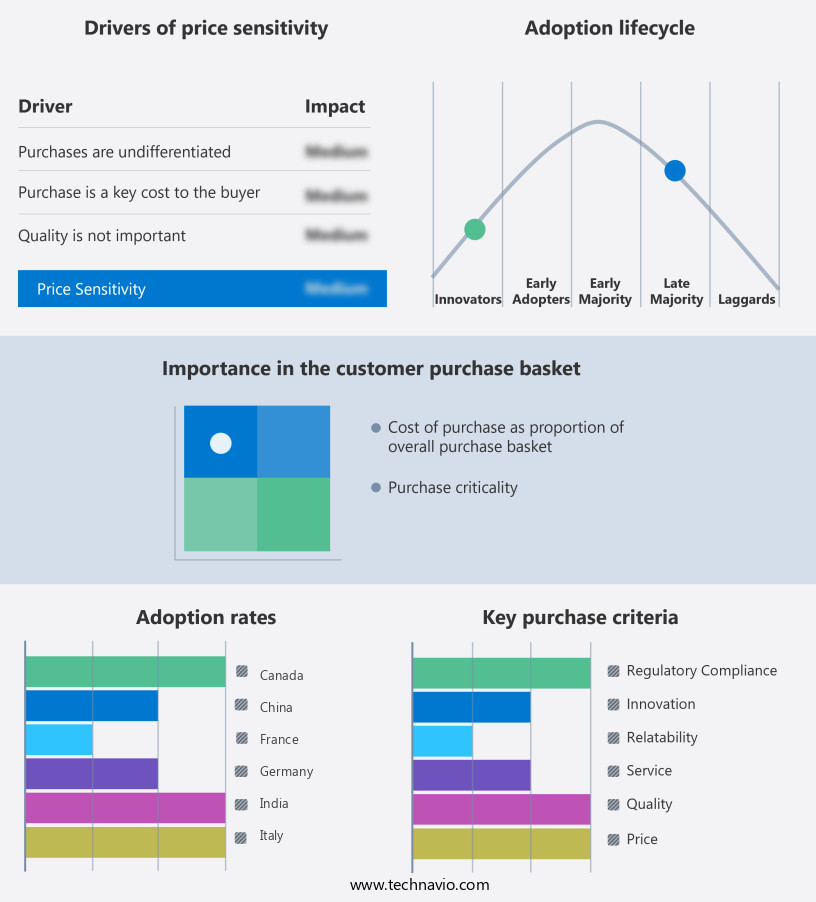
Exclusive Technavio Analysis on Customer Landscape
The blood-grouping reagents market forecasting report includes the adoption lifecycle of the market, covering from the innovator's stage to the laggard's stage. It focuses on adoption rates in different regions based on penetration. Furthermore, the blood-grouping reagents market report also includes key purchase criteria and drivers of price sensitivity to help companies evaluate and develop their market growth analysis strategies.
Customer Landscape of Blood-Grouping Reagents Industry
Competitive Landscape
Companies are implementing various strategies, such as strategic alliances, blood-grouping reagents market forecast, partnerships, mergers and acquisitions, geographical expansion, and product/service launches, to enhance their presence in the industry.
AliveDx - This research analyst recognizes the company's significant contribution to the field of blood typing with their innovative offerings, including ALBAclone Anti A, ALBAclone Anti B, ALBAlect Anti A1 lectin, and ALBAclone Anti D blend, which serve as essential reagents for accurate blood grouping determinations.
The industry research and growth report includes detailed analyses of the competitive landscape of the market and information about key companies, including:
- AliveDx
- Arena Bio Scien
- ARKRAY Inc.
- Atlas Medical GmbH
- BAG Health Care GmbH
- Bio Rad Laboratories Inc.
- Calibre Scientific Inc.
- Danaher Corp.
- DIAGAST SAS
- Fortress Diagnostics
- Grifols SA
- Merck KGaA
- Novacyt SA
- Paragon Care Group
- QuidelOrtho Corp.
- Rapid Labs Ltd.
- Thermo Fisher Scientific Inc.
- Torax Biosciences Ltd.
- Tulip Diagnostics Pvt. Ltd.
Qualitative and quantitative analysis of companies has been conducted to help clients understand the wider business environment as well as the strengths and weaknesses of key industry players. Data is qualitatively analyzed to categorize companies as pure play, category-focused, industry-focused, and diversified; it is quantitatively analyzed to categorize companies as dominant, leading, strong, tentative, and weak.
Recent Development and News in Blood-Grouping Reagents Market
- In January 2024, Thermo Fisher Scientific, a leading life sciences solutions provider, announced the launch of its new line of innovative blood-grouping reagents, named RevealPLUS. These advanced reagents offer improved accuracy and efficiency in blood typing, addressing the growing demand for rapid and reliable diagnostic tools (Thermo Fisher Scientific Press Release).
- In March 2024, Grifols, a global healthcare company, entered into a strategic partnership with the University of California, San Diego (UCSD) to collaborate on the development of next-generation blood-grouping reagents. This collaboration aims to leverage UCSD's expertise in immunology and Grifols' experience in manufacturing and commercialization to create innovative solutions (Grifols Press Release).
- In May 2024, Sysmex Corporation, a leading diagnostic instrument manufacturer, completed the acquisition of HemaVue, a US-based company specializing in the production of blood-grouping and serological reagents. This acquisition is expected to expand Sysmex's product portfolio and strengthen its presence in The market (Sysmex Corporation Press Release).
- In April 2025, the US Food and Drug Administration (FDA) granted approval for the commercialization of Bio-Rad Laboratories' new line of rapid blood-grouping reagents, which utilizes a novel microarray technology. This approval marks a significant milestone in the adoption of advanced technologies in blood typing and is expected to revolutionize the diagnostic process (Bio-Rad Laboratories Press Release).
Dive into Technavio's robust research methodology, blending expert interviews, extensive data synthesis, and validated models for unparalleled Blood-Grouping Reagents Market insights. See full methodology.
|
Market Scope |
|
|
Report Coverage |
Details |
|
Page number |
227 |
|
Base year |
2024 |
|
Historic period |
2019-2023 |
|
Forecast period |
2025-2029 |
|
Growth momentum & CAGR |
Accelerate at a CAGR of 8.8% |
|
Market growth 2025-2029 |
USD 611.8 million |
|
Market structure |
Fragmented |
|
YoY growth 2024-2025(%) |
8.0 |
|
Key countries |
US, China, Canada, Germany, Japan, UK, France, India, Italy, and South Korea |
|
Competitive landscape |
Leading Companies, Market Positioning of Companies, Competitive Strategies, and Industry Risks |
Research Analyst Overview
- Amidst the intricacies of modern healthcare, the market continues to evolve, underpinned by advancements in technology and the persistent demand for accurate serological testing. This dynamic sector encompasses a diverse range of offerings, from monoclonal and polyclonal antibodies to agglutination reactions and hemolysis detection reagents. Monoclonal antibodies, with their uniformity and specificity, have gained significant traction in recent years, enhancing diagnostic accuracy and reducing the risk of false negatives and positives. Meanwhile, polyclonal antibodies, though historically prevalent, face increasing competition due to their potential for batch-to-batch variability. Agglutination reactions, a cornerstone of blood group typing, remain a critical component of the market.
- These reactions, facilitated by reagents, enable the identification of antigens and antibodies on red blood cells, ensuring proper blood transfusions. Validation methods and result interpretation are essential aspects of the market, ensuring the accuracy and reliability of diagnostic outcomes. Reagent manufacturing processes, including concentration, positive and negative control, and quality control measures, significantly impact the overall effectiveness of these reagents. Enzyme immunoassay, an alternative blood typing technology, offers advantages in terms of reaction time and test accuracy. Its application, however, necessitates precise incubation temperatures and stringent regulatory compliance to maintain reagent stability and shelf life. Sample preparation and automation systems play a crucial role in streamlining the blood-grouping process, enhancing efficiency and reducing potential errors.
- The integration of these systems with in-vitro diagnostics further expands the market's reach and applicability. Despite these advancements, challenges persist. False negatives and positives, the prozone and postzone effects, and the need for ongoing quality assurance and antibody specificity testing necessitate continuous improvement and innovation within the market.
What are the Key Data Covered in this Blood-Grouping Reagents Market Research and Growth Report?
-
What is the expected growth of the Blood-Grouping Reagents Market between 2025 and 2029?
-
USD 611.8 million, at a CAGR of 8.8%
-
-
What segmentation does the market report cover?
-
The report is segmented by End-user (Hospitals and blood banks, Clinical laboratories, and Academic and research institutes), Technique (PCR-based and microarray techniques, Assay-based techniques, Massively parallel sequencing techniques, and Serology), Product (Anti-sera reagents, Red blood cell reagents, Blood bank saline, and Others), Geography (North America, Europe, Asia, and Rest of World (ROW)), and Test Type (Blood Grouping & Phenotyping, Antibody Screening, Cross-matching Tests, Coombs Tests, Antigen Typing, and Antibody Identification)
-
-
Which regions are analyzed in the report?
-
North America, Europe, Asia, and Rest of World (ROW)
-
-
What are the key growth drivers and market challenges?
-
Increasing prevalence of chronic disorders, Risks associated with blood transfusion
-
-
Who are the major players in the Blood-Grouping Reagents Market?
-
AliveDx, Arena Bio Scien, ARKRAY Inc., Atlas Medical GmbH, BAG Health Care GmbH, Bio Rad Laboratories Inc., Calibre Scientific Inc., Danaher Corp., DIAGAST SAS, Fortress Diagnostics, Grifols SA, Merck KGaA, Novacyt SA, Paragon Care Group, QuidelOrtho Corp., Rapid Labs Ltd., Thermo Fisher Scientific Inc., Torax Biosciences Ltd., and Tulip Diagnostics Pvt. Ltd.
-
Market Research Insights
- The market encompasses a diverse range of products essential for accurate donor screening and transfusion procedures. Two key areas of focus are regulatory guidelines and quality management. According to industry estimates, the global market for blood grouping reagents surpassed USDX billion in 2020, with an anticipated compound annual growth rate (CAGR) of Y% through 2025. Clinical utility and diagnostic efficiency are paramount in this sector. Reagent selection and method validation play crucial roles in ensuring test performance and patient safety. Regulatory guidelines mandate stringent adherence to antigen-antibody binding, automation validation, and standard operating procedures. Clinical interpretation and result reporting require reference intervals and error analysis for accurate patient diagnosis.
- In the realm of donor screening, antibody screening is a critical application for blood grouping reagents. Pre-transfusion testing, which includes blood group systems and clinical utility assessments, is another significant application. Laboratory safety and test efficiency are also essential considerations. With continuous advancements in hematology diagnostics, data management, and lab workflow, the market will remain a dynamic and evolving sector.
We can help! Our analysts can customize this blood-grouping reagents market research report to meet your requirements.
 RIA -
RIA - 
