Boron Market Analysis APAC, North America, Europe, South America, Middle East and Africa - US, China, India, Japan, Germany - Size and Forecast 2024-2028

Boron Market Analysis APAC, North America, Europe, South America, Middle East and Africa - US, China, India, Japan, Germany - Size and Forecast 2024-2028

Published: Mar 2024 161 Pages SKU: IRTNTR77659

Market Overview at a Glance

$1.53 B
Market Opportunity
10.13%
CAGR
12.75
YoY growth 2023-2024(%)

Boron Market Size 2024-2028 

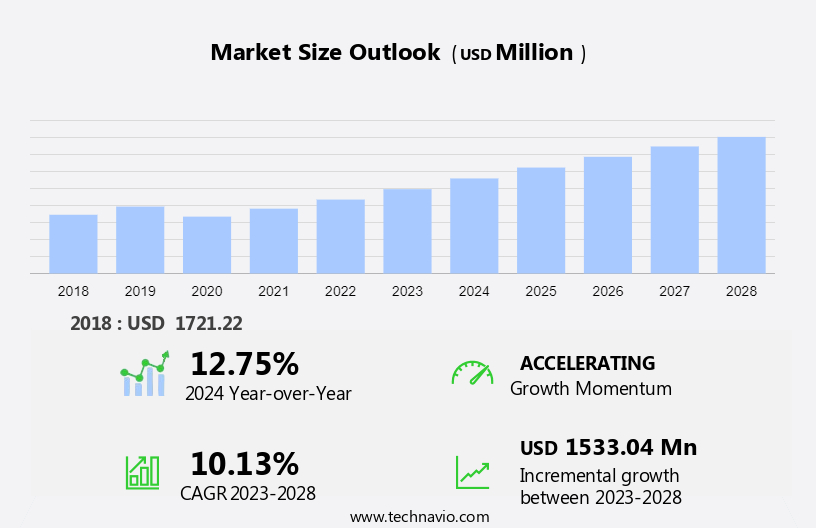
The boron market size is forecast to increase by USD 1.53 billion at a CAGR of 10.13% between 2023 and 2028.

  • The market is experiencing significant growth due to several key trends and factors. One of the primary drivers is the increasing demand from developing countries, particularly in Asia Pacific, as they expand their infrastructure and industries. Another trend is the growing demand from the renewable energy sector, where boron is used in the production of solar panels and wind turbines. Additionally, stringent regulations and policies aimed at reducing carbon emissions and promoting sustainable energy are boosting the market. These factors are expected to continue driving the growth of the market in the coming years. Boron's unique properties, such as its high thermal and electrical conductivity, make it an essential element in various industries, including glass, ceramics, and electronics. As the demand for these industries continues to grow, so too will the demand for boron. Overall, the market is poised for steady expansion in the coming years, driven by these key trends and factors.

What will the size of the market be during the forecast period?

Boron Market Size

 Request Free Sample

  • Boron, a naturally occurring element, plays a vital role in various industries, including semiconductors and steel alloys. In semiconductors, boron functions as a dopant, enhancing the electrical conductivity of silicon. In steel alloys, it improves strength and resistance to thermal expansion. Mitigating the environmental impact of boron extraction is a significant concern. Boron is primarily sourced from mine ores, raising sustainability concerns. To address these issues, the industry is exploring boron-containing fertilizers derived from natural sources and sustainable practices. Boron's applications extend beyond semiconductors and steel alloys. In agriculture, boron deficit can negatively impact crop health, necessitating the use of boron-containing fertilizers.
  • Boron also plays a role in genetic alteration and crop tolerance, enhancing agricultural demand. Boron's versatility is evident in its use in electronic devices, ceramics, and glass. Boron's high melting temperature and fluidity make it an essential component in the production of high-strength concrete and flat glass. Boron's role in offline distribution systems, such as GPS and electronic circuits, ensures efficient infrastructure development. Sustainability concerns surrounding boron mining have led to the exploration of alternative sources, such as cosmic ray spallation. This process generates boron-10 isotopes, which can be extracted and used as a substitute for mined boron.

How is this market segmented and which is the largest segment?

The market research report provides comprehensive data (region-wise segment analysis), with forecasts and estimates in "USD billion" for the period 2024-2028, as well as historical data from 2018-2022 for the following segments.

  • Application
    • Glass
    • Fertilizers
    • Ceramics
    • Detergents
    • Others
  • End-user
    • Construction
    • Agriculture
    • Personal care
    • Automotive
    • Others
  • Geography
    • APAC
      • China
      • India
      • Japan
    • North America
      • US
    • Europe
      • Germany
    • South America
    • Middle East and Africa

By Application Insights

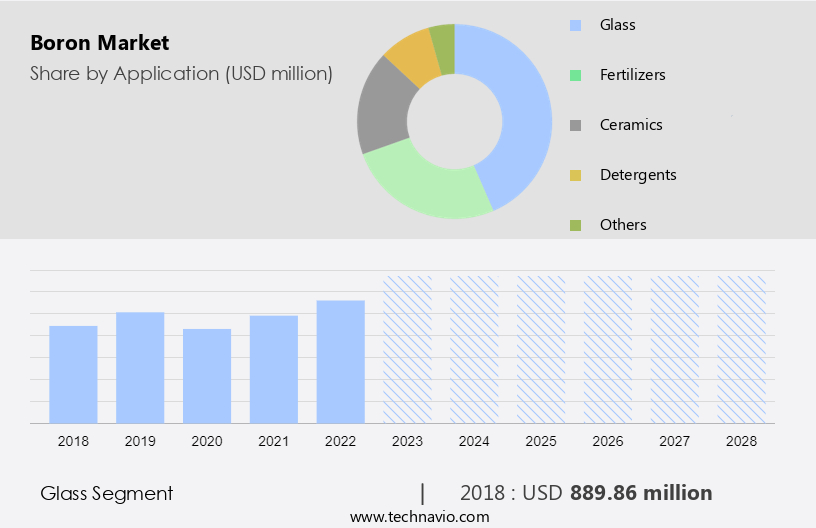
  • The glass segment is estimated to witness significant growth during the forecast period.

Boron is an essential micronutrient for soil and plays a crucial role in the production of various industries, particularly in the manufacturing of glass. Boron-rich soils are vital for the growth of boron-responsive crops, which include fruits, vegetables, and nuts. The bioavailability of boron in soil can be improved through proper management practices, such as irrigation and fertilizer application. Boron-efficient crops, like cotton, rice, and wheat, require minimal boron supplementation, reducing the need for excessive fertilizer use. Maintaining optimal soil boron levels is essential for plant growth and development. Boron's mobility in soil is naturally limited, making it necessary to apply boron as a fertilizer to ensure adequate supply. The increasing demand for energy-efficient buildings and high-quality glass products, such as borosilicate glass, is expected to drive the market during the forecast period. Boron's unique properties, including scratch resistance, electrical neutrality, high strength, and chemical resistance, make it an indispensable ingredient in the production of various glass products.

Boron Market Size

Get a glance at the market report of share of various segments Request Free Sample

The Glass segment was valued at USD 889.86 million in 2018 and showed a gradual increase during the forecast period.

Regional Analysis

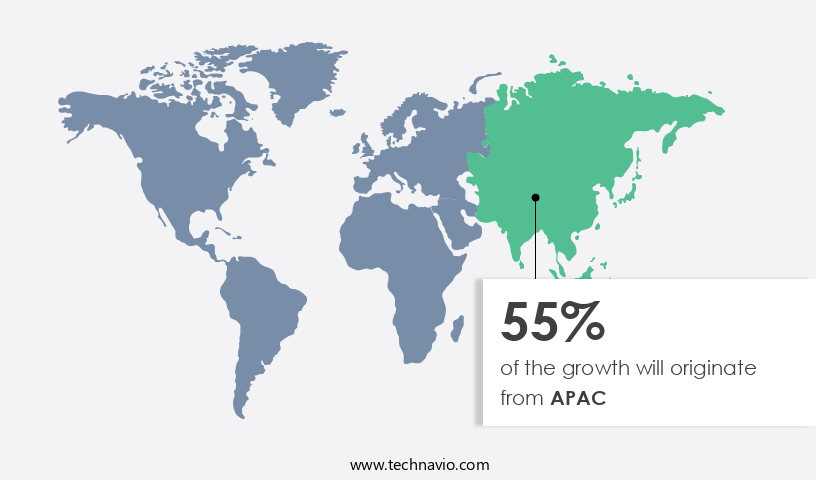
  • APAC is estimated to contribute 55% to the growth of the global market during the forecast period.

Technavio's analysts have elaborately explained the regional trends and drivers that shape the market during the forecast period.

Boron Market Share by Geography

For more insights on the market share of various regions, Request Free Sample

The APAC the market is experiencing significant growth due to increasing demand from various industries, including glass and ceramics, pharmaceuticals, cosmetics, and detergents. The construction sector's expansion, particularly in developing countries like India and China, is driving this trend. Boron is essential for producing IFT glass for energy-efficient buildings and is used in the production of gypsum board, ceramic and enamel coating, and other construction materials. The market in APAC is expected to continue growing during the forecast period, fueled by the increasing demand for glass and ceramics in the construction industry.

Market Dynamics

Our researchers analyzed the data with 2023 as the base year, along with the key drivers, trends, and challenges. A holistic analysis of drivers will help companies refine their marketing strategies to gain a competitive advantage.

What are the key market drivers leading to the rise in the adoption of the Boron Market?

Increase in demand from developing countries is the key driver of the market.

  • Boron is an essential micronutrient for plant nutrition, playing a vital role in boron fixation and crop growth. Boron-deficient soils can lead to leaching and boron-induced stress, resulting in reduced crop quality and yield. Boron-responsive crops and boron-efficient fertilizers are crucial for addressing deficiencies and improving soil boron levels. Boron is also used in various industries, including glass manufacturing, nuclear reactors, and the production of boron-based catalysts, boron nitride, and boron carbide. The global demand for boron is on the rise, particularly in developing countries like China, India, Brazil, Mexico, the Philippines, and Indonesia. Factors such as low transportation costs, easy land availability, cheap labor, and less stringent regulations are attracting boron companies to set up manufacturing units in these regions.
  • The expanding population and increasing disposable income in these countries are driving investments in industries like construction, glass manufacturing, pharmaceuticals, and cosmetics, further fueling the demand for boron. Boron is an essential component in the production of glass and ceramics, making it a crucial element in the glassblowing industry. Glassblowing classes, schools, workshops, and studios use boron-rich soils for glass production. Boron-containing nanoparticles, boron-doped graphene, and flame retardant coatings are also significant applications of boron. In addition, boron is used in various industries, including water treatment, medical devices, composites, solar cells, polymers, aerospace materials, LED lighting, food additives, and cosmetics.

What are the market trends shaping the Boron Market?

Growing demand from the renewable energy sector is the upcoming trend in the market.

  • Boron is an essential micronutrient for plant nutrition, playing a crucial role in cell wall metabolism and lignin biosynthesis. Boron deficiency in soils can lead to reduced crop yield and quality, as well as boron-induced stress and toxicity, resulting in boron-related diseases. Boron fixation and mobility in soil depend on factors like pH, temperature, and soil structure. Boron-rich soils and boron-responsive crops can improve bioavailability, while fertilizer application and management practices can enhance boron efficiency. Boron is also used in various industries, including glass manufacturing, nuclear reactors, and boron-based catalysts for doping in semiconductors and solar cells. Boron is a vital component in the production of boron nitride, which is used as a glassblowing tool and in the manufacture of nitride ceramics, flame retardant coatings, water treatment, medical devices, composites, and LED lighting.
  • Boron carbide is another industrial application, used in aerospace materials and abrasives. Boron is also used in food additives, boron-doped graphene, and neutron capture therapy in the medical field. The growing demand for boron in various industries is expected to drive the market's growth. For instance, the increasing use of borosilicate glass in solar thermal heating systems is a significant factor. Boron is an essential component of this glass, which is used to carry heat transfer fluids in large solar power plants. The declining cost of solar technologies and the growing focus on renewable energy sources are expected to boost the demand for solar thermal heating systems, thereby driving the market's growth.

What challenges does Boron Market face during the growth?

Stringent regulations and policies is a key challenge affecting the market growth.

  • Boron, a naturally occurring element, plays a vital role in various industries, including agriculture, glass manufacturing, and pharmaceuticals. In agriculture, boron is essential for nutrient uptake and plant growth, particularly in boron-deficient soils. Boron fixation and mobility are crucial factors in ensuring boron bioavailability for boron-responsive crops. However, excessive boron levels can lead to toxicity and boron-induced stress, causing boron-related diseases. In glass manufacturing, boron is used for crystallization during glassblowing classes and workshops. Boron nitride and boron carbide are essential components of glassblowing tools and glassblowing books. Boron is also used in glass recycling and in the production of boron-based catalysts, nitride ceramics, flame retardant coatings, water treatment, medical devices, composites, solar cells, polymers, aerospace materials, LED lighting, food additives, boron-doped graphene, and neutron capture therapy.
  • Regulatory bodies, such as the Environmental Protection Agency (EPA) and the European Union's Registration, Evaluation, Authorization, and Restriction of Chemicals (REACH), regulate the use of boron in various applications to ensure safety and environmental sustainability. The Occupational Safety and Health Administration (OSHA) sets workplace safety regulations related to airborne fibers, including those from glass and glass fiber. Proper management of boron application in fertilizers and other industrial processes is essential to maintain soil boron levels and prevent boron leaching. Boron-efficient crops and innovative glassblowing techniques contribute to reducing the environmental impact of boron production.

Exclusive Customer Landscape

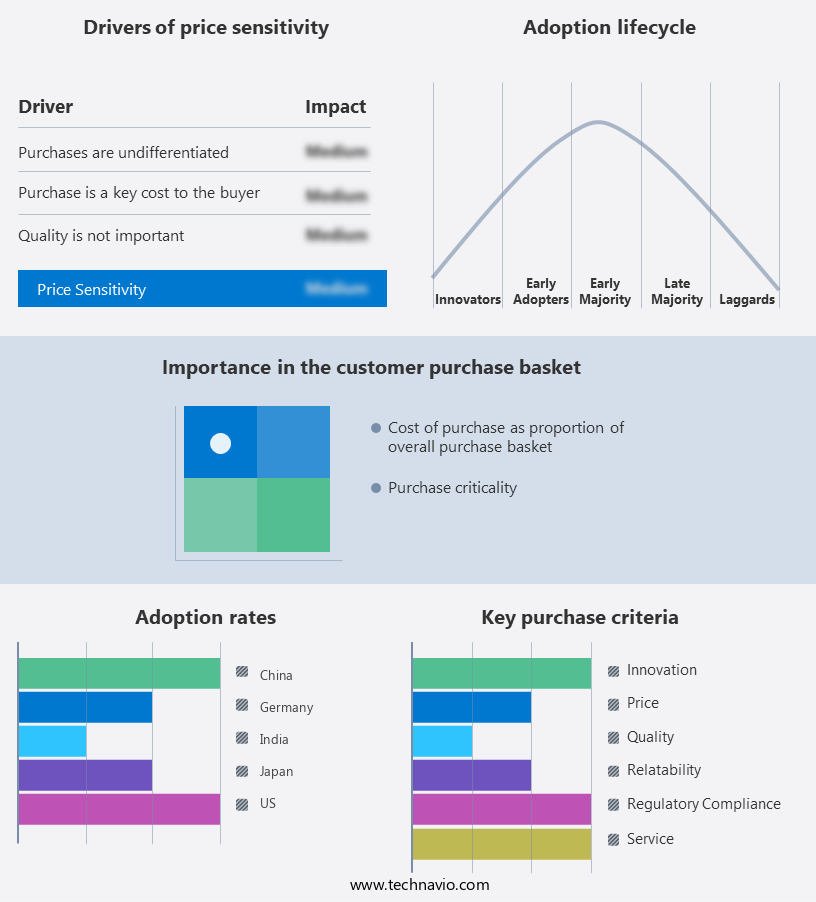
The market forecasting report includes the adoption lifecycle of the market, covering from the innovator's stage to the laggard's stage. It focuses on adoption rates in different regions based on penetration. Furthermore, the market report also includes key purchase criteria and drivers of price sensitivity to help companies evaluate and develop their market growth analysis strategies.

Boron Market Share by Geography

 Customer Landscape

Key Companies & Market Insights

Companies are implementing various strategies, such as strategic alliances, market forecast , partnerships, mergers and acquisitions, geographical expansion, and product/service launches, to enhance their presence in the market.

The market research and growth report includes detailed analyses of the competitive landscape of the market and information about key companies, including:

  • 3M Co.
  • Alpha Chemika
  • American Borate Co.
  • Boron Rubbers India
  • Boron Specialties LLC
  • Central Drug House P Ltd.
  • Eti Maden isletmeleri Genel Mudurlugu
  • Goodfellow Cambridge Ltd.
  • Minera Santa Rita Srl
  • MSE Supplies LLC
  • NANOGRAFI Co. Inc.
  • Nanoshel LLC
  • Orocobre Ltd.
  • Quiborax
  • Rose Mill Co.
  • SB Boron Corp.
  • SCL Italia Spa
  • Stanford Advanced Materials
  • Welvic Australia Pty Ltd.
  • Rio Tinto Ltd.

Qualitative and quantitative analysis of companies has been conducted to help clients understand the wider business environment as well as the strengths and weaknesses of key market players. Data is qualitatively analyzed to categorize companies as pure play, category-focused, industry-focused, and diversified; it is quantitatively analyzed to categorize companies as dominant, leading, strong, tentative, and weak.

Research Analyst Overview

A Comprehensive Overview of Boron's Role in Agriculture, Industry, and Science Boron is an essential micronutrient for plants and animals, playing a crucial role in various biological processes. In agriculture, boron contributes to the growth and development of crops by enhancing root growth, improving fruit setting, and increasing sugar content. Boron deficiency in soils can lead to reduced crop yields and quality, making boron fixation a vital aspect of agricultural management. Boron's importance extends beyond agriculture, as it is a versatile element used in numerous industrial applications. Boron-deficient soils can be remedied through boron application, ensuring optimal soil conditions for boron-responsive crops. The mobility of boron in soils is a critical factor in its bioavailability, and proper fertilizer application is essential for maintaining healthy soil boron levels. Boron's role in industry is significant, with applications ranging from glass manufacturing to nuclear reactors. In glassblowing, boron is used to create borosilicate glass, which is known for its high resistance to thermal shock. Boron nitride, another boron compound, is used in various industries, including aerospace materials, solar cells, and polymers. Boron-based catalysts are also widely used in the production of nitride ceramics, flame retardant coatings, and water treatment. Boron's toxicity and boron-induced stress can pose challenges in both agriculture and industry.

Moreover, boron toxicity can lead to boron-related diseases in crops, while excessive boron levels can negatively impact glass manufacturing processes. Proper management practices, such as optimizing fertilizer application and monitoring soil boron levels, can help mitigate these issues. Boron production methods include open-pit mining and crystallization, with boron deposits found in various parts of the earth's crust. Boron is also recycled from glass waste, making it an environmentally friendly alternative to primary production. Boron's unique properties make it an essential element in various industries, from glassblowing to high-tech applications. In conclusion, boron is a vital micronutrient with a wide range of applications in agriculture, industry, and science. Its role in agriculture ensures healthy crop growth and development, while its industrial applications include glass manufacturing, nuclear reactors, and various high-tech industries. Proper management practices, such as optimizing fertilizer application and monitoring soil boron levels, are essential for maintaining healthy boron levels in both agriculture and industry. Boron's versatility and unique properties make it an essential element for various industries and applications.

Market Scope

Report Coverage

Details

Page number

161

Base year

2023

Historic period

2018-2022

Forecast period

2024-2028

Growth momentum & CAGR

Accelerate at a CAGR of 10.13%

Market growth 2024-2028

USD 1.53 billion

Market structure

Fragmented

YoY growth 2023-2024(%)

12.75

Key countries

US, China, India, Japan, and Germany

Competitive landscape

Leading Companies, Market Positioning of Companies, Competitive Strategies, and Industry Risks

Request Free Sample

What are the Key Data Covered in this Market Research and Growth Report?

  • CAGR of the market during the forecast period
  • Detailed information on factors that will drive the market growth and forecasting between 2024 and 2028
  • Precise estimation of the size of the market  and its contribution of the market in focus to the parent market
  • Accurate predictions about upcoming market growth and trends and changes in consumer behaviour
  • Growth of the market across APAC, North America, Europe, South America, and Middle East and Africa
  • Thorough analysis of the market's competitive landscape and detailed information about companies
  • Comprehensive analysis of factors that will challenge the growth of market companies

We can help! Our analysts can customize this market research report to meet your requirements. Get in touch

1 Executive Summary

  • 1.1 Market overview
    • Exhibit 01: Executive Summary – Chart on Market Overview
    • Exhibit 02: Executive Summary – Data Table on Market Overview
    • Exhibit 03: Executive Summary – Chart on Global Market Characteristics
    • Exhibit 04: Executive Summary – Chart on Market by Geography
    • Exhibit 05: Executive Summary – Chart on Market Segmentation by Application
    • Exhibit 06: Executive Summary – Chart on Market Segmentation by End-user
    • Exhibit 07: Executive Summary – Chart on Incremental Growth
    • Exhibit 08: Executive Summary – Data Table on Incremental Growth
    • Exhibit 09: Executive Summary – Chart on Vendor Market Positioning

2 Market Landscape

  • 2.1 Market ecosystem
    • Exhibit 10: Parent market
    • Exhibit 11: Market Characteristics

3 Market Sizing

  • 3.1 Market definition
    • Exhibit 12: Offerings of vendors included in the market definition
  • 3.2 Market segment analysis
    • Exhibit 13: Market segments
  • 3.3 Market size 2023
    • 3.4 Market outlook: Forecast for 2023-2028
      • Exhibit 14: Chart on Global - Market size and forecast 2023-2028 ($ million)
      • Exhibit 15: Data Table on Global - Market size and forecast 2023-2028 ($ million)
      • Exhibit 16: Chart on Global Market: Year-over-year growth 2023-2028 (%)
      • Exhibit 17: Data Table on Global Market: Year-over-year growth 2023-2028 (%)

    4 Historic Market Size

    • 4.1 Global boron market 2018 - 2022
      • Exhibit 18: Historic Market Size – Data Table on global boron market 2018 - 2022 ($ million)
    • 4.2 Application Segment Analysis 2018 - 2022
      • Exhibit 19: Historic Market Size – Application Segment 2018 - 2022 ($ million)
    • 4.3 End-user Segment Analysis 2018 - 2022
      • Exhibit 20: Historic Market Size – End-user Segment 2018 - 2022 ($ million)
    • 4.4 Geography Segment Analysis 2018 - 2022
      • Exhibit 21: Historic Market Size – Geography Segment 2018 - 2022 ($ million)
    • 4.5 Country Segment Analysis 2018 - 2022
      • Exhibit 22: Historic Market Size – Country Segment 2018 - 2022 ($ million)

    5 Five Forces Analysis

    • 5.1 Five forces summary
      • Exhibit 23: Five forces analysis - Comparison between 2023 and 2028
    • 5.2 Bargaining power of buyers
      • Exhibit 24: Chart on Bargaining power of buyers – Impact of key factors 2023 and 2028
    • 5.3 Bargaining power of suppliers
      • Exhibit 25: Bargaining power of suppliers – Impact of key factors in 2023 and 2028
    • 5.4 Threat of new entrants
      • Exhibit 26: Threat of new entrants – Impact of key factors in 2023 and 2028
    • 5.5 Threat of substitutes
      • Exhibit 27: Threat of substitutes – Impact of key factors in 2023 and 2028
    • 5.6 Threat of rivalry
      • Exhibit 28: Threat of rivalry – Impact of key factors in 2023 and 2028
    • 5.7 Market condition
      • Exhibit 29: Chart on Market condition - Five forces 2023 and 2028

    6 Market Segmentation by Application

    • 6.1 Market segments
      • Exhibit 30: Chart on Application - Market share 2023-2028 (%)
      • Exhibit 31: Data Table on Application - Market share 2023-2028 (%)
    • 6.2 Comparison by Application
      • Exhibit 32: Chart on Comparison by Application
      • Exhibit 33: Data Table on Comparison by Application
    • 6.3 Glass - Market size and forecast 2023-2028
      • Exhibit 34: Chart on Glass - Market size and forecast 2023-2028 ($ million)
      • Exhibit 35: Data Table on Glass - Market size and forecast 2023-2028 ($ million)
      • Exhibit 36: Chart on Glass - Year-over-year growth 2023-2028 (%)
      • Exhibit 37: Data Table on Glass - Year-over-year growth 2023-2028 (%)
    • 6.4 Fertilizers - Market size and forecast 2023-2028
      • Exhibit 38: Chart on Fertilizers - Market size and forecast 2023-2028 ($ million)
      • Exhibit 39: Data Table on Fertilizers - Market size and forecast 2023-2028 ($ million)
      • Exhibit 40: Chart on Fertilizers - Year-over-year growth 2023-2028 (%)
      • Exhibit 41: Data Table on Fertilizers - Year-over-year growth 2023-2028 (%)
    • 6.5 Ceramics - Market size and forecast 2023-2028
      • Exhibit 42: Chart on Ceramics - Market size and forecast 2023-2028 ($ million)
      • Exhibit 43: Data Table on Ceramics - Market size and forecast 2023-2028 ($ million)
      • Exhibit 44: Chart on Ceramics - Year-over-year growth 2023-2028 (%)
      • Exhibit 45: Data Table on Ceramics - Year-over-year growth 2023-2028 (%)
    • 6.6 Detergents - Market size and forecast 2023-2028
      • Exhibit 46: Chart on Detergents - Market size and forecast 2023-2028 ($ million)
      • Exhibit 47: Data Table on Detergents - Market size and forecast 2023-2028 ($ million)
      • Exhibit 48: Chart on Detergents - Year-over-year growth 2023-2028 (%)
      • Exhibit 49: Data Table on Detergents - Year-over-year growth 2023-2028 (%)
    • 6.7 Others - Market size and forecast 2023-2028
      • Exhibit 50: Chart on Others - Market size and forecast 2023-2028 ($ million)
      • Exhibit 51: Data Table on Others - Market size and forecast 2023-2028 ($ million)
      • Exhibit 52: Chart on Others - Year-over-year growth 2023-2028 (%)
      • Exhibit 53: Data Table on Others - Year-over-year growth 2023-2028 (%)
    • 6.8 Market opportunity by Application
      • Exhibit 54: Market opportunity by Application ($ million)
      • Exhibit 55: Data Table on Market opportunity by Application ($ million)

    7 Market Segmentation by End-user

    • 7.1 Market segments
      • Exhibit 56: Chart on End-user - Market share 2023-2028 (%)
      • Exhibit 57: Data Table on End-user - Market share 2023-2028 (%)
    • 7.2 Comparison by End-user
      • Exhibit 58: Chart on Comparison by End-user
      • Exhibit 59: Data Table on Comparison by End-user
    • 7.3 Construction - Market size and forecast 2023-2028
      • Exhibit 60: Chart on Construction - Market size and forecast 2023-2028 ($ million)
      • Exhibit 61: Data Table on Construction - Market size and forecast 2023-2028 ($ million)
      • Exhibit 62: Chart on Construction - Year-over-year growth 2023-2028 (%)
      • Exhibit 63: Data Table on Construction - Year-over-year growth 2023-2028 (%)
    • 7.4 Agriculture - Market size and forecast 2023-2028
      • Exhibit 64: Chart on Agriculture - Market size and forecast 2023-2028 ($ million)
      • Exhibit 65: Data Table on Agriculture - Market size and forecast 2023-2028 ($ million)
      • Exhibit 66: Chart on Agriculture - Year-over-year growth 2023-2028 (%)
      • Exhibit 67: Data Table on Agriculture - Year-over-year growth 2023-2028 (%)
    • 7.5 Personal care - Market size and forecast 2023-2028
      • Exhibit 68: Chart on Personal care - Market size and forecast 2023-2028 ($ million)
      • Exhibit 69: Data Table on Personal care - Market size and forecast 2023-2028 ($ million)
      • Exhibit 70: Chart on Personal care - Year-over-year growth 2023-2028 (%)
      • Exhibit 71: Data Table on Personal care - Year-over-year growth 2023-2028 (%)
    • 7.6 Automotive - Market size and forecast 2023-2028
      • Exhibit 72: Chart on Automotive - Market size and forecast 2023-2028 ($ million)
      • Exhibit 73: Data Table on Automotive - Market size and forecast 2023-2028 ($ million)
      • Exhibit 74: Chart on Automotive - Year-over-year growth 2023-2028 (%)
      • Exhibit 75: Data Table on Automotive - Year-over-year growth 2023-2028 (%)
    • 7.7 Others - Market size and forecast 2023-2028
      • Exhibit 76: Chart on Others - Market size and forecast 2023-2028 ($ million)
      • Exhibit 77: Data Table on Others - Market size and forecast 2023-2028 ($ million)
      • Exhibit 78: Chart on Others - Year-over-year growth 2023-2028 (%)
      • Exhibit 79: Data Table on Others - Year-over-year growth 2023-2028 (%)
    • 7.8 Market opportunity by End-user
      • Exhibit 80: Market opportunity by End-user ($ million)
      • Exhibit 81: Data Table on Market opportunity by End-user ($ million)

    8 Customer Landscape

    • 8.1 Customer landscape overview
      • Exhibit 82: Analysis of price sensitivity, lifecycle, customer purchase basket, adoption rates, and purchase criteria

    9 Geographic Landscape

    • 9.1 Geographic segmentation
      • Exhibit 83: Chart on Market share by geography 2023-2028 (%)
      • Exhibit 84: Data Table on Market share by geography 2023-2028 (%)
    • 9.2 Geographic comparison
      • Exhibit 85: Chart on Geographic comparison
      • Exhibit 86: Data Table on Geographic comparison
    • 9.3 APAC - Market size and forecast 2023-2028
      • Exhibit 87: Chart on APAC - Market size and forecast 2023-2028 ($ million)
      • Exhibit 88: Data Table on APAC - Market size and forecast 2023-2028 ($ million)
      • Exhibit 89: Chart on APAC - Year-over-year growth 2023-2028 (%)
      • Exhibit 90: Data Table on APAC - Year-over-year growth 2023-2028 (%)
    • 9.4 North America - Market size and forecast 2023-2028
      • Exhibit 91: Chart on North America - Market size and forecast 2023-2028 ($ million)
      • Exhibit 92: Data Table on North America - Market size and forecast 2023-2028 ($ million)
      • Exhibit 93: Chart on North America - Year-over-year growth 2023-2028 (%)
      • Exhibit 94: Data Table on North America - Year-over-year growth 2023-2028 (%)
    • 9.5 Europe - Market size and forecast 2023-2028
      • Exhibit 95: Chart on Europe - Market size and forecast 2023-2028 ($ million)
      • Exhibit 96: Data Table on Europe - Market size and forecast 2023-2028 ($ million)
      • Exhibit 97: Chart on Europe - Year-over-year growth 2023-2028 (%)
      • Exhibit 98: Data Table on Europe - Year-over-year growth 2023-2028 (%)
    • 9.6 South America - Market size and forecast 2023-2028
      • Exhibit 99: Chart on South America - Market size and forecast 2023-2028 ($ million)
      • Exhibit 100: Data Table on South America - Market size and forecast 2023-2028 ($ million)
      • Exhibit 101: Chart on South America - Year-over-year growth 2023-2028 (%)
      • Exhibit 102: Data Table on South America - Year-over-year growth 2023-2028 (%)
    • 9.7 Middle East and Africa - Market size and forecast 2023-2028
      • Exhibit 103: Chart on Middle East and Africa - Market size and forecast 2023-2028 ($ million)
      • Exhibit 104: Data Table on Middle East and Africa - Market size and forecast 2023-2028 ($ million)
      • Exhibit 105: Chart on Middle East and Africa - Year-over-year growth 2023-2028 (%)
      • Exhibit 106: Data Table on Middle East and Africa - Year-over-year growth 2023-2028 (%)
    • 9.8 China - Market size and forecast 2023-2028
      • Exhibit 107: Chart on China - Market size and forecast 2023-2028 ($ million)
      • Exhibit 108: Data Table on China - Market size and forecast 2023-2028 ($ million)
      • Exhibit 109: Chart on China - Year-over-year growth 2023-2028 (%)
      • Exhibit 110: Data Table on China - Year-over-year growth 2023-2028 (%)
    • 9.9 US - Market size and forecast 2023-2028
      • Exhibit 111: Chart on US - Market size and forecast 2023-2028 ($ million)
      • Exhibit 112: Data Table on US - Market size and forecast 2023-2028 ($ million)
      • Exhibit 113: Chart on US - Year-over-year growth 2023-2028 (%)
      • Exhibit 114: Data Table on US - Year-over-year growth 2023-2028 (%)
    • 9.10 India - Market size and forecast 2023-2028
      • Exhibit 115: Chart on India - Market size and forecast 2023-2028 ($ million)
      • Exhibit 116: Data Table on India - Market size and forecast 2023-2028 ($ million)
      • Exhibit 117: Chart on India - Year-over-year growth 2023-2028 (%)
      • Exhibit 118: Data Table on India - Year-over-year growth 2023-2028 (%)
    • 9.11 Japan - Market size and forecast 2023-2028
      • Exhibit 119: Chart on Japan - Market size and forecast 2023-2028 ($ million)
      • Exhibit 120: Data Table on Japan - Market size and forecast 2023-2028 ($ million)
      • Exhibit 121: Chart on Japan - Year-over-year growth 2023-2028 (%)
      • Exhibit 122: Data Table on Japan - Year-over-year growth 2023-2028 (%)
    • 9.12 Germany - Market size and forecast 2023-2028
      • Exhibit 123: Chart on Germany - Market size and forecast 2023-2028 ($ million)
      • Exhibit 124: Data Table on Germany - Market size and forecast 2023-2028 ($ million)
      • Exhibit 125: Chart on Germany - Year-over-year growth 2023-2028 (%)
      • Exhibit 126: Data Table on Germany - Year-over-year growth 2023-2028 (%)
    • 9.13 Market opportunity by geography
      • Exhibit 127: Market opportunity by geography ($ million)
      • Exhibit 128: Data Tables on Market opportunity by geography ($ million)

    10 Drivers, Challenges, and Trends

    • 10.1 Market drivers
      • 10.2 Market challenges
        • 10.3 Impact of drivers and challenges
          • Exhibit 129: Impact of drivers and challenges in 2023 and 2028
        • 10.4 Market trends

          11 Vendor Landscape

          • 11.1 Overview
            • 11.2 Vendor landscape
              • Exhibit 130: Overview on Criticality of inputs and Factors of differentiation
            • 11.3 Landscape disruption
              • Exhibit 131: Overview on factors of disruption
            • 11.4 Industry risks
              • Exhibit 132: Impact of key risks on business

            12 Vendor Analysis

            • 12.1 Vendors covered
              • Exhibit 133: Vendors covered
            • 12.2 Market positioning of vendors
              • Exhibit 134: Matrix on vendor position and classification
            • 12.3 3M Co.
              • Exhibit 135: 3M Co. - Overview
              • Exhibit 136: 3M Co. - Business segments
              • Exhibit 137: 3M Co. - Key news
              • Exhibit 138: 3M Co. - Key offerings
              • Exhibit 139: 3M Co. - Segment focus
            • 12.4 American Borate Co.
              • Exhibit 140: American Borate Co. - Overview
              • Exhibit 141: American Borate Co. - Product / Service
              • Exhibit 142: American Borate Co. - Key offerings
            • 12.5 Boron Specialties LLC
              • Exhibit 143: Boron Specialties LLC - Overview
              • Exhibit 144: Boron Specialties LLC - Product / Service
              • Exhibit 145: Boron Specialties LLC - Key offerings
            • 12.6 Eti Maden isletmeleri Genel Mudurlugu
              • Exhibit 146: Eti Maden isletmeleri Genel Mudurlugu - Overview
              • Exhibit 147: Eti Maden isletmeleri Genel Mudurlugu - Product / Service
              • Exhibit 148: Eti Maden isletmeleri Genel Mudurlugu - Key offerings
            • 12.7 Goodfellow Cambridge Ltd.
              • Exhibit 149: Goodfellow Cambridge Ltd. - Overview
              • Exhibit 150: Goodfellow Cambridge Ltd. - Product / Service
              • Exhibit 151: Goodfellow Cambridge Ltd. - Key offerings
            • 12.8 Minera Santa Rita Srl
              • Exhibit 152: Minera Santa Rita Srl - Overview
              • Exhibit 153: Minera Santa Rita Srl - Product / Service
              • Exhibit 154: Minera Santa Rita Srl - Key offerings
            • 12.9 Nanoshel LLC
              • Exhibit 155: Nanoshel LLC - Overview
              • Exhibit 156: Nanoshel LLC - Product / Service
              • Exhibit 157: Nanoshel LLC - Key offerings
            • 12.10 Orocobre Ltd.
              • Exhibit 158: Orocobre Ltd. - Overview
              • Exhibit 159: Orocobre Ltd. - Business segments
              • Exhibit 160: Orocobre Ltd. - Key offerings
              • Exhibit 161: Orocobre Ltd. - Segment focus
            • 12.11 Quiborax
              • Exhibit 162: Quiborax - Overview
              • Exhibit 163: Quiborax - Product / Service
              • Exhibit 164: Quiborax - Key offerings
            • 12.12 Rio Tinto Ltd.
              • Exhibit 165: Rio Tinto Ltd. - Overview
              • Exhibit 166: Rio Tinto Ltd. - Business segments
              • Exhibit 167: Rio Tinto Ltd. - Key news
              • Exhibit 168: Rio Tinto Ltd. - Key offerings
              • Exhibit 169: Rio Tinto Ltd. - Segment focus
            • 12.13 Rose Mill Co.
              • Exhibit 170: Rose Mill Co. - Overview
              • Exhibit 171: Rose Mill Co. - Product / Service
              • Exhibit 172: Rose Mill Co. - Key offerings
            • 12.14 SB Boron Corp.
              • Exhibit 173: SB Boron Corp. - Overview
              • Exhibit 174: SB Boron Corp. - Product / Service
              • Exhibit 175: SB Boron Corp. - Key offerings
            • 12.15 SCL Italia Spa
              • Exhibit 176: SCL Italia Spa - Overview
              • Exhibit 177: SCL Italia Spa - Product / Service
              • Exhibit 178: SCL Italia Spa - Key offerings
            • 12.16 Stanford Advanced Materials
              • Exhibit 179: Stanford Advanced Materials - Overview
              • Exhibit 180: Stanford Advanced Materials - Product / Service
              • Exhibit 181: Stanford Advanced Materials - Key offerings
            • 12.17 Welvic Australia Pty Ltd.
              • Exhibit 182: Welvic Australia Pty Ltd. - Overview
              • Exhibit 183: Welvic Australia Pty Ltd. - Product / Service
              • Exhibit 184: Welvic Australia Pty Ltd. - Key offerings

            13 Appendix

            • 13.1 Scope of the report
              • 13.2 Inclusions and exclusions checklist
                • Exhibit 185: Inclusions checklist
                • Exhibit 186: Exclusions checklist
              • 13.3 Currency conversion rates for US$
                • Exhibit 187: Currency conversion rates for US$
              • 13.4 Research methodology
                • Exhibit 188: Research methodology
                • Exhibit 189: Validation techniques employed for market sizing
                • Exhibit 190: Information sources
              • 13.5 List of abbreviations
                • Exhibit 191: List of abbreviations

              Research Methodology

              Technavio presents a detailed picture of the market by way of study, synthesis, and summation of data from multiple sources. The analysts have presented the various facets of the market with a particular focus on identifying the key industry influencers. The data thus presented is comprehensive, reliable, and the result of extensive research, both primary and secondary.

              INFORMATION SOURCES

              Primary sources

              • Manufacturers and suppliers
              • Channel partners
              • Industry experts
              • Strategic decision makers

              Secondary sources

              • Industry journals and periodicals
              • Government data
              • Financial reports of key industry players
              • Historical data
              • Press releases

              DATA ANALYSIS

              Data Synthesis

              • Collation of data
              • Estimation of key figures
              • Analysis of derived insights

              Data Validation

              • Triangulation with data models
              • Reference against proprietary databases
              • Corroboration with industry experts

              REPORT WRITING

              Qualitative

              • Market drivers
              • Market challenges
              • Market trends
              • Five forces analysis

              Quantitative

              • Market size and forecast
              • Market segmentation
              • Geographical insights
              • Competitive landscape

              Interested in this report?

              Get your sample now to see our research methodology and insights!

              Download Now

              Frequently Asked Questions

              Boron market growth will increase by $ 1533.04 mn during 2024-2028 .

              The Boron market is expected to grow at a CAGR of 10.13% during 2024-2028 .

              Boron market is segmented by Application( Glass, Fertilizers, Ceramics, Detergents, Others) End-user( Construction, Agriculture, Personal care, Automotive, Others)

              3M Co., Alpha Chemika, American Borate Co., Boron Rubbers India, Boron Specialties LLC, Central Drug House P Ltd., Eti Maden isletmeleri Genel Mudurlugu, Goodfellow Cambridge Ltd., Minera Santa Rita Srl, MSE Supplies LLC, NANOGRAFI Co. Inc., Nanoshel LLC, Orocobre Ltd., Quiborax, Rose Mill Co., SB Boron Corp., SCL Italia Spa, Stanford Advanced Materials, Welvic Australia Pty Ltd., Rio Tinto Ltd. are a few of the key vendors in the Boron market.

              APAC will register the highest growth rate of 55% among the other regions. Therefore, the Boron market in APAC is expected to garner significant business opportunities for the vendors during the forecast period.

              US, China, India, Japan, Germany

              • Increase in demand from developing countriesThe demand for boron from developing countries such as China is the driving factor this market.
              • India is the driving factor this market.
              • Brazil is the driving factor this market.
              • Mexico is the driving factor this market.
              • the Philippines is the driving factor this market.
              • and Indonesia is expected to increase in the next five years. Many vendors of boron are shifting their manufacturing units to these regions due to factors like low transportation costs is the driving factor this market.
              • easy land availability is the driving factor this market.
              • cheap labor is the driving factor this market.
              • easy access to raw materials is the driving factor this market.
              • and less stringent government regulations and policies. The expanding population is the driving factor this market.
              • high disposable income is the driving factor this market.
              • and increasing purchasing power in developing countries of APAC and South America are prompting higher investments in the construction is the driving factor this market.
              • glass manufacturing is the driving factor this market.
              • pharmaceutical is the driving factor this market.
              • and cosmetics industries. The growing use of boron to manufacture glass and ceramics is expected to foster the markets growth. The increase in foreign direct investment (FDI) in countries like India is expected to drive the growth of the regional manufacturing and construction markets. The growing construction activities in APAC and the Middle East will boost the demand for boron. The increasing focus on infrastructure projects in developing countries will drive the demand for boron is the driving factor this market.
              • which is expected to foster the growth of the global boron market during the forecast period. is the driving factor this market.

              The Boron market vendors should focus on grabbing business opportunities from the Glass segment as it accounted for the largest market share in the base year.