Brachytherapy Afterloaders Market Size 2024-2028
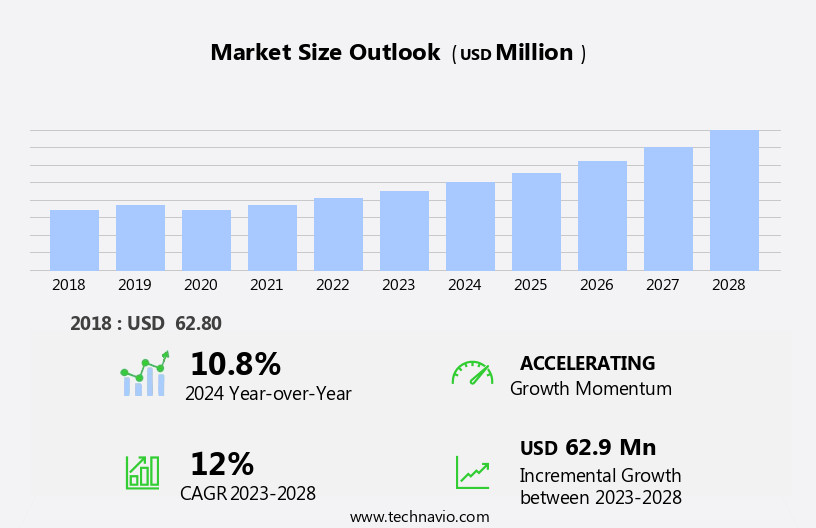
The brachytherapy afterloaders market size is forecast to increase by USD 62.9 million at a CAGR of 12% between 2023 and 2028.
- The market is witnessing significant growth due to the rise in cancer incidence and increasing focus on developing countries. The increasing number of cancer patients worldwide is driving the demand for advanced cancer treatment technologies, including brachytherapy afterloaders. Furthermore, the high cost of these devices is a major challenge for the market, as they are not affordable for all patients.
- However, the market is expected to grow steadily due to the benefits offered by brachytherapy, such as precise radiation delivery and reduced side effects compared to traditional external beam radiation therapy. Additionally, the increasing investment in research and development activities and radiotherapy devices by market players is expected to lead to the launch of more cost-effective and efficient brachytherapy afterloaders, making them accessible to a larger patient population.
- In summary, the market for brachytherapy afterloaders is expected to grow steadily due to the increasing incidence of cancer, focus on developing countries, and investment in research and development of medical technologies, despite the high cost being a significant challenge.
What will be the Size of the Brachytherapy Afterloaders Market During the Forecast Period?
- The market is witnessing significant growth due to the increasing prevalence of cancer and the subsequent demand for advanced radiotherapy treatments. Brachytherapy, a type of radiotherapy, utilizes afterloaders to deliver high-dose-rate (HDR) or low-dose-rate (LDR) radiation directly to the tumor site. This targeted approach reduces radiotherapy side effects, making it an attractive alternative to traditional external beam radiation therapy. Radiation oncology is increasingly adopting brachytherapy for preventive and palliative treatment of various types of cancer, including skin cancer, melanoma, leukemia, lymphoma, and others. The technology's ability to offer personalized radiotherapy planning and precision dosage delivery further enhances its appeal.
- However, concerns regarding the complexity and cost of brachytherapy afterloader systems may hinder market growth. Despite these challenges, advancements in radiotherapy technology continue to drive innovation, such as the development of more user-friendly systems and the integration of artificial intelligence for improved treatment planning and delivery. Cancer screening programs and the growing awareness of radiotherapy as an effective cancer treatment modality are expected to fuel the demand for brachytherapy afterloaders In the coming years. Overall, the market is poised for continued growth as the need for effective, targeted cancer treatments increases.
How is this Brachytherapy Afterloaders Industry segmented and which is the largest segment?
The brachytherapy afterloaders industry research report provides comprehensive data (region-wise segment analysis), with forecasts and estimates in "USD million" for the period 2024-2028, as well as historical data from 2018-2022 for the following segments.
- Product
- HDR afterloaders
- PDR afterloaders
- Geography
- North America
- Canada
- US
- Europe
- Germany
- UK
- France
- Italy
- Asia
- China
- India
- Japan
- South Korea
- Rest of World (ROW)
- North America
By Product Insights
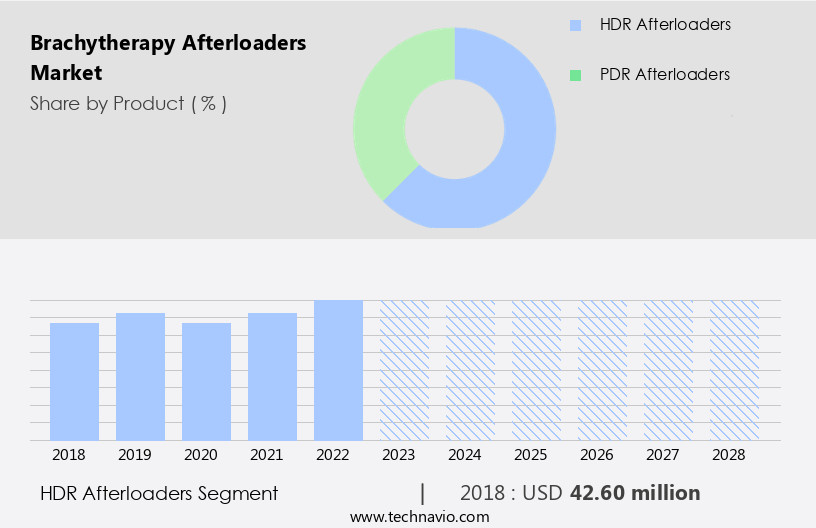
- The hdr afterloaders segment is estimated to witness significant growth during the forecast period.
Brachytherapy, a form of internal radiation therapy, utilizes radioactive sources placed near or inside a tumor for a defined period. High-dose rate (HDR) brachytherapy, delivering more than 12 gray/hour (Gy/h), requires the use of a remote afterloader to transfer the radioactive source through applicators and tubes to the treatment site. HDR brachytherapy is administered in specialized rooms due to the high-dose nature of the procedure. Imaging techniques such as ultrasound, magnetic resonance imaging (MRI), and Power Doppler are used to guide the placement of the radioactive seeds. HDR brachytherapy is commonly used for cancer types like breast and prostate, aiding In the survival of cancer cells.
Cancer therapy centers employ HDR brachytherapy to treat various cancer cases, using advanced technologies like Positron Emission Tomography (PET) and imaging techniques to optimize treatment. The healthcare infrastructure continues to expand, driving the demand for HDR brachytherapy afterloaders.
Get a glance at the Brachytherapy Afterloaders Industry report of share of various segments Request Free Sample
The HDR afterloaders segment was valued at USD 42.60 million in 2018 and showed a gradual increase during the forecast period.
Regional Analysis
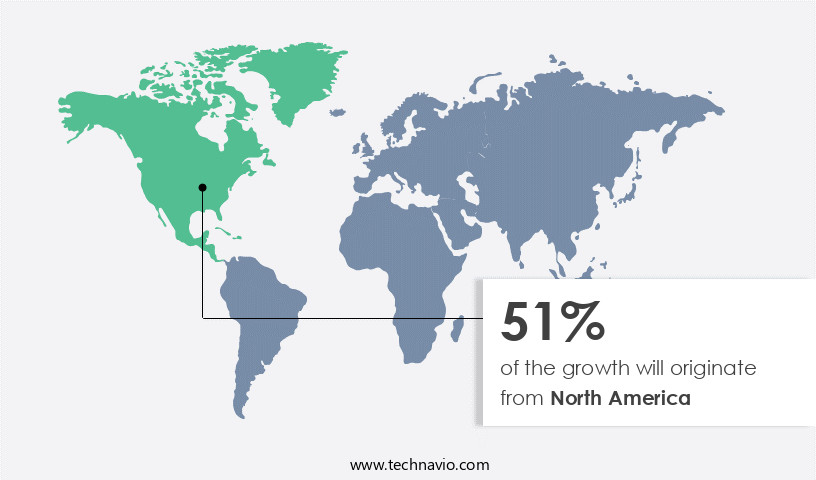
- North America is estimated to contribute 51% to the growth of the global market during the forecast period.
Technavio's analysts have elaborately explained the regional trends and drivers that shape the market during the forecast period.
For more insights on the market share of various regions, Request Free Sample
The North American market for brachytherapy afterloaders represents a significant portion of the global brachytherapy afterloader market, fueled by advanced healthcare infrastructure, a growing geriatric population, and a rising number of cancer cases. In this region, the US stands out due to its sophisticated healthcare system and high adoption of advanced medical technologies. Brachytherapy, a type of radiation therapy, is increasingly popular due to its ability to deliver radiation directly to tumors while minimizing exposure to healthy tissues. This targeted approach is particularly beneficial for treating cancers such as prostate and breast cancer. The adoption of imaging techniques like ultrasound, magnetic resonance imaging, power doppler imaging, and positron emission tomography (PET) has further boosted the use of brachytherapy. The integration of these imaging techniques with brachytherapy enables precise tumor localization and treatment planning, enhancing the overall effectiveness of cancer therapy.
Market Dynamics
Our researchers analyzed the data with 2023 as the base year, along with the key drivers, trends, and challenges. A holistic analysis of drivers will help companies refine their marketing strategies to gain a competitive advantage.
What are the key market drivers leading to the rise In the adoption of Brachytherapy Afterloaders Industry?
Increase in incidence of cancer is the key driver of the market.
- Brachytherapy, a form of cancer treatment that utilizes radioactive seeds placed directly into or near the tumor, is gaining popularity due to its precision and minimal side effects. Brachytherapy afterloaders, devices used to place and manage the radioactive sources during treatment, are essential in this process. Ultrasound and magnetic resonance imaging are commonly used for imaging techniques to guide the placement of the seeds. HDR (High-Dose-Rate) and PDR (Low-Dose-Rate) brachytherapy afterloaders are utilized in treating various types of cancer, such as gynecologic, lung, breast, and prostate. The global cancer incidence is projected to increase significantly due to risk factors like smoking, obesity, and viral infections, as well as the aging population.
- By 2030, approximately 2,924 cases per million population are expected. Brachytherapy afterloaders play a crucial role in cancer therapy centers, ensuring accurate radiation delivery and minimizing exposure to healthy surrounding tissue. Imaging techniques like power doppler and positron emission tomography are employed to monitor surviving cancer cells and assess treatment effectiveness. The market for brachytherapy afterloaders is poised for growth, driven by the increasing cancer cases and advancements in imaging technologies.
What are the market trends shaping the Brachytherapy Afterloaders Industry?
Increasing focus on developing countries is the upcoming market trend.
- The market is experiencing significant growth due to the increasing prevalence of cancer, particularly in developing countries. With an aging population and rising urbanization leading to lifestyle changes, cancer cases are on the rise in regions such as Asia and South America. Brachytherapy, which utilizes radioactive seeds placed directly into or near a tumor, offers precision and reduced side effects compared to traditional radiation therapies. This makes it an attractive option for localized tumors, including breast and prostate cancer. Governments and healthcare organizations In these regions are investing in healthcare infrastructure to address the rising cancer rates, leading to increased adoption of advanced brachytherapy techniques.
- Imaging techniques such as ultrasound, magnetic resonance imaging, power doppler imaging, and positron emission tomography are essential for accurate placement of the radioactive seeds. Brachytherapy afterloaders facilitate the safe and efficient delivery of the radioactive source during treatment. Cancer therapy centers are integrating brachytherapy into their offerings, further driving market growth. The use of brachytherapy is expected to increase as survivors of cancer seek to eradicate surviving cancer cells and improve their quality of life. The integration of imaging techniques and advanced technology in brachytherapy afterloaders is crucial for accurate and effective treatment delivery. Overall, the market is poised for substantial growth as the demand for cancer treatment solutions continues to rise in developing countries.
What challenges does the Brachytherapy Afterloaders Industry face during its growth?
High cost of brachytherapy afterloaders is a key challenge affecting the industry growth.
- Brachytherapy afterloaders, essential devices used in cancer treatment for delivering radioactive seeds to tumor sites, face adoption challenges due to their high capital costs. The price range for these afterloaders is significant, ranging from USD100,000 to USD600,000, depending on their features and technology level. Healthcare facilities must also bear additional expenses for afterloader maintenance, which averages 10% of the purchase price annually. An HDR suite, including a dedicated HDR room and ancillary X-ray imaging equipment, costs approximately USD 350,000. Renovating conventional hospital rooms to accommodate brachytherapy afterloaders necessitates substantial capital expenditures. Imaging techniques such as ultrasound, magnetic resonance imaging, power doppler imaging, positron emission tomography, and PET-CT scans play a crucial role in cancer diagnosis and treatment planning.
- Brachytherapy, a form of radiation therapy, is used in cancer treatment for breast cancer, prostate cancer, and other tumors. Surviving cancer cells may remain after primary treatment, necessitating advanced cancer therapies like brachytherapy. Cancer therapy centers employ various imaging techniques and radiation sources to ensure precise cancer treatment. Brachytherapy afterloaders are integral to this process, making their adoption crucial In the fight against cancer.
Exclusive Customer Landscape
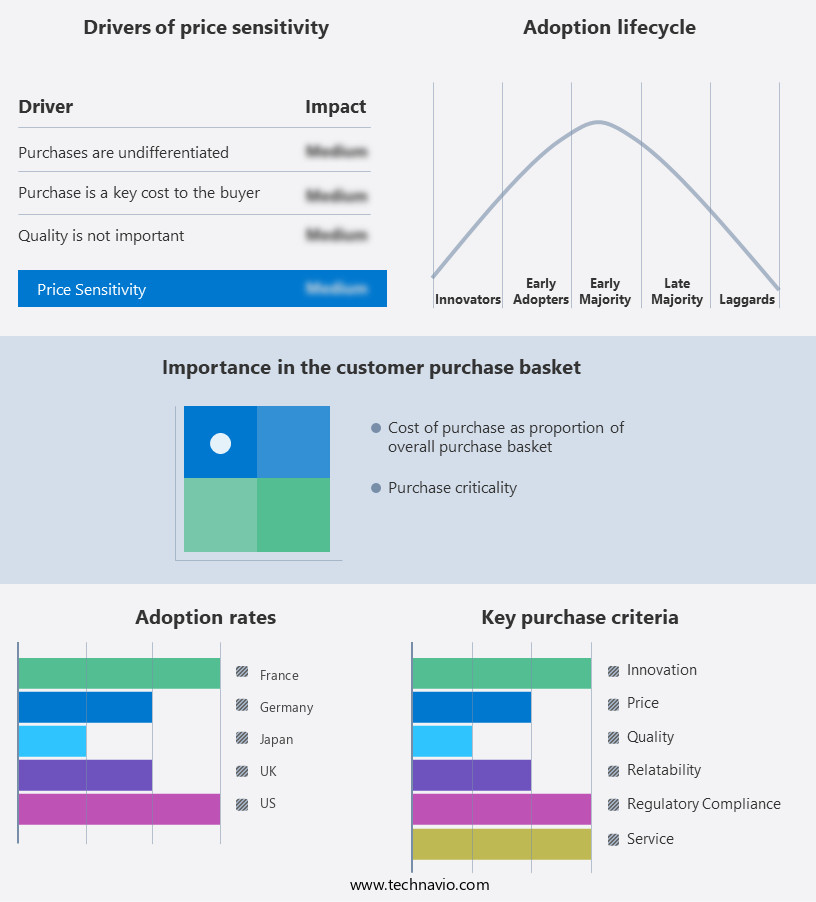
The brachytherapy afterloaders market forecasting report includes the adoption lifecycle of the market, covering from the innovator's stage to the laggard's stage. It focuses on adoption rates in different regions based on penetration. Furthermore, the brachytherapy afterloaders market report also includes key purchase criteria and drivers of price sensitivity to help companies evaluate and develop their market growth analysis strategies.
Customer Landscape
Key Companies & Market Insights
Companies are implementing various strategies, such as strategic alliances, brachytherapy afterloaders market forecast, partnerships, mergers and acquisitions, geographical expansion, and product/service launches, to enhance their presence In the industry.
The industry research and growth report includes detailed analyses of the competitive landscape of the market and information about key companies, including:
- BEBIG Medical GmbH
- Best Medical International Inc.
- Eckert and Ziegler AG
- Elekta AB
- Varian Medical Systems Inc.
Qualitative and quantitative analysis of companies has been conducted to help clients understand the wider business environment as well as the strengths and weaknesses of key industry players. Data is qualitatively analyzed to categorize companies as pure play, category-focused, industry-focused, and diversified; it is quantitatively analyzed to categorize companies as dominant, leading, strong, tentative, and weak.
Research Analyst Overview
Brachytherapy, a form of internal radiation therapy, has gained significant attention In the realm of cancer treatment due to its ability to deliver high doses of radiation directly to the tumor site. This targeted approach reduces exposure to healthy surrounding tissue, leading to fewer side effects and improved patient outcomes. One essential component of brachytherapy is the afterloader, a device used to position and deliver the radioactive source to the tumor site. The market is witnessing steady growth, driven by the increasing prevalence of cancer and the rising demand for minimally invasive cancer treatment options. The geriatric population, in particular, is a significant consumer of brachytherapy due to its efficacy in treating various types of cancer, including breast and prostate cancer, in older adults.
Brachytherapy afterloaders are designed to facilitate the precise placement and delivery of radioactive sources to the tumor site. These devices are typically connected to an external control unit, which enables the radiation oncologist to manipulate the position of the radioactive source withIn the tumor, ensuring optimal dose delivery. The healthcare infrastructure supporting brachytherapy is expanding, with an increasing number of cancer therapy centers adopting this technology to offer patients more personalized and effective treatment options. The integration of advanced imaging techniques, such as power doppler imaging and positron emission tomography (PET), further enhances the accuracy and efficacy of brachytherapy.
Despite the numerous benefits of brachytherapy, there are challenges associated with its implementation. These include the need for specialized expertise, the cost of equipment and maintenance, and the handling and disposal of radioactive material. However, ongoing research and development efforts are addressing these challenges, leading to advancements in brachytherapy technology and increased accessibility to this valuable cancer treatment modality. The market is expected to continue its growth trajectory, driven by the increasing demand for personalized cancer treatments and the ongoing advancements in brachytherapy technology. As the global population ages and the incidence of cancer continues to rise, the importance of brachytherapy as a viable cancer treatment option becomes increasingly apparent.
The future of brachytherapy is bright, with numerous opportunities for innovation and growth in this dynamic and evolving market. In conclusion, the market is experiencing steady growth due to the increasing demand for minimally invasive cancer treatment options and the ongoing advancements in brachytherapy technology. The geriatric population, in particular, is a significant consumer of brachytherapy due to its efficacy in treating various types of cancer. The healthcare infrastructure supporting brachytherapy is expanding, with an increasing number of cancer therapy centers adopting this technology. Despite challenges, the future of brachytherapy is bright, with numerous opportunities for innovation and growth.
|
Market Scope |
|
|
Report Coverage |
Details |
|
Page number |
154 |
|
Base year |
2023 |
|
Historic period |
2018-2022 |
|
Forecast period |
2024-2028 |
|
Growth momentum & CAGR |
Accelerate at a CAGR of 12% |
|
Market growth 2024-2028 |
USD 62.9 million |
|
Market structure |
Concentrated |
|
YoY growth 2023-2024(%) |
10.8 |
|
Key countries |
US, Germany, UK, France, Japan, China, India, Canada, South Korea, and Italy |
|
Competitive landscape |
Leading Companies, Market Positioning of Companies, Competitive Strategies, and Industry Risks |
What are the Key Data Covered in this Brachytherapy Afterloaders Market Research and Growth Report?
- CAGR of the Brachytherapy Afterloaders industry during the forecast period
- Detailed information on factors that will drive the growth and forecasting between 2024 and 2028
- Precise estimation of the size of the market and its contribution of the industry in focus to the parent market
- Accurate predictions about upcoming growth and trends and changes in consumer behaviour
- Growth of the market across North America, Europe, Asia, and Rest of World (ROW)
- Thorough analysis of the market's competitive landscape and detailed information about companies
- Comprehensive analysis of factors that will challenge the brachytherapy afterloaders market growth of industry companies
We can help! Our analysts can customize this brachytherapy afterloaders market research report to meet your requirements.


