
Brazil Sports Nutrition Market Size 2025-2029
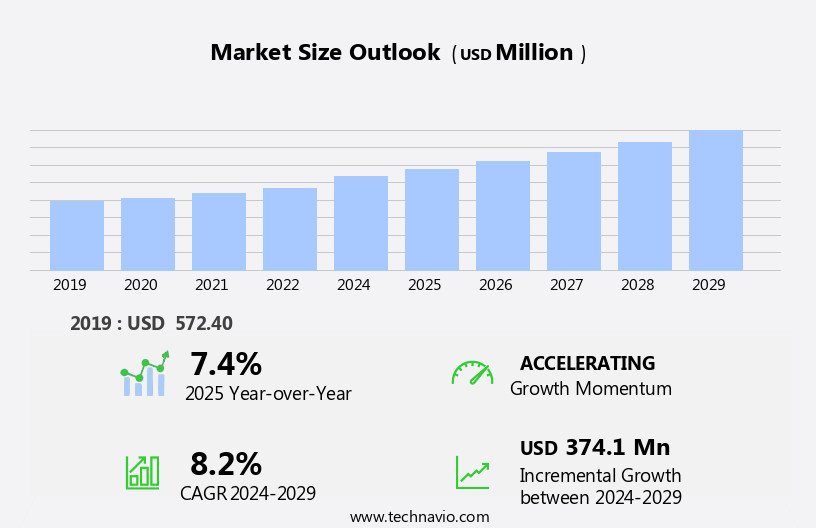
The brazil sports nutrition market size is forecast to increase by USD 374.1 million million at a CAGR of 8.2% between 2024 and 2029.
- The market is experiencing significant growth, driven by the increasing awareness of health and fitness among the population. With a growing number of Brazilians adopting active lifestyles and participating in sports, there is a rising demand for nutritional support to enhance performance and aid in recovery. However, this market is not without challenges. Quality and safety concerns related to sports nutrition products have become a major focus for consumers and regulators alike. Ensuring transparency and adherence to strict regulations will be crucial for companies looking to capitalize on this market opportunity.
- As the market continues to evolve, staying abreast of emerging trends and consumer preferences will be essential for success. Companies seeking to enter or expand their presence In the Brazilian Sports Nutrition Market should prioritize product innovation, transparency, and a deep of local regulations and consumer needs.
What will be the size of the Brazil Sports Nutrition Market during the forecast period?
- The Brazilian sports nutrition market exhibits growth, driven by the increasing prevalence of health-conscious and active consumers. This market encompasses a wide range of products, including nutrients, minerals, amino acids, protein powders, sports drinks, ready-to-drink protein drinks, iso drinks, and sports supplements. Dietary preferences, such as vegan and clean labels, are gaining traction, as consumers prioritize sustainability practices and convenient consumption. Elite athletes and fitness enthusiasts fuel the demand for high-performance sports food and supplements. The market's sizeable growth can be attributed to the rising popularity of a healthy and active lifestyle among young consumers.
- The powder segment dominates the market, with sports drinks and capsule supplements following closely. Bioavailability and convenience are key factors influencing consumer inclination towards these products. The market is expected to continue its upward trajectory, driven by the burgeoning wellness and fitness trends.
How is this market segmented?
The market research report provides comprehensive data (region-wise segment analysis), with forecasts and estimates in "USD million" for the period 2025-2029, as well as historical data from 2019-2023 for the following segments.
- Application
- Post-workout
- Pre-workout
- Others
- Distribution Channel
- Offline
- Online
- Product
- Non-protein sports nutrition
- Protein powder
- Protein RTD
- Protein bar
- Geography
- Brazil
By Application Insights
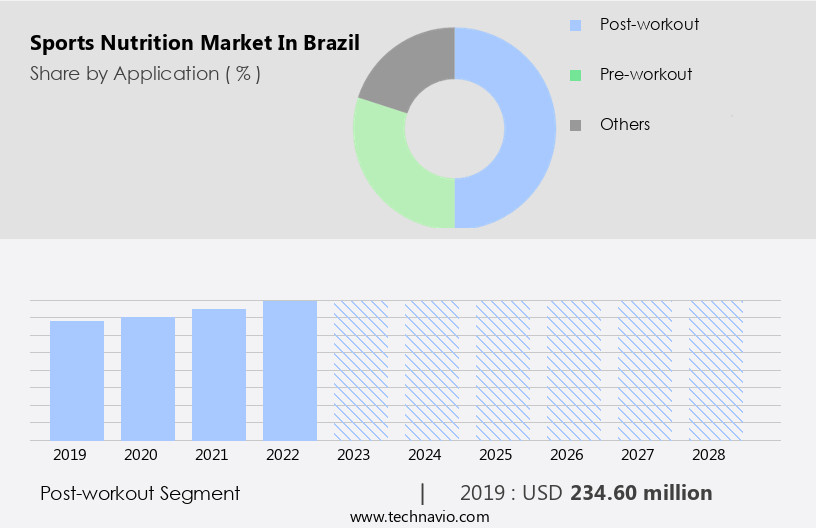
The post-workout segment is estimated to witness significant growth during the forecast period.
The market witnessed notable growth In the post-workout segment in 2024. This trend can be attributed to the increasing awareness of the importance of sports nutrition in aiding recovery after intense workouts. Post-workout sports nutrition products, consumed within 30 minutes to 2 hours post-exercise, are crucial for replenishing lost nutrients, particularly carbohydrates, which aid in energy restoration. The growing health-conscious consumer base in Brazil, with diverse dietary preferences and wellness goals, is driving the demand for these products. Convenient consumption options, such as protein powders, sports drinks, and RTD protein drinks, cater to the busy lifestyles of fitness enthusiasts.
Sustainability practices and clean labels are also key considerations for health-conscious consumers. The market encompasses various product categories, including protein supplements, sports vitamins, energy gels, and sports food. Targeted demographics include elite athletes, individuals with sedentary lifestyles, and those following unhealthy diets due to chronic diseases like diabetes and obesity. The market's growth is further fueled by the increasing prevalence of obesity and related health concerns. Bioavailability, vegan-friendly options, and convenient supplements are major aspects shaping the market dynamics. Specialty stores and consumer inclination towards a healthy and active lifestyle continue to influence market growth.
Get a glance at the market share of various segments Request Free Sample
The Post-workout segment was valued at USD 234.60 million in 2019 and showed a gradual increase during the forecast period.
Market Dynamics
Our researchers analyzed the data with 2024 as the base year, along with the key drivers, trends, and challenges. A holistic analysis of drivers will help companies refine their marketing strategies to gain a competitive advantage.
What are the key market drivers leading to the rise in adoption of Brazil Sports Nutrition Market?
- Growing awareness of health and fitness is the key driver of the market.
- The global sports nutrition market is experiencing significant growth due to the increasing awareness of health and fitness among consumers. This trend is driven by the that proper nutrition plays a crucial role in optimizing workouts and athletic performance. Sports nutrition products, such as protein supplements, amino acids, and energy boosters, are popular choices for individuals seeking to enhance their fitness journey. These products provide essential nutrients for muscle building, repair, and recovery, making them indispensable for athletes and fitness enthusiasts.
- Moreover, with a growing focus on maintaining a healthy body weight and composition, meal replacement shakes, fat burners, and metabolism boosters are also gaining popularity. The market's growth is expected to continue as people prioritize their health and wellness.
What are the market trends shaping the Brazil Sports Nutrition Market?
- Increased demand for nutritional support is the upcoming trend In the market.
- The sports nutrition market has experienced significant growth due to the increasing awareness of the importance of proper nutrition for optimizing workouts and athletic performance. Protein supplements, such as powders, shakes, and bars, are popular choices among athletes and fitness enthusiasts, as they aid in muscle building, repair, and recovery. The demand for these products is driven by the need for effective post-workout recovery solutions.
- Recovery supplements, including amino acids, branched-chain amino acids (BCAAs), and electrolyte blends, are also in high demand due to their ability to reduce muscle soreness and speed up recovery. With the rising trend of intense physical workouts, the need for nutritional support to enhance performance and facilitate recovery is expected to continue.
What challenges does Brazil Sports Nutrition Market face during the growth?
- Quality and safety concerns related to sports nutrition products is a key challenge affecting the market growth.
- In the market, ensuring the safety and quality of ingredients is paramount. Reliable sourcing of protein sources, such as whey or plant-based proteins, is essential to meet purity standards and avoid health risks. Contamination or adulteration with banned or harmful substances is a significant concern, as athletes and consumers seek to avoid inadvertent doping violations and adverse health effects. Brands must comply with stringent labeling regulations to accurately reflect ingredient quantities and maintain transparency with consumers.
- Adherence to these regulations is crucial for maintaining trust and credibility In the market.
Exclusive Brazil Sports Nutrition Market Customer Landscape
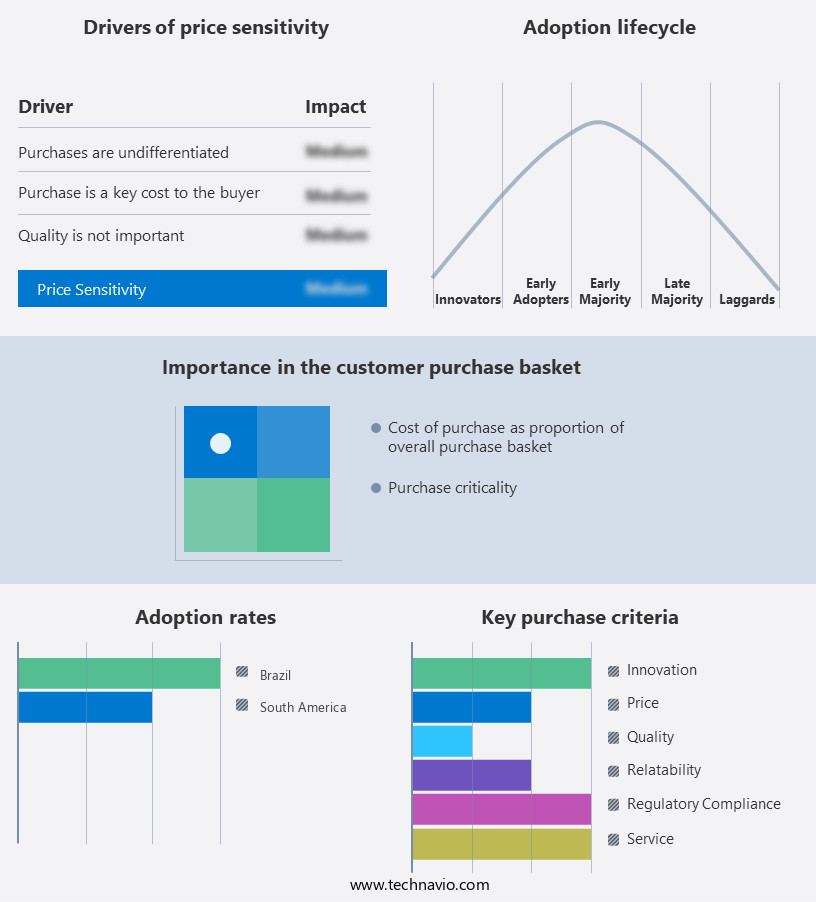
The market forecasting report includes the adoption lifecycle of the market, covering from the innovator’s stage to the laggard’s stage. It focuses on adoption rates in different regions based on penetration. Furthermore, the report also includes key purchase criteria and drivers of price sensitivity to help companies evaluate and develop their market growth analysis strategies.
Customer Landscape
Key Companies & Market Insights
Companies are implementing various strategies, such as strategic alliances, market forecast partnerships, mergers and acquisitions, geographical expansion, and product/service launches, to enhance their presence In the market.
The market research and growth report includes detailed analyses of the competitive landscape of the market and information about key companies, including:
- Abbott Laboratories
- BRG SUPLEMENTOS NUTRICIONAIS LTDA
- Glanbia plc
- Max Muscle Nutrition
- MAX TITANIUM
- MusclePharm
- NCS Suplementos
- PepsiCo Inc.
Qualitative and quantitative analysis of companies has been conducted to help clients understand the wider business environment as well as the strengths and weaknesses of key market players. Data is qualitatively analyzed to categorize companies as pure play, category-focused, industry-focused, and diversified; it is quantitatively analyzed to categorize companies as dominant, leading, strong, tentative, and weak.
Research Analyst Overview
The market has experienced significant growth in recent years, driven by the increasing awareness of health and wellness among the population. This trend is particularly noticeable among health-conscious consumers, who prioritize a diverse diet and convenient consumption methods to support their active lifestyles. Sports nutrition products, including nutrients, minerals, amino acids, protein powders, sports drinks, and RTD protein drinks, have gained popularity among individuals with various dietary preferences. The market caters to a targeted demographic, including elite athletes, those with serious fitness goals, and individuals seeking to improve their athletic performance. The sports nutrition industry in Brazil offers a wide range of products designed to meet the unique needs of consumers.
These products cater to various health concerns, such as diabetes, obesity, and chronic diseases, by providing quick energy, strength, and muscle mass enhancement. Sports vitamins, minerals, and supplements are essential components of many sports nutrition offerings, as they contribute to optimal hormonal balance and muscle tissue recovery. The convenience of sports nutrition products is a major aspect of their appeal. Consumers value the ability to consume these products quickly and easily, particularly during intense workouts or before and after physical activities. Energy gels, energy bars, and convenient supplements cater to this demand, providing athletes and fitness enthusiasts with the necessary nutrients to support their performance and recovery.
Sustainability practices and clean labels are becoming increasingly important to consumers In the sports nutrition market. Many consumers prefer natural alternatives to synthetic supplements and are concerned about the environmental impact of their choices. This trend is particularly noticeable among young consumers, who are more likely to prioritize health and wellness In their daily lives. The market is diverse and dynamic, with various segments, including protein supplements, sports beverages, and capsules. The powder segment dominates the market, offering consumers a wide range of products and flavors. Sports events and fitness clubs serve as significant sales channels for sports nutrition products, as they attract large crowds of health-conscious individuals seeking to improve their athletic performance.
Labeling is a major consideration for consumers In the sports nutrition market. They prioritize transparency and accuracy in product labeling, ensuring they are consuming high-quality, effective products. Microbiome boosters and other natural supplements have gained popularity in recent years, as consumers seek to support their overall health and wellbeing. In , the market is a dynamic and growing industry, driven by the increasing awareness of health and wellness among the population. Consumers prioritize convenience, sustainability, and natural alternatives when choosing sports nutrition products, and the market offers a wide range of offerings to meet these needs. The industry caters to a diverse demographic, including elite athletes, fitness enthusiasts, and individuals seeking to improve their overall health and athletic performance.
|
Market Scope |
|
|
Report Coverage |
Details |
|
Page number |
147 |
|
Base year |
2024 |
|
Historic period |
2019-2023 |
|
Forecast period |
2025-2029 |
|
Growth momentum & CAGR |
Accelerate at a CAGR of 8.2% |
|
Market growth 2025-2029 |
USD 374.1 million |
|
Market structure |
Concentrated |
|
YoY growth 2024-2025(%) |
7.4 |
|
Competitive landscape |
Leading Companies, Market Positioning of Companies, Competitive Strategies, and Industry Risks |
What are the Key Data Covered in this Market Research Report?
- CAGR of the market during the forecast period
- Detailed information on factors that will drive the market growth and forecasting between 2025 and 2029
- Precise estimation of the size of the market and its contribution of the market in focus to the parent market
- Accurate predictions about upcoming market growth and trends and changes in consumer behaviour
- Growth of the market across Brazil
- Thorough analysis of the market’s competitive landscape and detailed information about companies
- Comprehensive analysis of factors that will challenge the growth of market companies
We can help! Our analysts can customize this market research report to meet your requirements Get in touch