Buses Market Analysis APAC, Europe, North America, South America, Middle East and Africa - China, Germany, US, India, UK - Size and Forecast 2024-2028

Buses Market Analysis APAC, Europe, North America, South America, Middle East and Africa - China, Germany, US, India, UK - Size and Forecast 2024-2028

Published: Jul 2024 167 Pages SKU: IRTNTR75466

Market Overview at a Glance

$19.07 B
Market Opportunity
6.73%
CAGR
5.94
YoY growth 2023-2024(%)

Bus Market Size 2024-2028

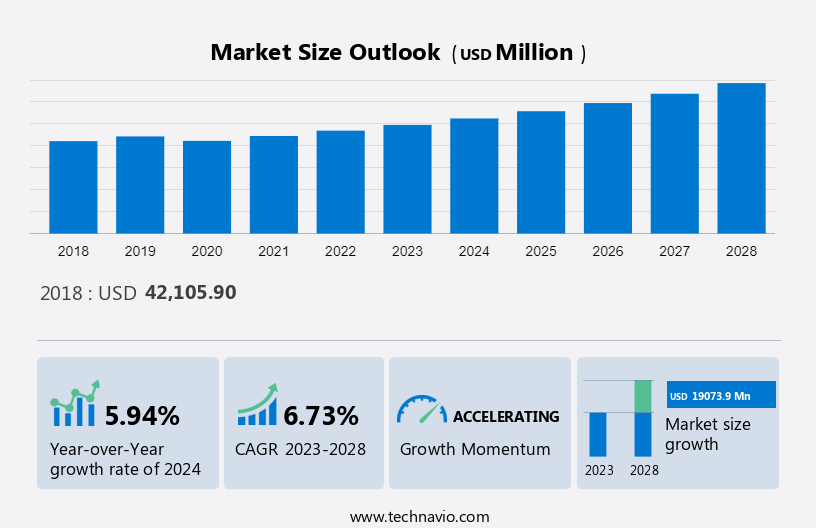
The bus market size is estimated to increase by USD 19.07 billion, growing at a CAGR of 6.73% between 2023 and 2028. Market expansion hinges on various factors such as accelerated urbanization, stringent government regulations, incentives, and effective congestion and traffic management strategies. As cities grow rapidly, there is an increased demand for solutions that streamline transportation and infrastructure development. Government policies and incentives play a pivotal role in shaping market dynamics, encouraging innovation and investment in urban planning and mobility solutions. Effective congestion and traffic management strategies are crucial to optimizing urban mobility, reducing environmental impact, and enhancing quality of life. These factors collectively drive market growth in sectors ranging from transportation infrastructure and smart city technologies to sustainable urban development initiatives. Emphasizing sustainable and efficient urban solutions remains essential in meeting the challenges posed by urbanization while fostering economic growth and environmental stewardship.

What will be the Size of the Bus Market During the Forecast Period?

Buses Market Size

To learn more about this report, View Report Sample

Market Dynamics

In the transportation sector, vehicle configuration and fuel category significantly influence operating costs and fuel expenditures for various vehicles, including diesel transit vehicles and luxury coaches used in the tourism sector. With fluctuations in fossil fuel prices, operators of transit buses and tour buses navigate economic challenges while balancing passenger revenue and optimizing routes across the road network. Digital innovations like online ticketing and machine learning (ML) enhance operational efficiencies and passenger experience, streamlining booking processes and optimizing schedules. Addressing environmental pollution, particularly from air travel and road-based transport such as intercity and intracity buses, remains a priority. Governments and industry leaders focus on sustainable practices and integrating digital technology to mitigate environmental impacts while meeting the demands of modern transportation systems and enhancing overall travel experiences.

Key Driver

Rapid urbanization is the key factor driving the growth of the global market. Rapid urbanization has become a key driver for the global market in several countries, including the US, China, and India. There is a growing need for effective and environmentally friendly public transport systems, especially these vehicles, as cities such as Mumbai and Bangalore expand and populations concentrate in urban areas. The requirement to meet the transit needs of an expanding metropolitan population is a major driver of the global bus market. The Chinese government has made significant investments in public transportation infrastructure to accommodate the increased demand for public transportation in metropolitan areas, notably BRT networks.

Moreover, in China, more than 40 BRT lines were operating by 2020, handling millions of passengers daily. According to the United Nations Department of Economic and Social Affairs, 68% of the world's population is expected to reside in urban areas by 2050. This indicates the increased future demand for buses across the world, which is expected to drive the growth of the market during the forecast period.

Significant Trends

Technological advancements in electric vehicles are the primary trend shaping the global bus market growth. Since the global market is growing moderately, many manufacturers are entering into electric vehicle manufacturing. In addition, the need for technological advancements is also high - a factor that is encouraging electric bus manufacturers to focus on advancements in collaboration with technology-based companies. In line with this, Volvo and Nanyang Technological University in Singapore have signed a cooperation agreement on an R&D program for autonomous electric buses as a drive to create new solutions for sustainable public transport. It is expected that this technology, which is being developed by Volvo, will contribute to the future autonomous applications of Volvo.

Another technological advancement has been made to address the difficulty in charging - Li-ion batteries that can be charged with the help of solar power. For instance, Kiira Motors, a Uganda-based company, has come up with the Kayoola bus concept, which can run on solar power. Hence, the adoption of electric buses and significant technological advancements are expected to drive the demand for electric buses, which, in turn, will drive the market growth and trends during the forecast period.

Major Challenge

Inadequate bus infrastructure is a major challenge impeding the growth of the global market. The global market has significant challenges due to poor infrastructure, particularly in urban regions that are experiencing increasing urbanization. The efficiency and dependability of these services are hampered by a lack of bus stops, terminals, and designated bus lanes, which results in operational inefficiencies, longer journey times, and lower passenger satisfaction. For instance, the lack of bus stops and terminals in many Indian cities is highlighted in a report by the Ministry of Housing and Urban Affairs.

However, only between 50,000-55,000 of more than 1,00,000 necessary bus stops are available, which causes congestion and aggravation for operators and passengers. These instances highlight the urgent issue of insufficient bus infrastructure, requiring significant expenditures and strategic planning to improve the effectiveness and dependability of services in urban areas around the world. Hence, the lack of adequate infrastructure is expected to hinder the operation of transportation, which, in turn, will hamper the growth of the market during the forecast period.

Key Market Customer Landscape

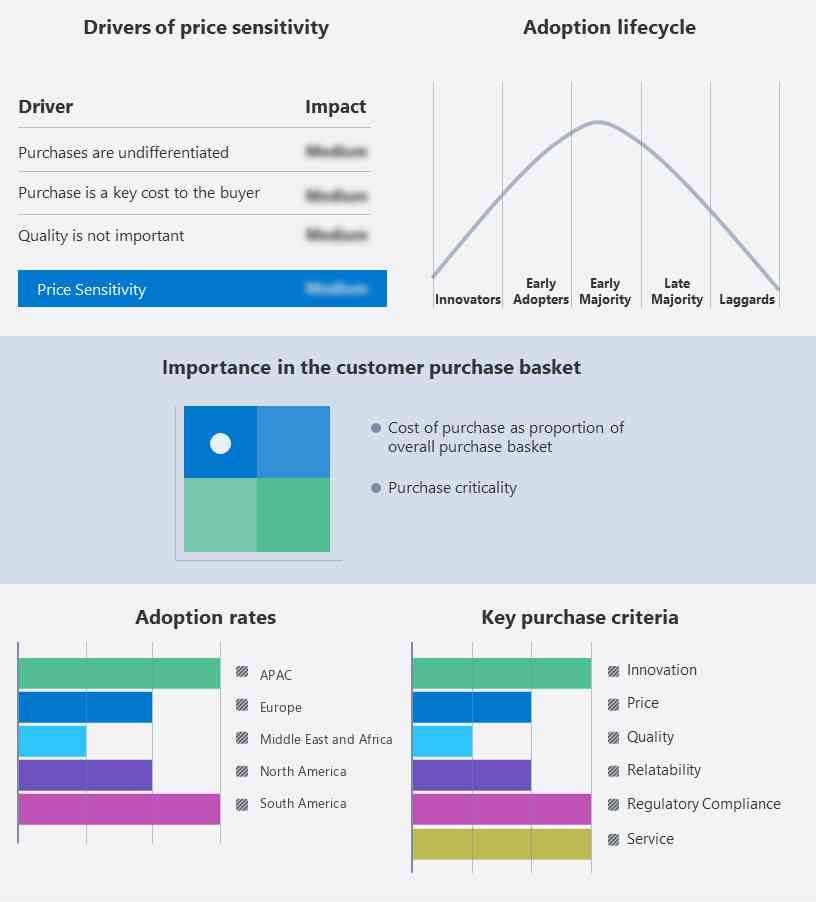
The market report includes the adoption lifecycle of the market, covering from the innovator's stage to the laggard's stage. It focuses on adoption rates in different regions based on penetration. Furthermore, the report also includes key purchase criteria and drivers of price sensitivity to help companies evaluate and develop their growth strategies.

Bus Market Share by Geography

Global Market Customer Landscape

What is the Fastest-Growing Segment in the Market?

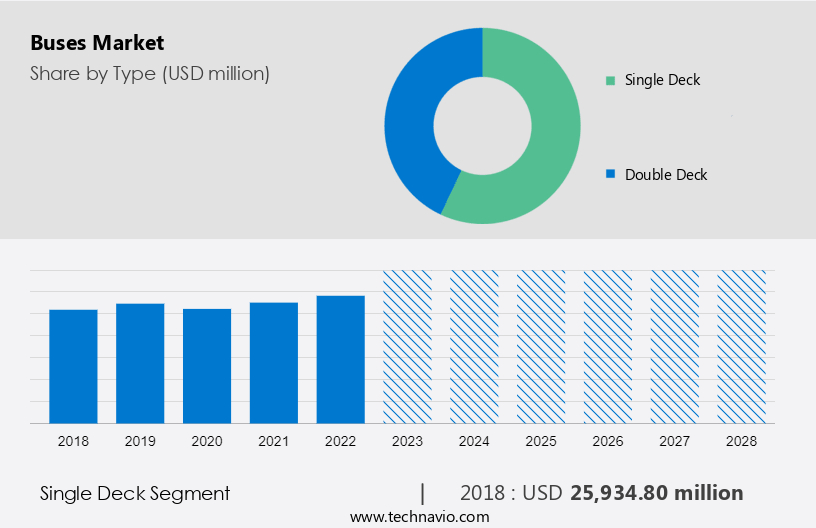
The market share growth by the single deck segment will be significant during the forecast period. The rising demand for public transport, government programs to ease traffic congestion, and the growing interest in environment-friendly mobility options contribute to the need for single-deck buses. 

Buses Market Size

Get a glance at the market contribution of various segments View the PDF Sample

The single deck segment was valued at USD 25.93 billion in 2018. The single-deck bus segment of the global market has experienced consistent expansion. Due to their small size and maneuverability, these buses, which normally have one level of seating, are ideal for urban and suburban transportation. They are frequently employed for employee transportation, school buses, and public transportation. For instance, two well-known single-deck buses utilized in numerous cities throughout the world are the Alexander Dennis Enviro200 and the Volvo 7900 Electric. Single-deck bus sales are in high demand due to factors such as increased urbanization, the need for effective public transit, and growing environmental concerns. Such factors will increase segment growth during the forecast period.

Which are the Key Regions for the Market?

Buses Market Share by Geography

For more insights on the market share of various regions Download PDF Sample now!

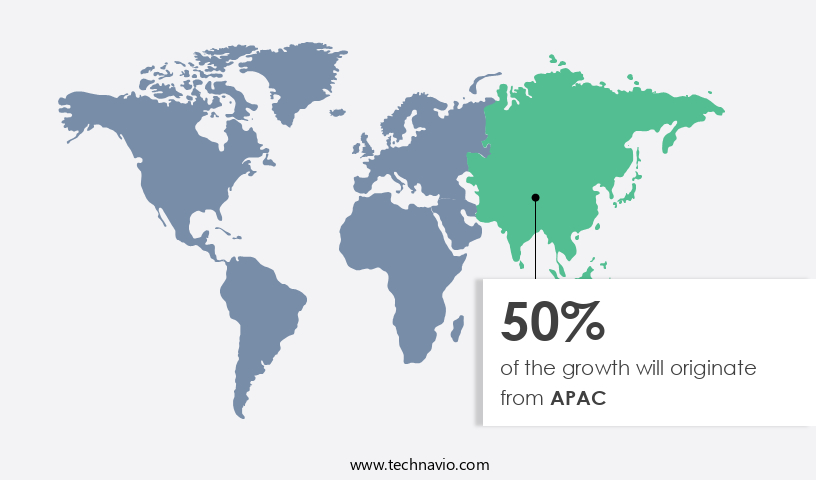
APAC is estimated to contribute 50% to the growth of the global market during the forecast period. Technavio's analysts have elaborately explained the regional trends and drivers that shape the market during the forecast period. High awareness about the benefits of public transport among consumers is leading to the rapid transformation of buses from traditional diesel to electric buses. This is a crucial driver for the market in China. Every city that has a transit system operates buses, and bus services are easy to introduce and modify.

With the rising focus on reducing traffic congestion and vehicle emissions, authorities in China are pushing the adoption of public transportation over private transportation (which constitutes higher adoption among all modes). There has been a growing adoption of electric school buses in China to reduce carbon footprints; therefore, players have been launching electric school buses with new features. 

Who are the Major Market Companies?

Companies are implementing various strategies, such as strategic alliances, partnerships, mergers and acquisitions, geographical expansion, and product/service launches, to enhance their presence in the market.

AB Volvo: The company offers premium buses, coaches and bus chassis under two brands, namely, Prevost and Novabus.

The research report also includes detailed analyses of the competitive landscape of the market and information about 15 market players, including:

  • Anhui Jianghuai Automobile Group Co. Ltd.
  • Ashok Leyland Ltd
  • BYD Co. Ltd.
  • FirstGroup plc
  • Go Ahead Group Plc
  • Mahindra and Mahindra Ltd.
  • Mercedes Benz Group AG
  • MTR Corp. Ltd.
  • National Express Group Plc
  • NFI Group Inc.
  • Proterra Inc.
  • RegioJet A.S.
  • SNCF Group
  • Stagecoach Group Plc
  • Tata Motors Ltd.

Qualitative and quantitative analysis of vendors has been conducted to help clients understand the wider business environment as well as the strengths and weaknesses of key market players. Data is qualitatively analyzed to categorize vendors as pure play, category-focused, industry-focused, and diversified; it is quantitatively analyzed to categorize vendors as dominant, leading, strong, tentative, and weak.

Segment Overview

The market research report provides comprehensive data (region wise segment analysis), with forecasts and estimates in "USD Billion" for the period 2024 to 2028, as well as historical data from 2018 to 2022 for the following segments. 

  • Type Outlook
    • Single deck
    • Double deck
  • Fuel Type Outlook
    • Diesel
    • Electric and hybrid
    • Others
  • Region Outlook
    • North America
      • The U.S.
      • Canada
    • Europe
      • U.K.
      • Germany
      • France
      • Rest of Europe
    • APAC
      • China
      • India
    • South America
      • Chile
      • Argentina
      • Brazil
    • Middle East & Africa
      • Saudi Arabia
      • South Africa
      • Rest of the Middle East & Africa

You may also interested in below market reports:

School Bus Market: School Bus Market Analysis North America, APAC, Europe, Middle East and Africa, South America - US, China, Canada, Japan, UK - Size and Forecast 

Electric Bus Market: Electric Bus Market Analysis APAC, Europe, North America, Middle East and Africa, South America - US, China, India, UK, Germany - Size and Forecast 

Autonomous Bus Market:  Autonomous Bus Market Analysis North America, APAC, Europe, Middle East and Africa, South America - US, China, Japan, Germany, UK - Size and Forecast 

Market Analyst Overview

The automotive sector is experiencing a transformative shift towards electric vehicles (EVs), driven by initiatives to improve energy efficiency and reduce greenhouse gas emissions and pollution emissions. Global EV sales are on the rise, particularly in the segment of electric passenger cars and vehicles used in public transport sectors, such as single decker buses and double decker buses. This shift is supported by advancements in battery technology and vehicle electrification, essential for achieving carbon neutrality goals in transportation. While operating cost and maintenance costs for diesel transit vehicle have historically been significant, the adoption of electric mobility strategies promises lower fuel costs and reduced environmental impact. Emerging technologies like Artificial Intelligence (AI) are enhancing smart transportation solutions, optimizing routes, and improving overall efficiency across diverse vehicle types, including SUVs and intercity/coaches.

Market Scope

Report Coverage

Details

Page number

167

Base year

2023

Historic period

2018 - 2022

Forecast period

2024-2028

Growth momentum & CAGR

Accelerate at a CAGR of 6.73%

Market growth 2024-2028

USD 19.07 Billion

Market structure

USD Fragmented

YoY growth 2023-2024(%)

5.94

Regional analysis

APAC, Europe, North America, South America, and Middle East and Africa

Performing market contribution

APAC at 50%

Key countries

China, Germany, US, India, and UK

Competitive landscape

Leading Companies, Market Positioning of Companies, Competitive Strategies, and Industry Risks

Key companies profiled

AB Volvo, Anhui Jianghuai Automobile Group Co. Ltd., Ashok Leyland Ltd., BYD Co. Ltd., FirstGroup plc, Go Ahead Group Plc, Mahindra and Mahindra Ltd., Mercedes Benz Group AG, Mobico Group, MTR Corp. Ltd., NFI Group Inc., Proterra Inc., RegioJet A.S., SNCF Group., Stagecoach Group Plc, Tata Motors Ltd., Transdev Group SA, Xiamen King Long United Automotive Industry Co. Ltd., Zhengzhou Yutong Group Co. Ltd., and Zhongtong Bus Holding Co. Ltd.

Market dynamics

Parent market analysis, Market forecasting growth inducers and obstacles, Fast-growing and slow-growing segment analysis, Market growth and Forecasting, COVID-19 impact and recovery analysis and future consumer dynamics, Market condition analysis for the forecast period

Customization purview

If our market report has not included the data that you are looking for, you can reach out to our analysts and get segments customized.

View PDF Sample

What are the Key Data Covered in this Market Forecast Report?

  • CAGR of the market during the forecast period
  • Detailed information on factors that will drive the market growth and forecasting of the market between 2024 and 2028
  • Precise estimation of the market size and its contribution to the parent market
  • Accurate predictions about upcoming market trends and analysis and changes in consumer behavior
  • Growth of the market across Europe, North America, APAC, South America, and Middle East and Africa
  • Thorough market growth analysis of the market's competitive landscape and detailed information about companies
  • Comprehensive market analysis and report on the factors that will challenge the market research and growth of market companies

We can help! Our analysts can customize this market research report to meet your requirements. 

Get in touch

1 Executive Summary

  • 1.1 Market overview
    • Executive Summary - Chart on Market Overview
    • Executive Summary - Data Table on Market Overview
    • Executive Summary - Chart on Global Market Characteristics
    • Executive Summary - Chart on Market by Geography
    • Executive Summary - Chart on Market Segmentation by Type
    • Executive Summary - Chart on Market Segmentation by Fuel Type
    • Executive Summary - Chart on Incremental Growth
    • Executive Summary - Data Table on Incremental Growth
    • Executive Summary - Chart on Company Market Positioning

2 Market Landscape

  • 2.1 Market ecosystem
    • Parent Market
    • Data Table on - Parent Market
  • 2.2 Market characteristics
    • Market characteristics analysis
  • 2.3 Value chain analysis
    • Value Chain Analysis

3 Market Sizing

  • 3.1 Market definition
    • Offerings of companies included in the market definition
  • 3.2 Market segment analysis
    • Market segments
  • 3.3 Market size 2023
    • 3.4 Market outlook: Forecast for 2023-2028
      • Chart on Global - Market size and forecast 2023-2028 ($ million)
      • Data Table on Global - Market size and forecast 2023-2028 ($ million)
      • Chart on Global Market: Year-over-year growth 2023-2028 (%)
      • Data Table on Global Market: Year-over-year growth 2023-2028 (%)

    4 Historic Market Size

    • 4.1 Global Buses Market 2018 - 2022
      • Historic Market Size - Data Table on Global Buses Market 2018 - 2022 ($ million)
    • 4.2 Type segment analysis 2018 - 2022
      • Historic Market Size - Type Segment 2018 - 2022 ($ million)
    • 4.3 Fuel Type segment analysis 2018 - 2022
      • Historic Market Size - Fuel Type Segment 2018 - 2022 ($ million)
    • 4.4 Geography segment analysis 2018 - 2022
      • Historic Market Size - Geography Segment 2018 - 2022 ($ million)
    • 4.5 Country segment analysis 2018 - 2022
      • Historic Market Size - Country Segment 2018 - 2022 ($ million)

    5 Five Forces Analysis

    • 5.1 Five forces summary
      • Five forces analysis - Comparison between 2023 and 2028
    • 5.2 Bargaining power of buyers
      • Bargaining power of buyers - Impact of key factors 2023 and 2028
    • 5.3 Bargaining power of suppliers
      • Bargaining power of suppliers - Impact of key factors in 2023 and 2028
    • 5.4 Threat of new entrants
      • Threat of new entrants - Impact of key factors in 2023 and 2028
    • 5.5 Threat of substitutes
      • Threat of substitutes - Impact of key factors in 2023 and 2028
    • 5.6 Threat of rivalry
      • Threat of rivalry - Impact of key factors in 2023 and 2028
    • 5.7 Market condition
      • Chart on Market condition - Five forces 2023 and 2028

    6 Market Segmentation by Type

    • 6.1 Market segments
      • Chart on Type - Market share 2023-2028 (%)
      • Data Table on Type - Market share 2023-2028 (%)
    • 6.2 Comparison by Type
      • Chart on Comparison by Type
      • Data Table on Comparison by Type
    • 6.3 Single deck - Market size and forecast 2023-2028
      • Chart on Single deck - Market size and forecast 2023-2028 ($ million)
      • Data Table on Single deck - Market size and forecast 2023-2028 ($ million)
      • Chart on Single deck - Year-over-year growth 2023-2028 (%)
      • Data Table on Single deck - Year-over-year growth 2023-2028 (%)
    • 6.4 Double deck - Market size and forecast 2023-2028
      • Chart on Double deck - Market size and forecast 2023-2028 ($ million)
      • Data Table on Double deck - Market size and forecast 2023-2028 ($ million)
      • Chart on Double deck - Year-over-year growth 2023-2028 (%)
      • Data Table on Double deck - Year-over-year growth 2023-2028 (%)
    • 6.5 Market opportunity by Type
      • Market opportunity by Type ($ million)
      • Data Table on Market opportunity by Type ($ million)

    7 Market Segmentation by Fuel Type

    • 7.1 Market segments
      • Chart on Fuel Type - Market share 2023-2028 (%)
      • Data Table on Fuel Type - Market share 2023-2028 (%)
    • 7.2 Comparison by Fuel Type
      • Chart on Comparison by Fuel Type
      • Data Table on Comparison by Fuel Type
    • 7.3 Diesel - Market size and forecast 2023-2028
      • Chart on Diesel - Market size and forecast 2023-2028 ($ million)
      • Data Table on Diesel - Market size and forecast 2023-2028 ($ million)
      • Chart on Diesel - Year-over-year growth 2023-2028 (%)
      • Data Table on Diesel - Year-over-year growth 2023-2028 (%)
    • 7.4 Electric and hybrid - Market size and forecast 2023-2028
      • Chart on Electric and hybrid - Market size and forecast 2023-2028 ($ million)
      • Data Table on Electric and hybrid - Market size and forecast 2023-2028 ($ million)
      • Chart on Electric and hybrid - Year-over-year growth 2023-2028 (%)
      • Data Table on Electric and hybrid - Year-over-year growth 2023-2028 (%)
    • 7.5 Others - Market size and forecast 2023-2028
      • Chart on Others - Market size and forecast 2023-2028 ($ million)
      • Data Table on Others - Market size and forecast 2023-2028 ($ million)
      • Chart on Others - Year-over-year growth 2023-2028 (%)
      • Data Table on Others - Year-over-year growth 2023-2028 (%)
    • 7.6 Market opportunity by Fuel Type
      • Market opportunity by Fuel Type ($ million)
      • Data Table on Market opportunity by Fuel Type ($ million)

    8 Customer Landscape

    • 8.1 Customer landscape overview
      • Analysis of price sensitivity, lifecycle, customer purchase basket, adoption rates, and purchase criteria

    9 Geographic Landscape

    • 9.1 Geographic segmentation
      • Chart on Market share by geography 2023-2028 (%)
      • Data Table on Market share by geography 2023-2028 (%)
    • 9.2 Geographic comparison
      • Chart on Geographic comparison
      • Data Table on Geographic comparison
    • 9.3 APAC - Market size and forecast 2023-2028
      • Chart on APAC - Market size and forecast 2023-2028 ($ million)
      • Data Table on APAC - Market size and forecast 2023-2028 ($ million)
      • Chart on APAC - Year-over-year growth 2023-2028 (%)
      • Data Table on APAC - Year-over-year growth 2023-2028 (%)
    • 9.4 Europe - Market size and forecast 2023-2028
      • Chart on Europe - Market size and forecast 2023-2028 ($ million)
      • Data Table on Europe - Market size and forecast 2023-2028 ($ million)
      • Chart on Europe - Year-over-year growth 2023-2028 (%)
      • Data Table on Europe - Year-over-year growth 2023-2028 (%)
    • 9.5 North America - Market size and forecast 2023-2028
      • Chart on North America - Market size and forecast 2023-2028 ($ million)
      • Data Table on North America - Market size and forecast 2023-2028 ($ million)
      • Chart on North America - Year-over-year growth 2023-2028 (%)
      • Data Table on North America - Year-over-year growth 2023-2028 (%)
    • 9.6 South America - Market size and forecast 2023-2028
      • Chart on South America - Market size and forecast 2023-2028 ($ million)
      • Data Table on South America - Market size and forecast 2023-2028 ($ million)
      • Chart on South America - Year-over-year growth 2023-2028 (%)
      • Data Table on South America - Year-over-year growth 2023-2028 (%)
    • 9.7 Middle East and Africa - Market size and forecast 2023-2028
      • Chart on Middle East and Africa - Market size and forecast 2023-2028 ($ million)
      • Data Table on Middle East and Africa - Market size and forecast 2023-2028 ($ million)
      • Chart on Middle East and Africa - Year-over-year growth 2023-2028 (%)
      • Data Table on Middle East and Africa - Year-over-year growth 2023-2028 (%)
    • 9.8 China - Market size and forecast 2023-2028
      • Chart on China - Market size and forecast 2023-2028 ($ million)
      • Data Table on China - Market size and forecast 2023-2028 ($ million)
      • Chart on China - Year-over-year growth 2023-2028 (%)
      • Data Table on China - Year-over-year growth 2023-2028 (%)
    • 9.9 Germany - Market size and forecast 2023-2028
      • Chart on Germany - Market size and forecast 2023-2028 ($ million)
      • Data Table on Germany - Market size and forecast 2023-2028 ($ million)
      • Chart on Germany - Year-over-year growth 2023-2028 (%)
      • Data Table on Germany - Year-over-year growth 2023-2028 (%)
    • 9.10 US - Market size and forecast 2023-2028
      • Chart on US - Market size and forecast 2023-2028 ($ million)
      • Data Table on US - Market size and forecast 2023-2028 ($ million)
      • Chart on US - Year-over-year growth 2023-2028 (%)
      • Data Table on US - Year-over-year growth 2023-2028 (%)
    • 9.11 India - Market size and forecast 2023-2028
      • Chart on India - Market size and forecast 2023-2028 ($ million)
      • Data Table on India - Market size and forecast 2023-2028 ($ million)
      • Chart on India - Year-over-year growth 2023-2028 (%)
      • Data Table on India - Year-over-year growth 2023-2028 (%)
    • 9.12 UK - Market size and forecast 2023-2028
      • Chart on UK - Market size and forecast 2023-2028 ($ million)
      • Data Table on UK - Market size and forecast 2023-2028 ($ million)
      • Chart on UK - Year-over-year growth 2023-2028 (%)
      • Data Table on UK - Year-over-year growth 2023-2028 (%)
    • 9.13 Market opportunity by geography
      • Market opportunity by geography ($ million)
      • Data Tables on Market opportunity by geography ($ million)

    10 Drivers, Challenges, and Opportunity/Restraints

    • 10.1 Market drivers
      • 10.2 Market challenges
        • 10.3 Impact of drivers and challenges
          • Impact of drivers and challenges in 2023 and 2028
        • 10.4 Market opportunities/restraints

          11 Competitive Landscape

          • 11.1 Overview
            • 11.2 Competitive Landscape
              • Overview on criticality of inputs and factors of differentiation
            • 11.3 Landscape disruption
              • Overview on factors of disruption
            • 11.4 Industry risks
              • Impact of key risks on business

            12 Competitive Analysis

            • 12.1 Companies profiled
              • Companies covered
            • 12.2 Market positioning of companies
              • Matrix on companies position and classification
            • 12.3 AB Volvo
              • AB Volvo - Overview
              • AB Volvo - Business segments
              • AB Volvo - Key news
              • AB Volvo - Key offerings
              • AB Volvo - Segment focus
            • 12.4 Anhui Jianghuai Automobile Group Co. Ltd.
              • Anhui Jianghuai Automobile Group Co. Ltd. - Overview
              • Anhui Jianghuai Automobile Group Co. Ltd. - Product / Service
              • Anhui Jianghuai Automobile Group Co. Ltd. - Key news
              • Anhui Jianghuai Automobile Group Co. Ltd. - Key offerings
            • 12.5 BYD Co. Ltd.
              • BYD Co. Ltd. - Overview
              • BYD Co. Ltd. - Business segments
              • BYD Co. Ltd. - Key news
              • BYD Co. Ltd. - Key offerings
              • BYD Co. Ltd. - Segment focus
            • 12.6 FirstGroup plc
              • FirstGroup plc - Overview
              • FirstGroup plc - Product / Service
              • FirstGroup plc - Key offerings
            • 12.7 Go Ahead Group Plc
              • Go Ahead Group Plc - Overview
              • Go Ahead Group Plc - Business segments
              • Go Ahead Group Plc - Key offerings
              • Go Ahead Group Plc - Segment focus
            • 12.8 Mahindra and Mahindra Ltd.
              • Mahindra and Mahindra Ltd. - Overview
              • Mahindra and Mahindra Ltd. - Business segments
              • Mahindra and Mahindra Ltd. - Key news
              • Mahindra and Mahindra Ltd. - Key offerings
              • Mahindra and Mahindra Ltd. - Segment focus
            • 12.9 Mercedes Benz Group AG
              • Mercedes Benz Group AG - Overview
              • Mercedes Benz Group AG - Business segments
              • Mercedes Benz Group AG - Key news
              • Mercedes Benz Group AG - Key offerings
              • Mercedes Benz Group AG - Segment focus
            • 12.10 Mobico Group
              • Mobico Group - Overview
              • Mobico Group - Business segments
              • Mobico Group - Key news
              • Mobico Group - Key offerings
              • Mobico Group - Segment focus
            • 12.11 MTR Corp. Ltd.
              • MTR Corp. Ltd. - Overview
              • MTR Corp. Ltd. - Product / Service
              • MTR Corp. Ltd. - Key news
              • MTR Corp. Ltd. - Key offerings
            • 12.12 NFI Group Inc.
              • NFI Group Inc. - Overview
              • NFI Group Inc. - Business segments
              • NFI Group Inc. - Key news
              • NFI Group Inc. - Key offerings
              • NFI Group Inc. - Segment focus
            • 12.13 RegioJet A.S.
              • RegioJet A.S. - Overview
              • RegioJet A.S. - Product / Service
              • RegioJet A.S. - Key offerings
            • 12.14 SNCF Group.
              • SNCF Group. - Overview
              • SNCF Group. - Business segments
              • SNCF Group. - Key offerings
              • SNCF Group. - Segment focus
            • 12.15 Stagecoach Group Plc
              • Stagecoach Group Plc - Overview
              • Stagecoach Group Plc - Business segments
              • Stagecoach Group Plc - Key offerings
              • Stagecoach Group Plc - Segment focus
            • 12.16 Transdev Group SA
              • Transdev Group SA - Overview
              • Transdev Group SA - Product / Service
              • Transdev Group SA - Key offerings
            • 12.17 Xiamen King Long United Automotive Industry Co. Ltd.
              • Xiamen King Long United Automotive Industry Co. Ltd. - Overview
              • Xiamen King Long United Automotive Industry Co. Ltd. - Product / Service
              • Xiamen King Long United Automotive Industry Co. Ltd. - Key offerings

            13 Appendix

            • 13.1 Scope of the report
              • 13.2 Inclusions and exclusions checklist
                • Inclusions checklist
                • Exclusions checklist
              • 13.3 Currency conversion rates for US$
                • Currency conversion rates for US$
              • 13.4 Research methodology
                • Research methodology
              • 13.5 Data procurement
                • Information sources
              • 13.6 Data validation
                • Data validation
              • 13.7 Validation techniques employed for market sizing
                • Validation techniques employed for market sizing
              • 13.8 Data synthesis
                • Data synthesis
              • 13.9 360 degree market analysis
                • 360 degree market analysis
              • 13.10 List of abbreviations
                • List of abbreviations

              Research Methodology

              Technavio presents a detailed picture of the market by way of study, synthesis, and summation of data from multiple sources. The analysts have presented the various facets of the market with a particular focus on identifying the key industry influencers. The data thus presented is comprehensive, reliable, and the result of extensive research, both primary and secondary.

              INFORMATION SOURCES

              Primary sources

              • Manufacturers and suppliers
              • Channel partners
              • Industry experts
              • Strategic decision makers

              Secondary sources

              • Industry journals and periodicals
              • Government data
              • Financial reports of key industry players
              • Historical data
              • Press releases

              DATA ANALYSIS

              Data Synthesis

              • Collation of data
              • Estimation of key figures
              • Analysis of derived insights

              Data Validation

              • Triangulation with data models
              • Reference against proprietary databases
              • Corroboration with industry experts

              REPORT WRITING

              Qualitative

              • Market drivers
              • Market challenges
              • Market trends
              • Five forces analysis

              Quantitative

              • Market size and forecast
              • Market segmentation
              • Geographical insights
              • Competitive landscape

              Interested in this report?

              Get your sample now to see our research methodology and insights!

              Download Now

              Frequently Asked Questions

              Buses market growth will increase by $ 19073.9 mn during 2024-2028.

              The Buses market is expected to grow at a CAGR of 6.73% during 2024-2028.

              Buses market is segmented by Type( Single deck, Double deck) Fuel Type( Diesel, Electric and hybrid, Others)

              AB Volvo, Anhui Jianghuai Automobile Group Co. Ltd., Ashok Leyland Ltd., BYD Co. Ltd., FirstGroup plc, Go Ahead Group Plc, Mahindra and Mahindra Ltd., Mercedes Benz Group AG, Mobico Group, MTR Corp. Ltd., NFI Group Inc., Proterra Inc., RegioJet A.S., SNCF Group., Stagecoach Group Plc, Tata Motors Ltd., Transdev Group SA, Xiamen King Long United Automotive Industry Co. Ltd., Zhengzhou Yutong Group Co. Ltd., Zhongtong Bus Holding Co. Ltd. are a few of the key vendors in the Buses market.

              APAC will register the highest growth rate of 50% among the other regions. Therefore, the Buses market in APAC is expected to garner significant business opportunities for the vendors during the forecast period.

              China, Germany, US, India, UK

              • Rapid urbanizationRapid urbanization has become a key driver for the global buses market in several countries is the driving factor this market.
              • including the US is the driving factor this market.
              • China is the driving factor this market.
              • and India. There is a growing need for effective and environment-friendly public transport systems is the driving factor this market.
              • especially buses is the driving factor this market.
              • as cities such as Mumbai and Bangalore expand is the driving factor this market.
              • and populations concentrate in urban areas. The requirement to meet the transit needs of an expanding metropolitan population is a major driver of the global buses market.The Chinese government has made significant investments in public transportation infrastructure to accommodate the increased demand for public transportation in metropolitan areas is the driving factor this market.
              • notably BRT networks. In China is the driving factor this market.
              • more than 40 BRT lines were operating by 2020 is the driving factor this market.
              • handling millions of passengers daily. According to the United Nations Department of Economic and Social Affairs is the driving factor this market.
              • 68% of the world's population is expected to reside in urban areas by 2050. This indicates the increased future demand for buses across the world is the driving factor this market.
              • which is expected to drive the growth of the market during the forecast period. is the driving factor this market.

              The Buses market vendors should focus on grabbing business opportunities from the Single deck segment as it accounted for the largest market share in the base year.