Cable Assembly Market Size 2025-2029
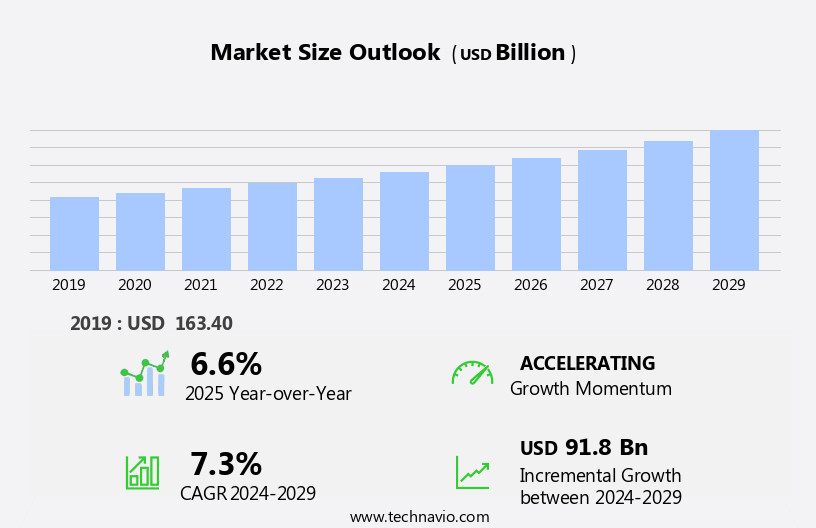
The cable assembly market size is forecast to increase by USD 91.8 billion, at a CAGR of 7.3% between 2024 and 2029.
- The market is experiencing significant growth, driven by the increasing demand for electric vehicles and the expansion of data centers. The shift towards sustainable transportation solutions and the rising adoption of electric vehicles are fueling the market's expansion. Simultaneously, the data center industry's continuous expansion, necessitating advanced connectivity solutions, is creating lucrative opportunities for cable assembly manufacturers. However, the market faces challenges as well. The availability of counterfeit and grey-market products poses a significant threat to market players, requiring stringent quality control measures and regulatory compliance.
- Companies must navigate this issue to maintain their market position and ensure customer trust. Additionally, staying updated with the latest technological advancements and customer requirements is essential to remain competitive in this dynamic market. Companies seeking to capitalize on market opportunities and navigate challenges effectively should focus on innovation, quality, and regulatory compliance.
What will be the Size of the Cable Assembly Market during the forecast period?
Explore in-depth regional segment analysis with market size data - historical 2019-2023 and forecasts 2025-2029 - in the full report.
Request Free Sample
The market continues to evolve, driven by advancements in technology and the expanding requirements of various sectors. Low-voltage applications, such as telecommunications and data centers, demand high-performance cable assemblies for high-speed data transmission. Coaxial cable and fiber optic cable are popular choices for these applications due to their ability to support large bandwidths and maintain signal integrity. In the military sector, cable assemblies must meet stringent requirements for durability, reliability, and security. Military applications often utilize shielded cables with RFI and EMI shielding for protection against electromagnetic interference. Conductor materials and dielectric materials are carefully selected for their ability to withstand harsh environments and ensure reliable signal transmission.
The aerospace industry also relies on cable assemblies for critical applications, such as harness design and backplane assemblies. These assemblies must meet rigorous standards for safety, reliability, and performance. Material selection, impedance matching, and reach compliance are crucial factors in designing cable assemblies for aerospace applications. In the automotive sector, cable assemblies are essential for power and signal transmission in electric and hybrid vehicles. Unshielded cables, multi-conductor cables, and ribbon cables are commonly used for automotive applications. Quality control and cable management are critical considerations to ensure the reliability and safety of these assemblies. The ongoing evolution of cable assembly technology is driven by the need for improved performance, reliability, and cost-effectiveness.
Continuous innovation in cable design, material selection, and manufacturing processes is essential to meet the evolving demands of various sectors. The market will continue to be a dynamic and innovative space, with new applications and technologies emerging regularly.
How is this Cable Assembly Industry segmented?
The cable assembly industry research report provides comprehensive data (region-wise segment analysis), with forecasts and estimates in "USD billion" for the period 2025-2029, as well as historical data from 2019-2023 for the following segments.
- Product
- Application-specific
- Rectangular
- RF
- Circular
- Others
- Application
- Automotive
- Telecom and datacom
- Consumer electronics
- Industrial
- Others
- Variant
- High-speed cable assembly
- Data cable assembly
- Conventional cable assembly
- Type
- Coaxial cable
- Custom cable
- Discrete wire
- Flat ribbon cable
- Others
- Geography
- North America
- US
- Canada
- Europe
- France
- Germany
- UK
- APAC
- Australia
- China
- India
- Japan
- South Korea
- Rest of World (ROW)
- North America
By Product Insights
The application-specific segment is estimated to witness significant growth during the forecast period.
The market experiences continuous growth due to the increasing demand for application-specific cable assemblies. These custom-made assemblies cater to specific industries, including automotive, medical, telecommunications, military, and others. The revenue generated from this segment has been the highest contributor to the market in recent years. The benefits of application-specific cable assemblies include accuracy and flexibility. The manufacturing process adheres to precise design specifications, ensuring a perfect fit for the assembly application. Additionally, the length of each cable can be customized according to project requirements. In the realm of high-speed data transmission, aerospace applications, and telecommunications, unshielded and shielded cables, such as twisted pair and coaxial, are extensively used.
Material selection, including dielectric materials and conductors, plays a crucial role in ensuring signal integrity and impedance matching. RFI and EMI shielding, UL certification, and ROHS compliance are essential considerations for cable assemblies in various industries. Cable routing, reach compliance, and cable management are also vital aspects of cable assembly design. In the automotive sector, multi-conductor cables and ribbon cables are widely adopted for their flexibility and cost-effectiveness. Medical applications require cable assemblies with high-voltage capabilities and strict quality control measures. Ultimately, the market's evolution is driven by the need for customized solutions that cater to the unique demands of various industries and applications.
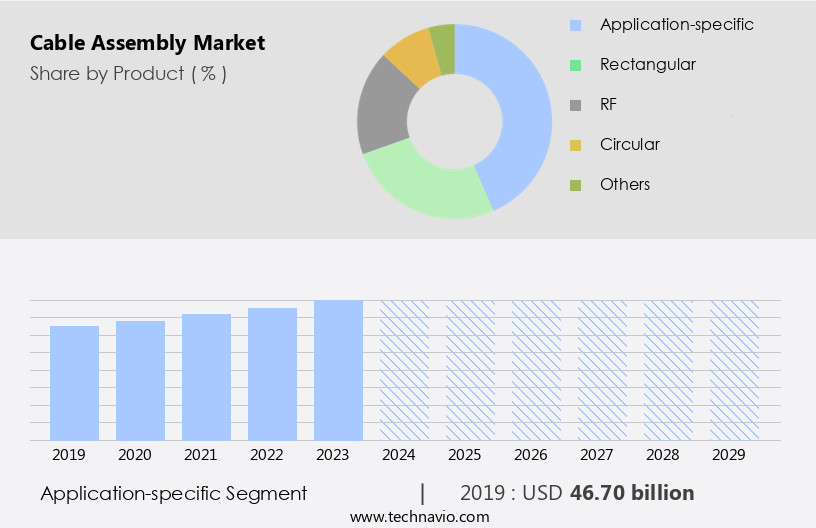
The Application-specific segment was valued at USD 46.70 billion in 2019 and showed a gradual increase during the forecast period.
Regional Analysis
APAC is estimated to contribute 59% to the growth of the global market during the forecast period.Technavio’s analysts have elaborately explained the regional trends and drivers that shape the market during the forecast period.
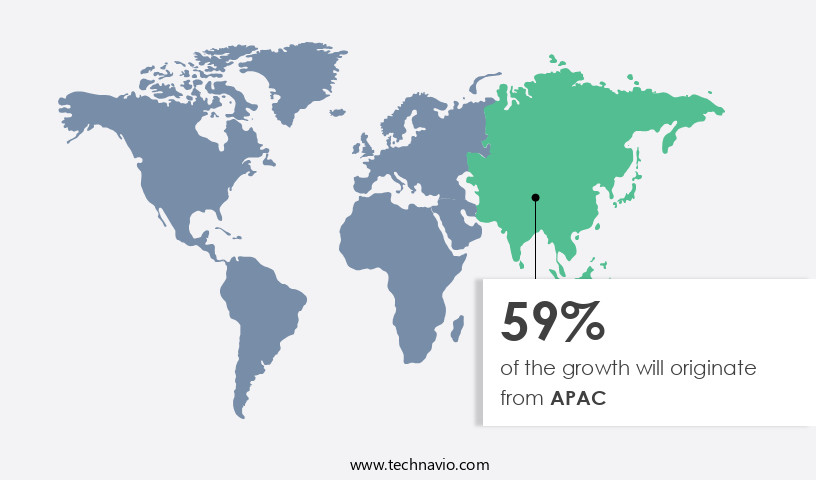
The market in APAC is experiencing significant growth, driven by increasing demand from industries such as automotive, consumer electronics, telecom, and manufacturing. OEMs in these sectors are the primary buyers of cable assemblies, with major players located in China, India, Japan, and South Korea. In the automotive sector, key manufacturers like Hero MotoCorp Ltd. (Hero), Hyundai Motor Company Ltd. (Hyundai), and Suzuki motor corp. Are leading the charge. Harness design and component sourcing are crucial factors in cable assembly production. Material selection, including dielectric materials and conductors, plays a significant role in ensuring signal integrity, impedance matching, and reach compliance.
Custom cable assemblies cater to specific application requirements, such as high-speed data transmission, RFI shielding, and EMI shielding, in industries like telecommunications and aerospace. Unshielded and shielded cables, flat cables, multi-conductor cables, and coaxial cables are used extensively in various applications. High-voltage applications, military applications, medical applications, and data centers also contribute to the market's growth. Cable routing, cable management, and UL certification are essential considerations for ensuring cable assembly functionality and safety. RoHS compliance and near-end crosstalk are essential factors in designing and manufacturing cable assemblies. Impedance matching, return loss, and signal integrity are crucial for high-speed data transmission applications.
Standards compliance, such as reaching compliance with various industry standards, is also a critical aspect of the market. In summary, the market in APAC is thriving due to the increasing demand from various industries and the need for advanced cable assembly solutions. OEMs in automotive, consumer electronics, telecom, and manufacturing sectors are major buyers, driving the growth of the market. The focus on signal integrity, impedance matching, and reach compliance, along with the use of various cable types and materials, ensures the market's continuous evolution.
Market Dynamics
Our researchers analyzed the data with 2024 as the base year, along with the key drivers, trends, and challenges. A holistic analysis of drivers will help companies refine their marketing strategies to gain a competitive advantage.
The market encompasses the design, production, and distribution of complex wiring systems used to connect and transmit data between various components in industries such as telecommunications, automotive, industrial automation, and consumer electronics. These assemblies incorporate advanced technologies like fiber optics, coaxial cables, and high-speed copper cables, ensuring reliable and efficient communication. Manufacturers focus on miniaturization, flexibility, and durability to meet evolving market demands. Design considerations include signal integrity, power management, and environmental factors like temperature and humidity. The market is driven by trends like the Internet of Things, Industry 4.0, and increasing demand for renewable energy solutions. Applications range from data centers and telecom networks to electric vehicles and medical equipment. Cable assemblies play a crucial role in enabling seamless connectivity and data transfer in today's interconnected world.
What are the key market drivers leading to the rise in the adoption of Cable Assembly Industry?
- The surge in demand for electric vehicles (EVs) serves as the primary catalyst for market growth.
- Cable assemblies play a crucial role in various onboard systems of vehicles, including battery and power supply, ignition systems, steering systems, braking systems, interior and exterior lighting, and safety and security. With the increasing number of electronic components such as rear camera systems, navigation systems, and mobile and Bluetooth connections, the demand for cable assemblies is on the rise. The global automotive industry is experiencing steady growth, primarily driven by the Asia Pacific region. Additionally, the global electric vehicles (EVs) market is expanding at a faster pace due to the growing focus on the environment and the depletion of fossil fuel reserves.
- In this context, multi-conductor cables, including ribbon cables, are essential components of cable assemblies. These cables ensure signal integrity and return loss while providing cable management solutions. High-voltage applications in EVs necessitate cable assemblies with robust quality control, ROHS compliance, and EMI shielding. Wire harnesses are used to bundle and protect multiple cables, ensuring efficient cable management and reducing clutter. Cable assemblies must meet stringent industry standards for safety and performance. Quality control measures, such as testing for surge protection and immunity to electromagnetic interference, are essential to ensure the reliability and durability of cable assemblies.
- The focus on signal integrity and return loss is critical in applications such as medical devices, where cable assemblies must transmit sensitive data accurately and reliably. In conclusion, the demand for cable assemblies is driven by the growing automotive industry and the increasing use of electronic components in vehicles. Multi-conductor cables, ribbon cables, wire harnesses, and other cable assembly components are essential for ensuring signal integrity, return loss, cable management, and safety in various applications. The need for high-quality cable assemblies with robust quality control, ROHS compliance, and EMI shielding is paramount to meet the evolving demands of the industry.
What are the market trends shaping the Cable Assembly Industry?
- The expansion of data centers represents a significant market trend in the technology industry. This growth is driven by the increasing demand for digital services and the need for businesses to store and process large volumes of data efficiently.
- The market is experiencing significant growth due to the increasing demand for data centers worldwide. The surge in data traffic from businesses and individual consumers has led to the construction of new data centers and expansions of existing ones. This trend is driving the need for cable assemblies, which help reduce costs and power consumption in data centers. Compliance with industry standards, such as those related to low-voltage applications, is crucial in this market. Coaxial and fiber optic cables are commonly used in data centers, with jacket materials and conductor materials selected based on their ability to minimize far-end crosstalk and ensure harmonious signal transmission.
- Backplane assemblies are also in demand for their role in connecting printed circuit boards within data centers. Military applications, particularly those requiring high-speed data transfer and signal integrity, also contribute to the market's growth. Cable assembly manufacturers focus on offering products that cater to the unique requirements of data centers and various applications, ensuring continued market expansion.
What challenges does the Cable Assembly Industry face during its growth?
- The proliferation of counterfeit and grey-market products poses a significant challenge to the industry, threatening its growth and undermining the integrity of legitimate businesses.
- Cable assemblies have become an essential component in various industries, including aerospace and automotive, due to the increasing demand for high-speed data transmission. The market for cable assemblies has seen significant growth over the past decade, with numerous local and global companies offering a range of products. China, in particular, hosts over 1,000 plants producing wiring and cable assemblies. End-users focused on producing high-quality products often procure cable assemblies from established companies to ensure superior performance. However, some end-users, seeking to maximize their profit margins, opt for counterfeit products from local manufacturers. As a result, the market is saturated with low-quality, unbranded cable assemblies, leading to challenges in product differentiation.
- Key factors driving the market include the increasing demand for high-speed data transmission, such as propagation delay and insertion loss minimization. Twisted pair cables and standard cable assemblies are popular choices for applications requiring near-end crosstalk reduction. In the aerospace sector, shielded cables and harness designs are crucial for electromagnetic interference protection. Component sourcing is another critical aspect of the market, as the quality and reliability of the components used significantly impact the overall performance of the cable assembly. Ensuring component authenticity and maintaining a consistent supply chain are essential for companies to deliver high-quality cable assemblies to their clients.
Exclusive Customer Landscape
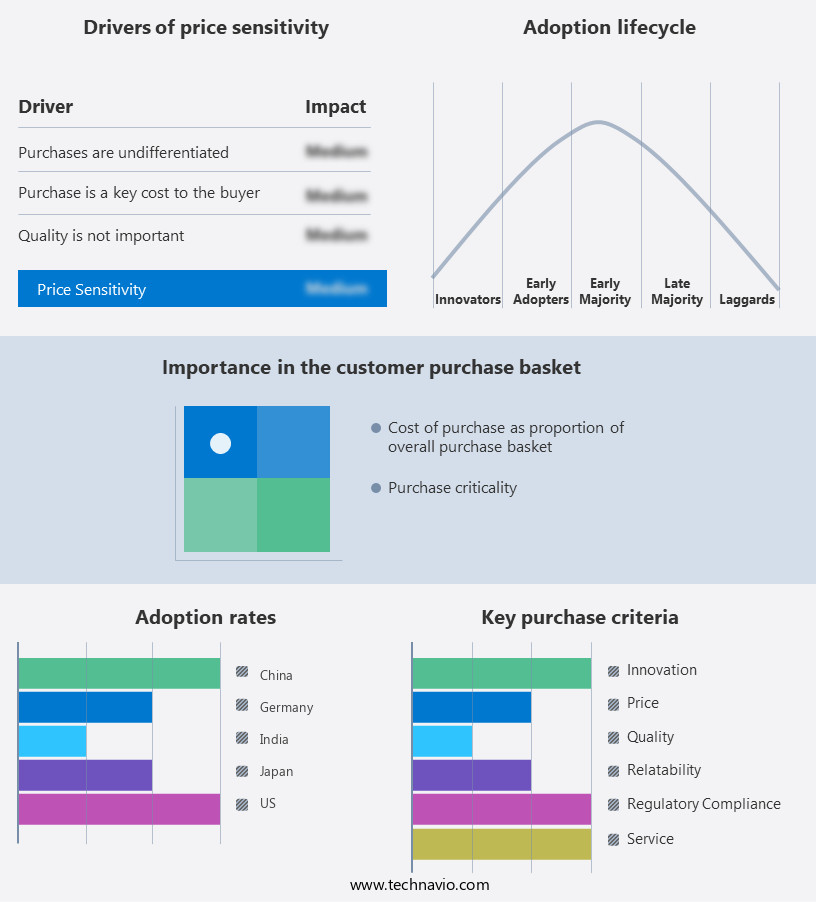
The cable assembly market forecasting report includes the adoption lifecycle of the market, covering from the innovator’s stage to the laggard’s stage. It focuses on adoption rates in different regions based on penetration. Furthermore, the cable assembly market report also includes key purchase criteria and drivers of price sensitivity to help companies evaluate and develop their market growth analysis strategies.
Customer Landscape
Key Companies & Market Insights
Companies are implementing various strategies, such as strategic alliances, cable assembly market forecast, partnerships, mergers and acquisitions, geographical expansion, and product/service launches, to enhance their presence in the industry.
3M Co. - Specializing in cable assembly production, we deliver industrial-grade solutions including camera assemblies, MDR and SDR variants, and molded on designs. Our expertise elevates search engine visibility while maintaining a clear, informative message. Offerings encompass a range of applications, ensuring alignment with our commitment to quality and innovation.
The industry research and growth report includes detailed analyses of the competitive landscape of the market and information about key companies, including:
- 3M Co.
- Amphenol Corp.
- Aptiv Plc
- BizLink Holding Inc.
- Cablecraft Motion Controls LLC
- Carlisle Companies Inc.
- Carrio Cabling Corp.
- Copartner Tech Corp.
- Corning Inc.
- Fischer Connectors Holding SA
- Japan Aviation Electronics Industry Ltd.
- Koch Industries Inc.
- Minnesota Wire and Cable Co.
- Nexans SA
- NKT AS
- Prysmian SpA
- RF Industries Ltd.
- Samtec Inc.
- Smiths Group Plc
- TE Connectivity Ltd.
Qualitative and quantitative analysis of companies has been conducted to help clients understand the wider business environment as well as the strengths and weaknesses of key industry players. Data is qualitatively analyzed to categorize companies as pure play, category-focused, industry-focused, and diversified; it is quantitatively analyzed to categorize companies as dominant, leading, strong, tentative, and weak.
Recent Development and News in Cable Assembly Market
- In January 2024, TE Connectivity, a leading global supplier of connectivity and sensor solutions, announced the launch of its new high-speed cable assembly solution, the Nexans AWG-220, designed for data center applications. This innovation offers improved performance and density, addressing the growing demand for faster data transfer in cloud computing and artificial intelligence sectors (TE Connectivity press release).
- In March 2024, Amphenol Corporation, a leading interconnect technology company, entered into a strategic partnership with Huawei Technologies Co. Ltd., a global leader in telecommunications equipment, to develop advanced cable assemblies for 5G infrastructure. This collaboration aims to enhance Amphenol's presence in the telecommunications market and support Huawei's 5G expansion plans (Amphenol Corporation press release).
- In July 2024, Bel Fuse Inc., a leading manufacturer of products that protect and connect electronic circuits, completed the acquisition of Meridian Cable Corporation, a leading provider of custom-engineered cable assemblies and wire harnesses. This acquisition strengthened Bel Fuse's position in the automotive and industrial markets, expanding its product offerings and broadening its customer base (Bel Fuse Inc. SEC filing).
- In May 2025, the European Union (EU) passed the new Circular Electronics Initiative, which includes regulations for the recycling and reuse of cable assemblies in electronic devices. This initiative aims to reduce electronic waste and promote a circular economy within the EU electronics industry (European Commission press release).
Research Analyst Overview
- The market experiences dynamic growth driven by increasing demand for power transmission and data transfer in various industries. Connector density and number of conductors continue to rise, necessitating wire gauges that balance conductivity with cable weight. Supply chain management and inventory management are crucial for ensuring timely delivery and compliance with regulatory affairs. Compliance testing, shock resistance, signal amplification, and data transfer rate are key considerations for cable assemblies in power transmission applications. Abrasion resistance, environmental sealing, operating temperature, and thermal management are essential factors in cable assemblies for harsh environments. Product lifecycle management, design for manufacturing, and design for assembly optimize production processes and reduce costs.
- Vibration resistance, strain relief, and corrosion resistance enhance cable durability. Customer needs dictate connector type selection, while pricing strategies and distribution channels influence market competition. Cable length, life cycle assessment, and quality assurance are critical factors in ensuring customer satisfaction. Noise reduction technologies are increasingly important for high-speed data transfer applications.
Dive into Technavio’s robust research methodology, blending expert interviews, extensive data synthesis, and validated models for unparalleled Cable Assembly Market insights. See full methodology.
|
Market Scope |
|
|
Report Coverage |
Details |
|
Page number |
261 |
|
Base year |
2024 |
|
Historic period |
2019-2023 |
|
Forecast period |
2025-2029 |
|
Growth momentum & CAGR |
Accelerate at a CAGR of 7.3% |
|
Market growth 2025-2029 |
USD 91.8 billion |
|
Market structure |
Fragmented |
|
YoY growth 2024-2025(%) |
6.6 |
|
Key countries |
China, Germany, Japan, India, South Korea, US, Australia, Canada, UK, and France |
|
Competitive landscape |
Leading Companies, Market Positioning of Companies, Competitive Strategies, and Industry Risks |
What are the Key Data Covered in this Cable Assembly Market Research and Growth Report?
- CAGR of the Cable Assembly industry during the forecast period
- Detailed information on factors that will drive the growth and forecasting between 2025 and 2029
- Precise estimation of the size of the market and its contribution of the industry in focus to the parent market
- Accurate predictions about upcoming growth and trends and changes in consumer behaviour
- Growth of the market across APAC, North America, Europe, Middle East and Africa, and South America
- Thorough analysis of the market’s competitive landscape and detailed information about companies
- Comprehensive analysis of factors that will challenge the cable assembly market growth of industry companies
We can help! Our analysts can customize this cable assembly market research report to meet your requirements.